The Market Mosaic 9.15.24
Can the S&P 500 survive Fed rate cuts?
Welcome back to The Market Mosaic, where I gauge the stock market’s next move by looking at macro, technicals, and market internals. I’ll also highlight trade ideas using this analysis.
If you find this content helpful please hit that “like” button, share this post, and become a subscriber if you haven’t already done so!
And be sure to check out Mosaic Chart Alerts. It’s a midweek update covering chart setups among long and short trade ideas in the stock market, along with levels I’m watching.
For today’s update, I want to highlight several key charts I’m watching for the capital markets and how they are impacting the near-term outlook.
I also have a quick summary and links to recent posts that remain impactful for monitoring the markets. And after that, you can find a few trade ideas and chart updates on setups that I’m monitoring.
Big Picture
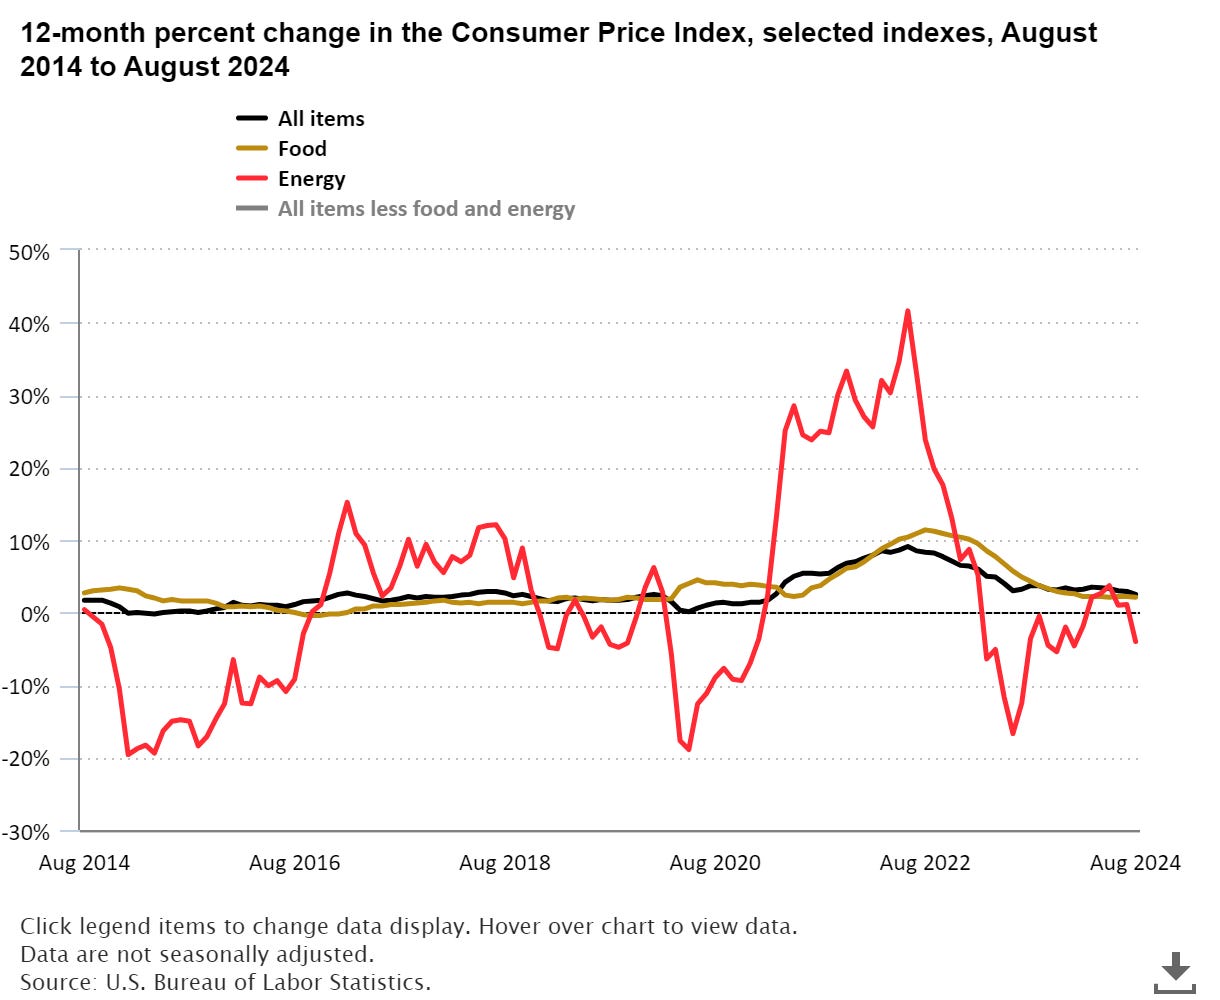
A “Goldilocks” economy is giving the Federal Reserve the green light to start cutting interest rates. As evidenced by the most recent payrolls report, the labor market is cooling with the three month average payrolls growth the lowest since 2020 (but still positive). And last week’s Consumer Price Index (CPI) for the month of August showed consumer inflation at 2.5% year-over-year, which is the lowest level since March 2021 and below CPI’s recent cycle peak at nearly 9% in 2022 (chart below). That shows progress on the Fed’s price stability mandate, while high interest rates pose a growing risk to the Fed’s full employment mandate.
As the Fed tries to balance achieving its two mandates across low inflation and a healthy labor market, the short-term fed funds rate has been on hold at the 5.25-5.50% level since last August. Right now, that’s the highest above inflation since just before the 2008 financial crisis (chart below). That means the central bank has scope to reduce interest rates, but the Fed has given few details on the pace and magnitude of rate cuts. Based on current market-implied odds, there’s a 50/50 chance between a 0.25% and 0.50% rate cut at the Fed’s meeting this week.
While economists debate over the the size and speed of upcoming rate cuts, the 2-year Treasury yield is sending a clear message. The 2-year yield has a history of leading changes in the Fed’s policy rate, and right now the 2-year is plunging. You can see in the chart below that the 2-year has fallen to 3.57% compared to 4.35% at the end of July. That puts the 2-year nearly 200 basis points below the current fed funds upper target of 5.50%, and shows the bond market expects a relatively quicker pace of rate cuts.
When the Fed starts cutting rates, the path of the stock market over the next 12 months comes down to the performance of the economy. The stock market takes a diverging path that depends on recession and the impact to corporate earnings. If a recession can be avoided, then small-caps in particular deserve attention. The chart below shows the performance of small-, mid-, and large-cap stocks over multiple forward time periods after the Fed starts cutting rates historically. Small-caps outperform other capitalization ranges over all shown timeframes.
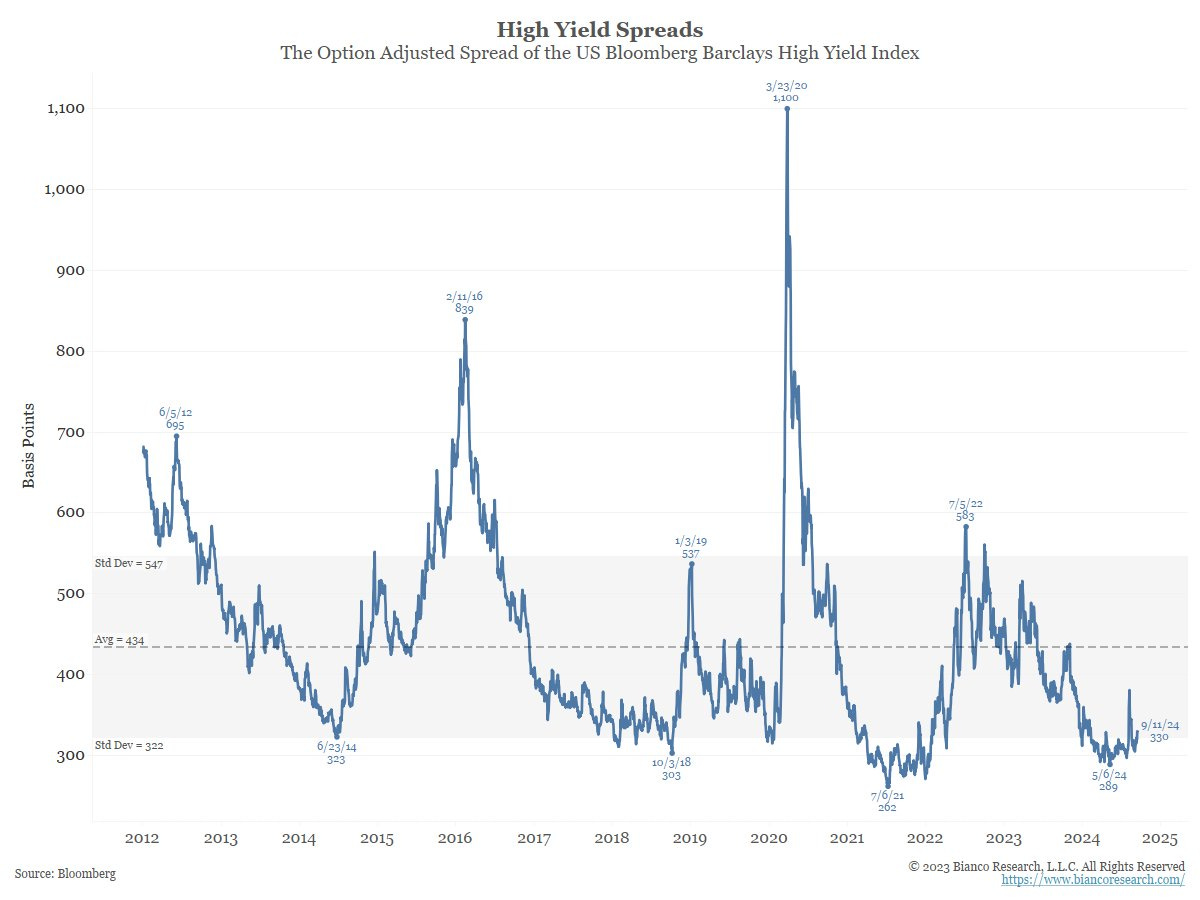
The high yield bond market is currently signaling an “all clear” for the economy. Total return high yield indexes are hitting fresh highs, and were holding up in early September even as the S&P 500 was selling off. High yield spreads are also near historic lows (chart below). Spreads represent the level of additional compensation that investors demand over a safer security like Treasury bonds. When that spread widens, it shows investors becoming more concerned about the economic outlook by demanding more compensation to lend to risky companies. But low spreads translate to a positive outlook, with spreads currently hovering near historic lows.

Once the Fed starts cutting interest rates, traders should also keep an eye on the U.S. Dollar Index (DXY). The dollar put in a small rally off support at the 100 to 101 zone that you can see at the arrow in the chart below. That’s resetting the MACD below the zero line while the RSI is turning lower from the 50 level. That shows price momentum remains weak, where a break below 100 could have significant implications. A lower dollar helps boost S&P 500 earnings (international profits become worth more in dollar terms), while commodities priced in dollars can see a tailwind. That includes gold and silver prices that are rallying over key breakout levels.
Mosaic Tidbits
Here are a few of my recent posts that are still impactful and relevant to the stock market’s next move:
The S&P 500 posted its best week of the year with a gain of 4% last week. But stocks are now entering the worst two week stretch of the year based on historic seasonality trends.
The forward path of stocks is heavily dependent on the earnings picture, especially once the Fed starts cutting interest rates. Earnings are highly correlated to economic activity, with recessions having an outsized impact on S&P 500 earnings drawdowns.
Following the action in cyclical sectors can provide an edge in forecasting the economic outlook. Here are the types of sectors to follow, and what they’re now saying about the state of the economy.
Stock market breadth is sending a mixed signal. While breadth is surging on the rally off the August lows, another measure is pointing to a pullback in participation on the S&P 500’s test of a key level.
Chart Updates
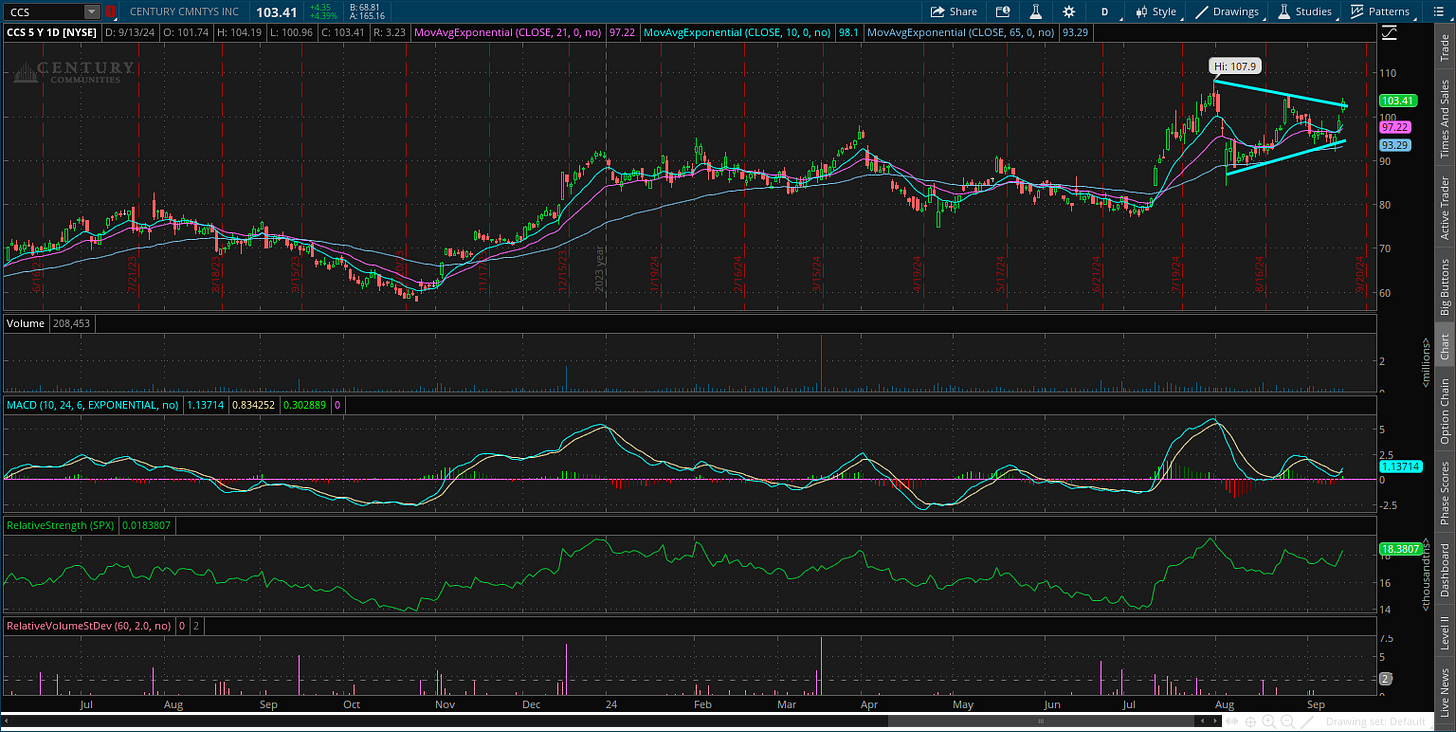
Century Communities (CCS)
After moving over the $90 level, the stock is consolidating gains and back testing that level as support while creating a bullish pennant pattern. The MACD is resetting and turning up at the zero line with the relative strength line is holding near the high. I’m watching for a move over $105.
PulteGroup (PHM)
Another homebuilder emerging from a constructive continuation pattern. After moving over the $120 level, the stock created an ascending triangle pattern with resistance at the $135 level. Price is breaking above that level on higher volume with the relative strength line at new highs.
Ford (F)
If we get seasonal weakness in the stock market during the last two weeks of September, I’ll be watching the $10 level on Ford (F) for a potential short trade. The chart below shows $10 being tested a couple times since last October. The stock is turning lower after a MACD reset below the zero line. Take the chart back several years and you’ll see it’s a key support level to watch.
I hope you’ve enjoyed The Market Mosaic, and please share this report with your family, friends, coworkers…or anyone that would benefit from an objective look at the stock market.
And make sure you never miss an edition by subscribing here:
For updated charts, market analysis, and other trade ideas, give me a follow on X: @mosaicassetco
And if you have any questions or feedback, feel free to shoot me an email at mosaicassetco@gmail.com
Disclaimer: these are not recommendations and just my thoughts and opinions…do your own due diligence! I may hold a position in the securities mentioned in this report.


PHN has been a staple in my portfolio!