The Market Mosaic 9.29.24
Turbocharging the liquidity cycle is bullish for stocks.
Welcome back to The Market Mosaic, where I gauge the stock market’s next move by looking at macro, technicals, and market internals. I’ll also highlight trade ideas using this analysis.
If you find this content helpful please hit that “like” button, share this post, and become a subscriber if you haven’t already done so!
And be sure to check out Mosaic Chart Alerts. It’s a midweek update covering chart setups among long and short trade ideas in the stock market, along with levels I’m watching.
Now for this week’s issue…
A fresh round of fiscal and monetary stimulus from the world’s largest economies are set to boost global economic activity.
On September 18, the Federal Reserve cut interest rates by 0.50%. That was the first cut in over four years, while the Fed hasn’t cut by that magnitude since the middle of the pandemic.
Not only has the Fed’s focus shifted toward boosting the labor market and economy, but other countries are joining the stimulus bandwagon to jolt their economy.
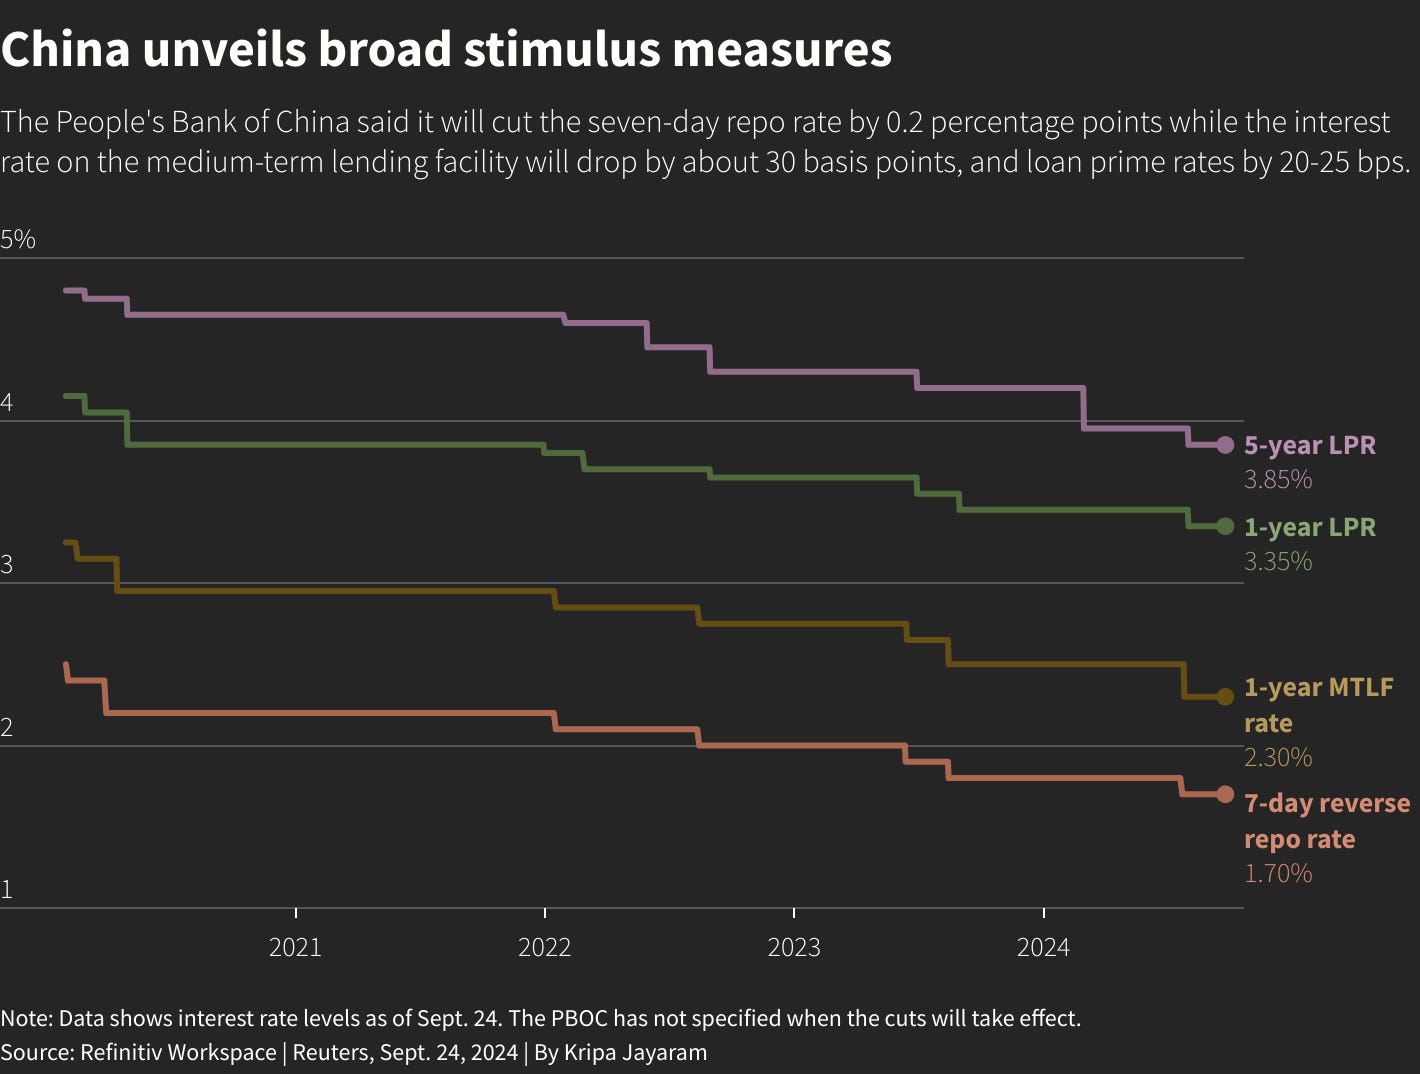
Just last week, China’s central bank announced a surprise cut to key interest rates and reduced reserve requirements for its banks among other stimulus measures. All together, it’s the most aggressive easing measures since 2015 for the world’s second-largest economy.
Chinese stocks jumped in response, with the iShares MSCI China ETF (MCHI) having its best week ever with a 19% gain as you can see in the chart below. But it doesn’t stop there. A look at central banks around the world shows a collective shift toward easing monetary policy by cutting interest rates.
As you can see in the chart below, the percentage of central banks around the world that are cutting rates rose above 50% (blue line) in July for the first time since early 2022. If you weight by GDP, the net proportion of central banks whose last move was a cut surged into positive territory this month.
A coordinated round of global central bank stimulus has massive implications for the economic outlook and corporate earnings picture. It could also ignite several areas of the capital markets and deliver the next round of chart breakouts.
Here are the cyclical sectors I’m following, and why they add to the weight of the evidence that the economic outlook remains positive and the bull market can push higher following recent central bank actions.
Liquidity is Boosting More Cyclical Sectors
During a recent outlook report covering the next 12-18 months, I outlined a bullish view that’s being driven by three distinct catalysts.
One of those catalysts is the longer-term liquidity cycle, which is in the early stages of an upswing and will be boosted further as central banks ease.
In addition, there’s still $2 trillion in fiscal spending from legislation like the the Infrastructure Investment and Jobs Act and Inflation Reduction Act making its way through the economy.
If those catalysts are going to deliver a boost to the economy, then cyclical and commodity-linked stocks should be providing confirmation. And that’s where I’m following the next key round of breakouts and setups.
That includes the XLB materials ETF that holds stocks like Dow Inc (DOW) and steel-maker Nucor (NUE). You can see in the weekly chart below that XLB is moving out to fresh highs after breaking out from a basing period going back to 2022.
XLB moved above resistance at the $87 level back in February. Since then, price is trading in a tight range while back testing the breakout level as support. But just last week, XLB is moving out to new highs following another five month consolidation.
You’re also seeing a quick reversal higher in copper miners from a bullish chart pattern. As questions swirled over the health of China’s economy, copper stocks like Freeport-McMoRan (FCX) pulled back from their highs made earlier this year.
But take a look at the COPX fund that holds copper mining stocks. After moving out from a symmetrical triangle pattern, price came back to test the breakout level around $40. In doing so, price created a bullish falling wedge, where COPX is breaking out last week and is quickly back near the prior highs.
I’m also watching chart developments in the transportation sector with IYT in the weekly chart below. The link between economic activity and companies involved with moving goods through land and air is clear.
Transports last peaked around the $68 level back in 2021. After bottoming in late 2022, price is making a series of higher lows while testing resistance on several occasions this year. The weekly MACD and RSI shows momentum is just starting to turn higher, where a breakout would be yet another confirming indicator on the outlook.
We’ve already been seeing positive action in sectors like housing, banks, and small-caps. The chart developments highlighted above adds further weight to the evidence for an improving economic outlook, and that a recession will be avoided over the intermediate-term just as central banks take stimulative action.
Now What…
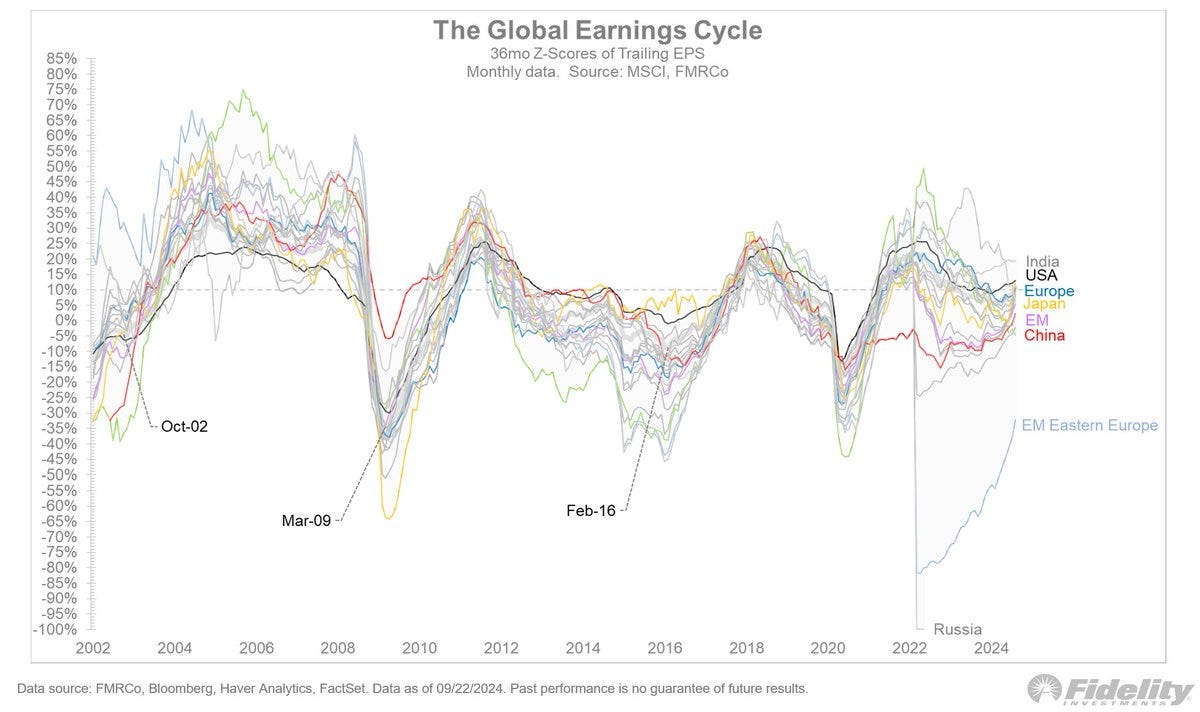
Stock prices will ultimately follow corporate earnings, which depends on a strong economy to move higher. The price signals coming cyclical sectors is a positive for the earnings outlook, and is arriving just as the earnings cycle is inflecting higher in regions around the world.
You can see in the chart below that earnings growth is turning higher across most regions after decelerating since 2022. A positive rate of change in earnings should be a tailwind for stock prices, which historically has also resulted in a favorable trading environment.

Earnings and commodity sectors could also be lined up for a boost from another catalyst, and that’s with a weakening U.S. dollar. I’ve written extensively in the past about the U.S. Dollar Index (DXY), and the importance of the 100 level.
You can see below that DXY is again testing the 100 level following a bearish momentum reset with both the MACD and RSI. A break below 100 would be another tailwind for corporate earnings (since sales and earnings from abroad become worth more in dollar terms). And since many commodities are priced and traded in U.S. dollars, a weakening dollar should be a positive catalyst for commodities and related producers.
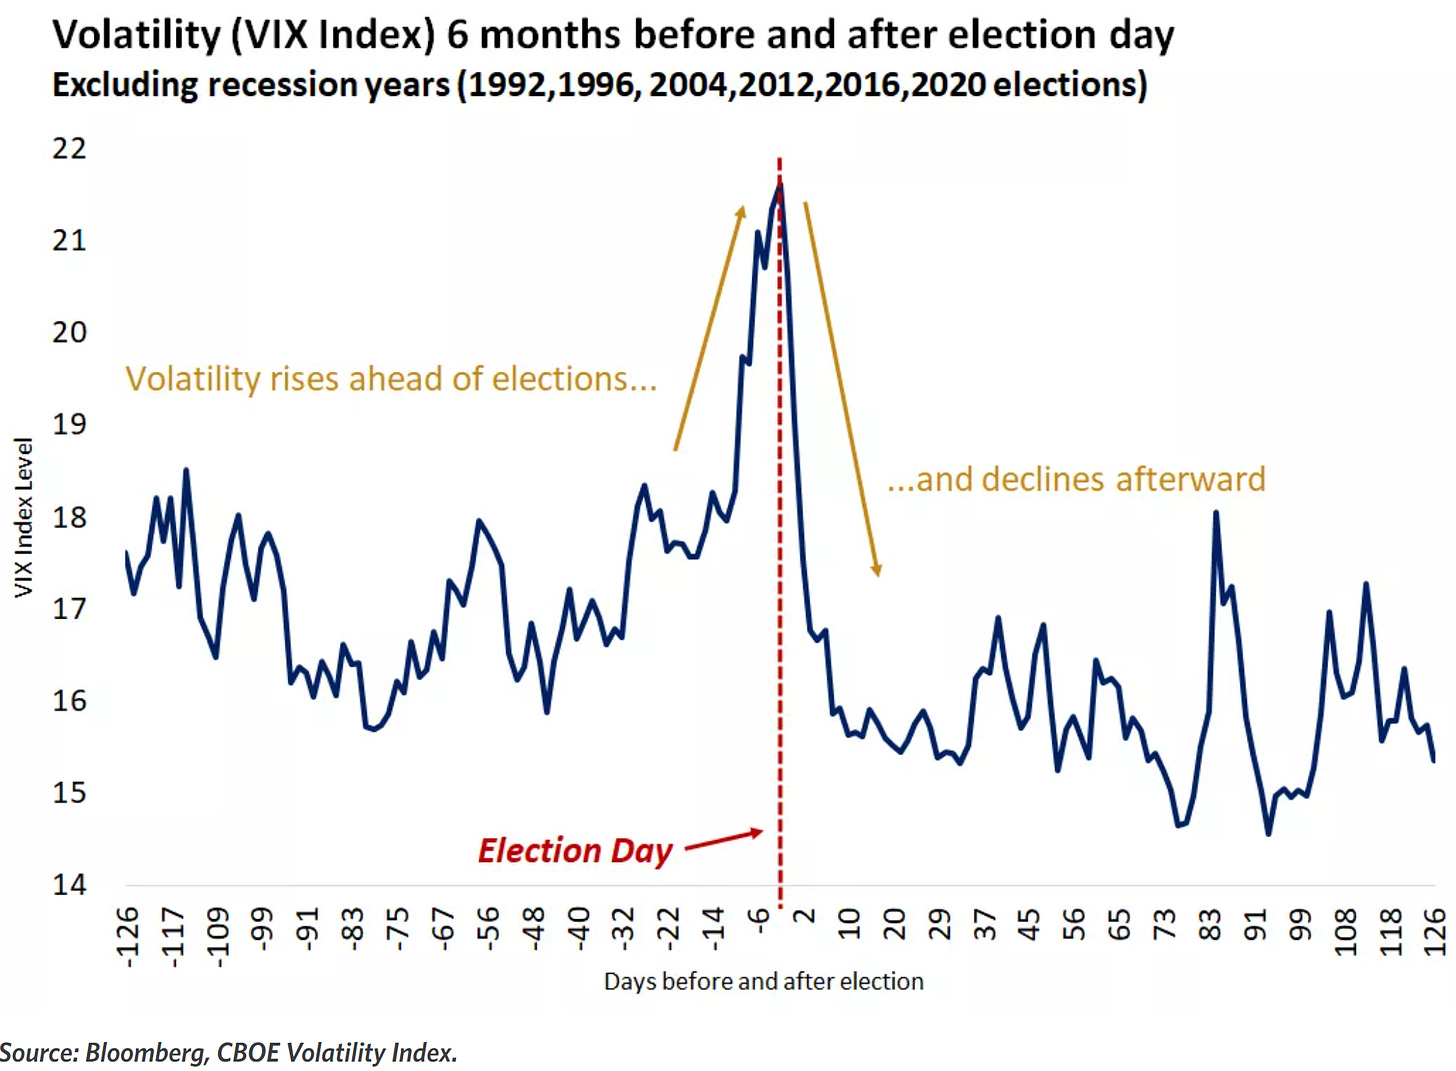
The longer-term outlook for the economy and stock prices remains bullish in my opinion, but investors should be prepared for election cycle volatility. As I highlighted in my most recent Mosaic Chart Alerts, this is about the time that downside arrives based on historic seasonal trends including the presidential election cycle going back to 1928.
The chart below also shows the CBOE Volatility Index (VIX) in the six months before and after presidential elections. On average, you can see that the VIX starts moving higher about two months ahead of election day, then really accelerates in the final month before elections.
At this point, I expect any volatility heading into the election to just be a pause in the broader bull market trend given the ongoing message coming from cyclical sectors and fresh central bank stimulus helping the liquidity backdrop. As a result, I’m still favoring trade setups in cyclical areas of the market.
That includes Tri Pointe Homes (TPH). After rallying to the $47 level in July, the stock has been consolidating gains. TPH is showing constructive action by making a series of smaller pullbacks off the $47 resistance level, while the relative strength (RS) line is holding near the high. I’m watching for a breakout over $47 on higher volume and confirmation by the RS line.
That’s all for this week. The coming week will feature key reports on activity in the manufacturing and services sector of the economy, along with the payrolls report for the month of September. But I’ll be watching if cyclical stocks can hold and build on their breakouts, and the message they’re sending for the broader market and economic outlook.
I hope you’ve enjoyed The Market Mosaic, and please share this report with your family, friends, coworkers…or anyone that would benefit from an objective look at the stock market.
And make sure you never miss an edition by subscribing here:
For updated charts, market analysis, and other trade ideas, give me a follow on X: @mosaicassetco
And if you have any questions or feedback, feel free to shoot me an email at mosaicassetco@gmail.com
Disclaimer: these are not recommendations and just my thoughts and opinions…do your own due diligence! I may hold a position in the securities mentioned in this report.


Great thoughts per usual. Really liked the first chart too, showing the global easing cycle just getting started with the number of Central Banks cutting rates increasing drastically.