The Market Mosaic 9.17.23
Can the S&P 500 breakout?
Welcome back to The Market Mosaic, where I gauge the stock market’s next move by looking at macro, technicals, and market internals. I’ll also highlight trade ideas using this analysis.
If you find this content helpful please hit that “like” button, share this post, and become a subscriber to this always free report if you haven’t already done so!
And be sure to check out Mosaic Chart Alerts. It’s a midweek update covering chart setups among long and short trade ideas in the stock market, along with levels I’m watching.
Now for this week’s issue…
Happy Sunday! This weekend, I’m going to change up my usual post just a bit. First, I’m going to highlight a few of the most important charts I’m watching for the stock market today, and how they are impacting the near-term outlook.
Next, I have a quick summary and links to recent posts that remain impactful for monitoring the capital markets. And after that, you can find a few bonus trade ideas at the end.
And please do me a huge favor and let me know what you think about this format. Is this something you would like to see periodically?
Big Picture
Ever since topping out in late July, the S&P 500 is filling out a triangle pattern. These tend to be continuation patterns, which means the base case scenario should be upside resolution. But I’m also watching the relative strength index (RSI) in the bottom panel for clues on the next move. A breakout of the recent RSI range could tip the next near-term move in the index.
One chart that could also influence the next move in stocks is with interest rates on the long end. The 10-year Treasury yield is right at the highs from last year around 4.34%. On one side, rising interest rates can negatively impact stock valuations and draw investor capital into fixed income. On the other, rising rates can signal a positive outlook for the economy and thus the corporate earnings picture.
While large-caps and technology/growth stocks have led the way this year, small-caps have been a noticeable pocket of weakness. Smalls are barely positive on the year, and are clinging to support at the 200-day moving average (MA - green line). If the signal from rates in the chart above is a stronger economic outlook, you would expect some confirmation from smalls. While you can also see a bearish head and shoulders pattern since June, a positive RSI divergence is forming on this 200-day test.
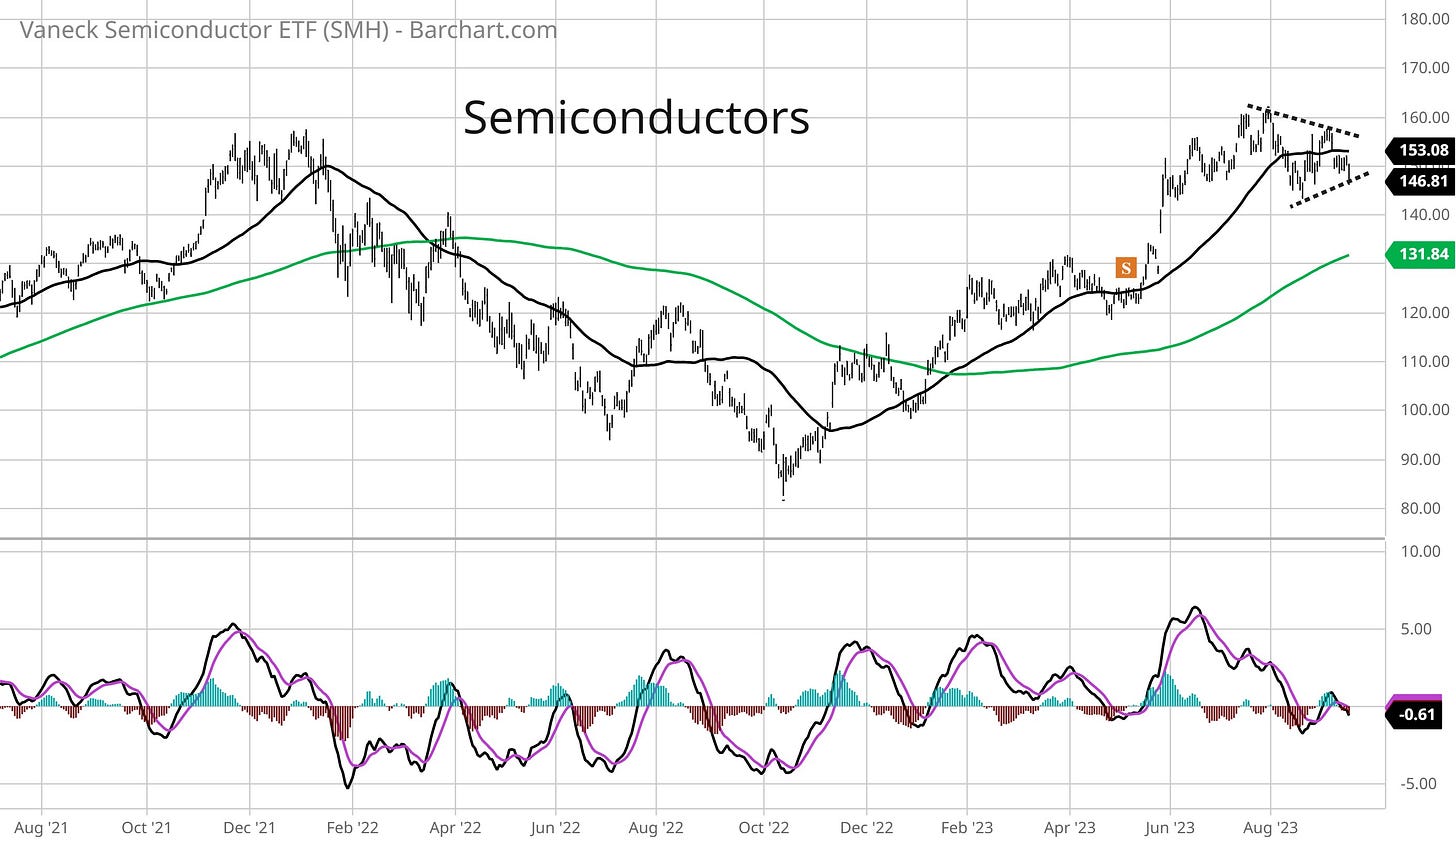
Semiconductors is another stock sector that you want to see holding up. Similar to transportation companies, chip stocks are a leading indicator for the economy. And so far this year, chip stocks have been a top performing sector. Price is consolidating those gains after trading at the highs from 2021. A break from the recent triangle will be an important signal on the outlook for the economy and stock market.
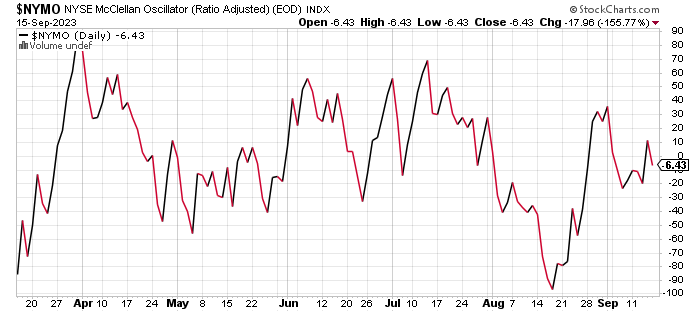
Market breadth has become a mixed bag lately. After surging from an extremely oversold reading in mid-August, the NYSE McClellan Oscillator has been chopping around zero. That indicates balance among advancing and declining stocks on the NYSE, and reflects the overall choppiness in the S&P 500.
But so far on this pullback since late July, net new 52-week lows across the market have stayed contained. A drop below -500 during a pullback would signal potential for a larger drawdown ahead like the deterioration at the end of 2021. But so far, net new lows are not seeing a meaningful expansion.
Mosaic Tidbits
Here are a few recent posts that are still impactful and relevant to the stock market’s next move:
The S&P 500 finished Friday with a 1.2% loss. Here are three metrics that will signal if a larger drawdown is ahead.
But despite the disappointing end to last week for stocks, you should monitor this message from the market that new all time highs could be around the corner.
A pullback in growth stocks could weigh on the stock market. But cyclical sectors in the energy and commodity space are showing relative strength.
Plus trade ideas I’m watching from the most recent Mosaic Chart Alerts post.
Chart Updates
As I wrap up my weekly scans, here are a few extra trade ideas that I’m monitoring.
XPRO
Trading is a tight range since late July after testing resistance at the $24 level. That consolidation reset the MACD at the zero line, with price now trying to breakout. The relative strength (RS) line is also close to a 52-week high.
VSEC
Creating an ascending triangle pattern since March with resistance at $59. A breakout could test the prior highs from 2021 just above at $63, setting up a move to new all time highs.
RNGR
Former watchlist stock that is smaller-cap and more speculative (so position size accordingly). Took out resistance at the $12 level that goes back to 2021. Price trading in a tight range over the past month and resetting the MACD. Now watching for a move over $13.
That’s all for now! Next week features the Federal Reserve’s latest rate-setting meeting, with market-implied odds pointing to no interest rate hike. But investors will be paying close attention to comments on recent inflation and other economic reports, and what that means for the rate path going forward.
I hope you’ve enjoyed The Market Mosaic, and please share this report with your family, friends, coworkers…or anyone that would benefit from an objective look at the stock market.
And make sure you never miss an edition by subscribing here:
For updated charts, market analysis, and other trade ideas, give me a follow on Twitter: @mosaicassetco
And if you have any questions or feedback, feel free to shoot me an email at mosaicassetco@gmail.com
Disclaimer: these are not recommendations and just my thoughts and opinions…do your own due diligence! I may hold a position in the securities mentioned in this report.


Great analysis!!
Great post, Mosaic. Prep for the week 😎