The Market Mosaic 9.1.24
Rate cuts + strong economy = buy stocks.
Welcome back to The Market Mosaic, where I gauge the stock market’s next move by looking at macro, technicals, and market internals. I’ll also highlight trade ideas using this analysis.
If you find this content helpful please hit that “like” button, share this post, and become a subscriber if you haven’t already done so!
And be sure to check out Mosaic Chart Alerts. It’s a midweek update covering chart setups among long and short trade ideas in the stock market, along with levels I’m watching.
For today’s update, I want to highlight several key charts I’m watching for the capital markets and how they are impacting the near-term outlook.
I also have a quick summary and links to recent posts that remain impactful for monitoring the markets. And after that, you can find a few trade ideas and chart updates on setups that I’m monitoring.
Big Picture
After a month fueled by volatility, the S&P 500 ended the month of August with a 2.3% gain. It was the fourth consecutive month of positive returns, despite a jump in the CBOE Volatility Index (VIX) to its third highest level in history at the start of the month. In the chart below, you can see the S&P 500 fell close to correction territory on an intraday basis with a decline of nearly 10% off the July peak. Following several capitulation signals, price found support at 5200 (shaded area) and rallied back near the prior highs. Also note the upside gap over the 50-day moving average shown with the arrow (watch for a gap fill).
The Federal Reserve has clearly shifted the focus of their dual mandate away from price stability and toward the labor market. And the most recent PCE inflation report for the month of July didn’t contain the type of negative surprises that could derail expectations for a new interest rate cutting cycle starting this month. The core PCE inflation measure came in at 2.6% year-over-year for July which was slightly below economist estimates. While that’s above the Fed’s 2% inflation target, the annualized pace of core PCE over more recent time frames is back near the Fed’s inflation target as you can see below.

Despite core PCE inflation still running above the Fed’s inflation target, the spread between the fed funds rate and core PCE inflation is another reason to expect a rate cutting cycle. Currently, the effective fed funds rate is at 5.33% versus core PCE at 2.6%. That is the widest spread of fed funds to core PCE inflation since 2007, highlighting the tightest monetary stance by the Fed in 17 years as you can see below.

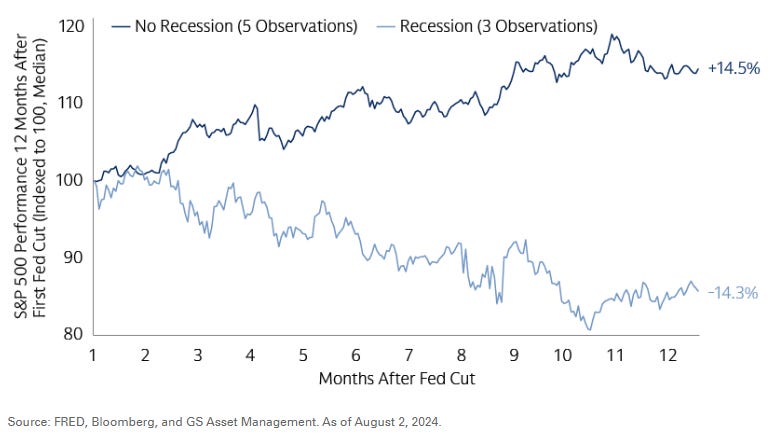
When a new rate cutting cycle gets underway, the path of the stock market ultimately comes down to tipping into recession or not. That’s because stock prices follow earnings over the long-term, and the performance of the economy is reflected in the corporate earnings outlook. The chart below plots the S&P 500 over a 12-month stretch following the first rate cut. When the economy avoids recession, the S&P 500 has gone on to return 14.5% versus a decline of 14.3% when recession hits.
If the Fed starts cutting rates and the economy avoids recession, then small-cap stocks could be an attractive option. Approximately 33% of companies in the Russell 2000 Index of small-cap stocks are financed with floating rate debt compared to just 6% in the S&P 500. And small-caps receive a larger share of revenues from domestic sources versus large-caps, making them more sensitive to developments with the U.S. economy. Historically, small-caps have outperformed both mid- and large-caps during the three-, six-, and 12-month periods after the first rate cut using data going back to 1950 (chart below).
Get ready for the worst month of the year. Across stats including average return and hit rate for positive performance, September is clearly the worst calendar month of the year for the S&P 500. Going back to 1948, the S&P 500 has averaged a 0.70% loss for the month. February is the only other month to see an average loss over that time span. It’s also worth noting that the period of poor performance is typically seen during the second half of the month. You can see that in the chart below that plots the S&P 500’s average return during the year for the past 20 years.
Mosaic Tidbits
Here are a few of my recent posts that are still impactful and relevant to the stock market’s next move:
A recent surge in breadth points to the involvement of institutional investors. Several breadth thrusts are triggering, and why that’s a positive sign for the economic and stock market outlook.
Following his speech at Jackson Hole, Jerome Powell and the Federal Reserve are clearly concerned about recent weakening in the labor market. The Fed is increasing focus on their full employment mandate, which means a new rate cutting cycle is about to begin.
Poor S&P 500 seasonality is on the way, but don’t get lost in the noise. Stock prices follow earnings over the long-term, and forward forecasts for S&P 500 earnings per share are hovering near the all-time highs.
Understanding sources of volatility can help you deconstruct rapid selloffs in the stock market, and if surging vol levels should be of concern. Here’s my breakdown of the early August vol spike, and why I believed it was a temporary setback.
Chart Updates
Taylor Devices (TAYD)
Peaked at the $60 level after moving out of a large base in January. Consolidating gains since April, with an initial resistance level to monitor at the $53 level. The stock is moving over that level following a MACD reset at the zero line. The prior peak around $60 is the next resistance level to watch.
Meta Platforms (META)
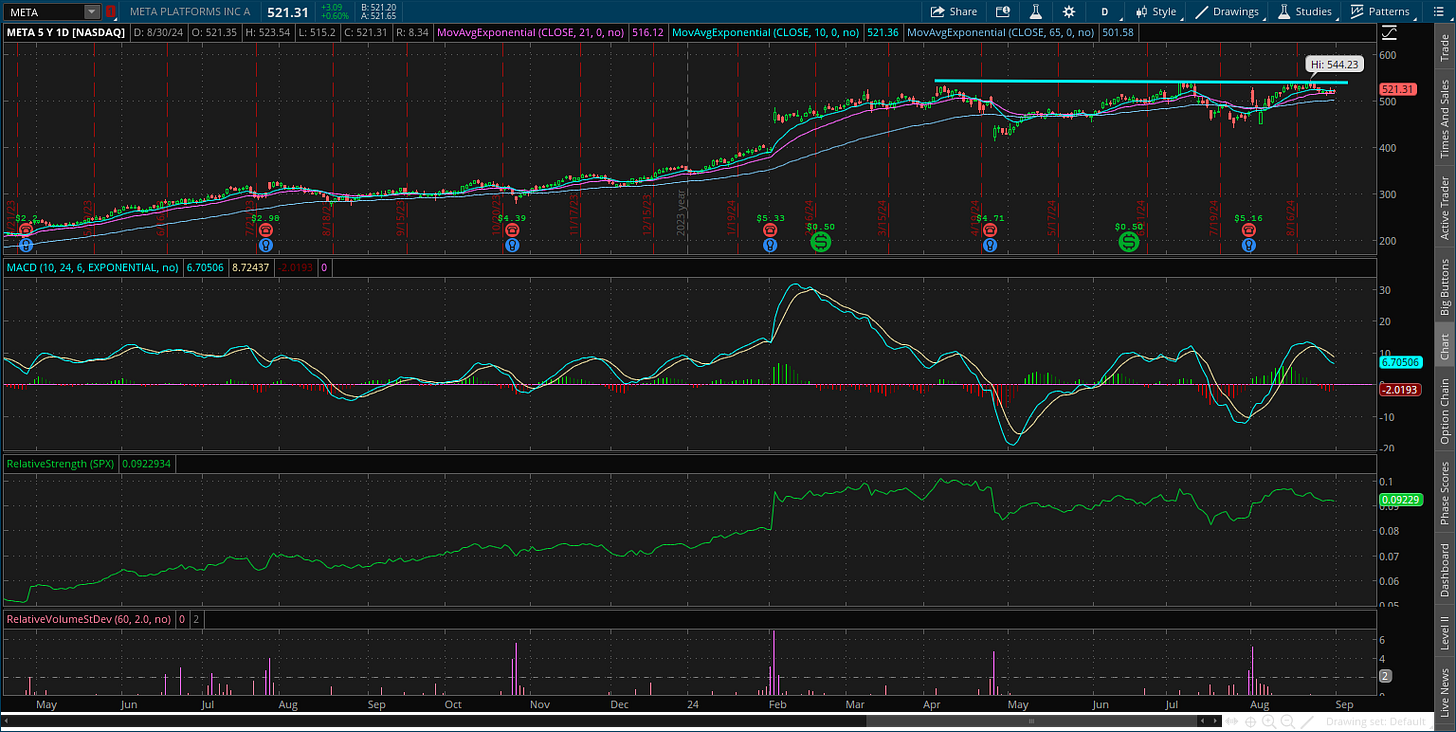
Peaked around $530 in April and tried to breakout over that level in July. The move was not confirmed by the relative strength line and price fell back into the base. Smaller pullbacks with the MACD now resetting. I’m now watching for a move over $545.
Ford (F)
If we get seasonal weakness in the stock market during September, I’ll be watching the $10 level on Ford (F) for a potential short trade. The chart below shows $10 being tested a couple times since last October. MACD is now resetting below the zero line. Take the chart back several years and you’ll see it’s a key support level to watch.
I hope you’ve enjoyed The Market Mosaic, and please share this report with your family, friends, coworkers…or anyone that would benefit from an objective look at the stock market.
And make sure you never miss an edition by subscribing here:
For updated charts, market analysis, and other trade ideas, give me a follow on X: @mosaicassetco
And if you have any questions or feedback, feel free to shoot me an email at mosaicassetco@gmail.com
Disclaimer: these are not recommendations and just my thoughts and opinions…do your own due diligence! I may hold a position in the securities mentioned in this report.


Great post!
I’m also looking for Meta to move above $545