The Market Mosaic 7.2.23
Ignore the headlines…follow price instead.
Welcome back to The Market Mosaic, where I gauge the stock market’s next move by looking at macro, technicals, and market internals. I’ll also highlight trade ideas using this analysis.
If you find this content helpful please hit that “like” button, share this post, and become a subscriber to this always free report if you haven’t already done so!
And be sure to check out Mosaic Chart Alerts. It’s a midweek update covering chart setups among long and short ideas in the stock market, along with levels I’m watching.
Now for this week’s issue…
When Friday’s trading session came to a conclusion, Apple became the first company to top $3 trillion in market value. And while Apple’s share price is now up 50% on the year, it might seem that the odds are stacked against the feat.
After all, this week featured more comments from Federal Reserve chair Jerome Powell that additional rate hikes are on the way…and that the inflation fight could last for years.
That stance was solidified with the Fed’s preferred inflation gauge out last week. The core personal consumption expenditure (PCE) index clocked in at 4.6% in May compared to last year. That’s more than two times the Fed’s target for price stability.
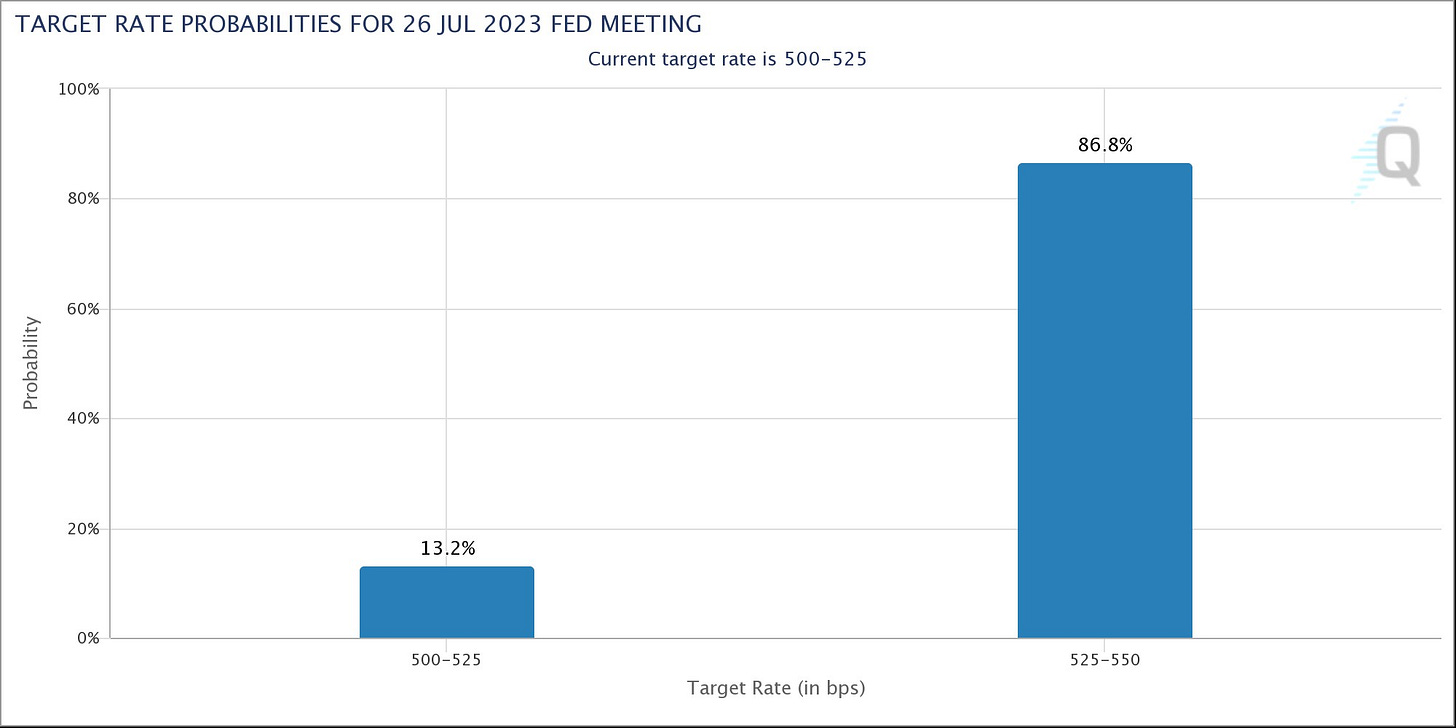
Following the data, odds for another 0.25% rate hike at the next Fed meeting stayed high at 87% as you can see below.
Not only are more rate hikes on the way, but signs are growing that the fastest tightening campaign in history is starting to take a toll. New data from the Fed suggests that the number of companies facing financial distress (i.e. on the verge of bankruptcy) rose to 37%...the highest level since 2008’s financial crisis.
Another report points to a growing number of bankruptcy filings, where figures are approaching 2020’s pandemic-driven economic collapse and 2008’s financial crisis.
If you want to paint a picture of doom and gloom, there’s no shortage of headlines to pull from. After all, the forces driving 2022’s bear market seem firmly in place.
But despite the fuss, stocks are grinding higher and companies like Apple are setting records for valuations. That’s hardly the stuff that bear markets are made of.
That’s why being weighed down by headlines and your opinion (or even worse…the opinion of others) can lead to missed trading opportunities.
You should pay attention to the message coming from the market instead. Here’s what it’s saying now.
Cyclical Sectors Breaking Out
While Apple and a few other select stocks like Nvidia were responsible for driving a large portion of 2023’s early gains, participation is spreading further.
You can see that showing up in 52-week net new highs across the stock market. On Friday, that figure jumped to the second highest level we’ve seen so far this year.
I wrote at the start of June that improving performance in cyclical sectors would be key to sustaining the stock market’s advance and signal better participation in the trend.
Cyclical sectors are sensitive to changes in the economy, with their stock prices acting as a barometer on future business conditions. That in turn sends an important message about the path of corporate earnings.
At first it was semiconductor stocks showing relative strength early in the year. Much was made about the chip link to artificial intelligence (AI), and that the hype was a one-off driver of performance.
But then homebuilders joined the party. By the time the first quarter ended, the ITB home construction ETF was already up 38% off the October lows…foreshadowing things to come.
The most recent housing data has been exceptional. Housing starts jumped by 22% in May (chart below), while new home sales increased by 20% in May compared to a year ago.
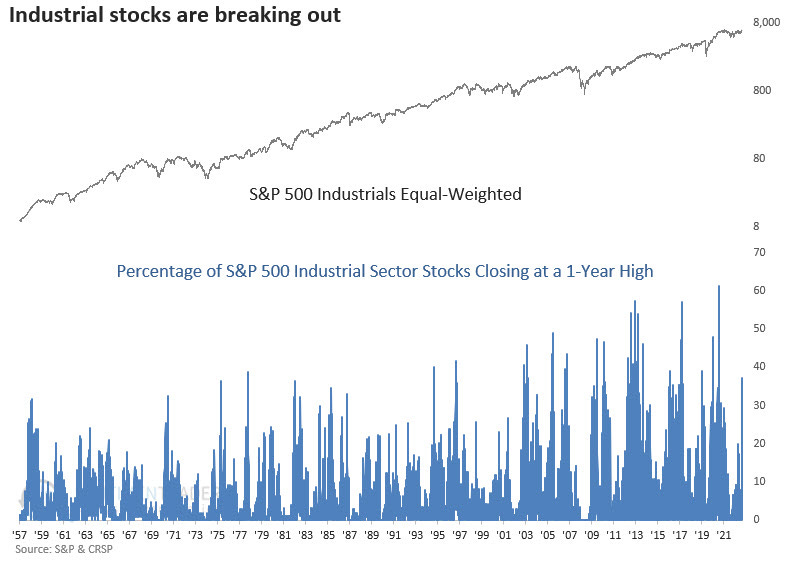
The housing construction ETF rose to new all time highs last week, and now industrial stocks are gaining as well. While the XLI industrial sector ETF has struggled with making a new high since 2021, it’s starting to breakout among broadening participation.
The chart below shows that 37% of industrial stocks in the S&P 500 are making a new 52-week high on Friday, which is more than any other sector in the S&P (h/t to Dean Christians).
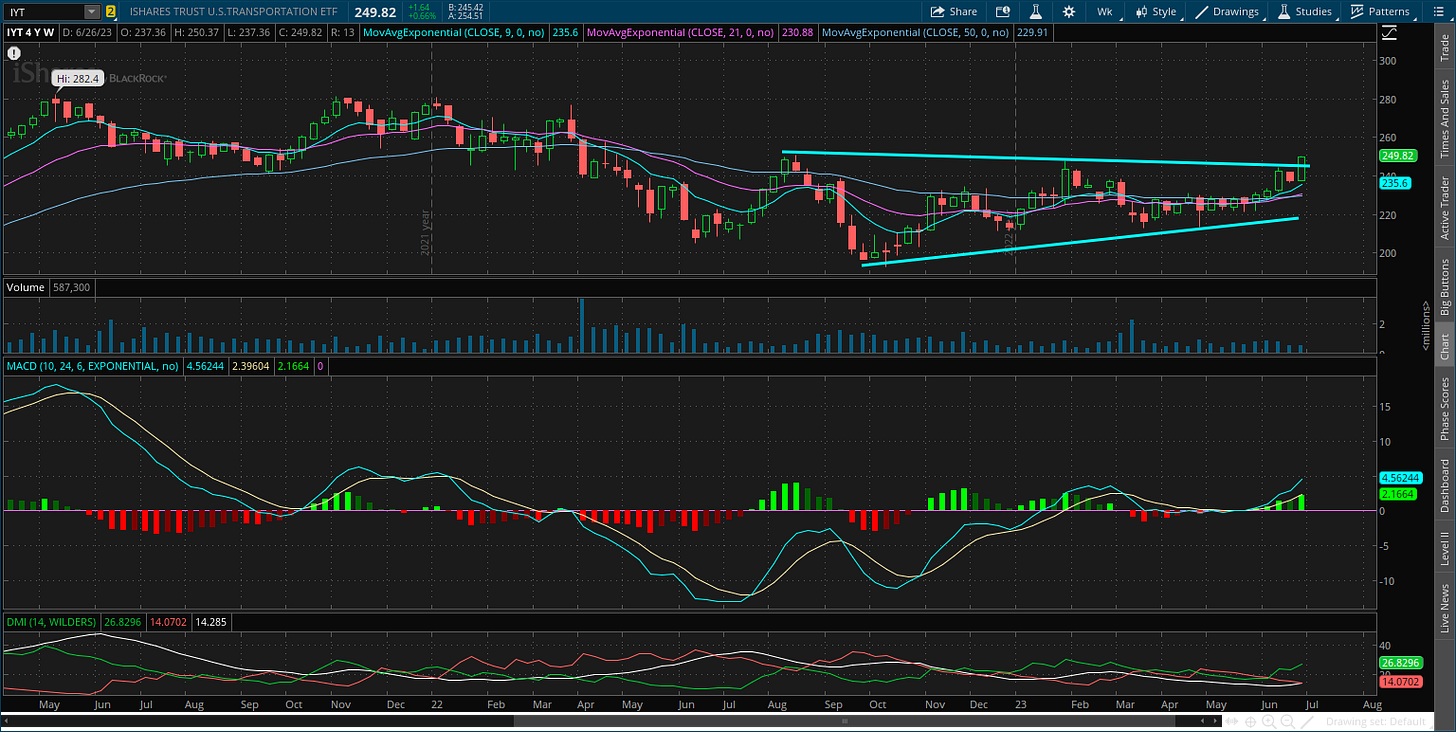
And now the next domino falling is with transportation stocks. As movers of freight and other goods, their link to economic activity is clear. While still a ways off new highs, the weekly chart of the IYT transportation ETF below shows transports moving above trendline resistance.
The message coming from cyclical sectors is becoming clear and unanimous. As more economically-sensitive groups breakout and move to new all time highs, that’s a great sign for the earnings outlook needed to sustain the gains as I wrote about here.
Now What…
We could still be in the early stages of a new bull run for the average stock. Along with the positive action in transports, the next segment I’m watching is with small-cap stocks.
The chart below shows the IWM small-cap ETF bouncing off trendline support at $180 that also resides close to the 50- and 200-day moving average. The next level to watch is $190 just overhead.
And for signs that animal spirits in the stock market truly catching fire, look no further than ETFs in the small-cap growth space and companies recently listing their stock. My preferred ETF’s in the space include:
IWO: Russell 2000 Growth ETF
ARKK: Ark Innovation ETF
IPO: Renaissance IPO ETF
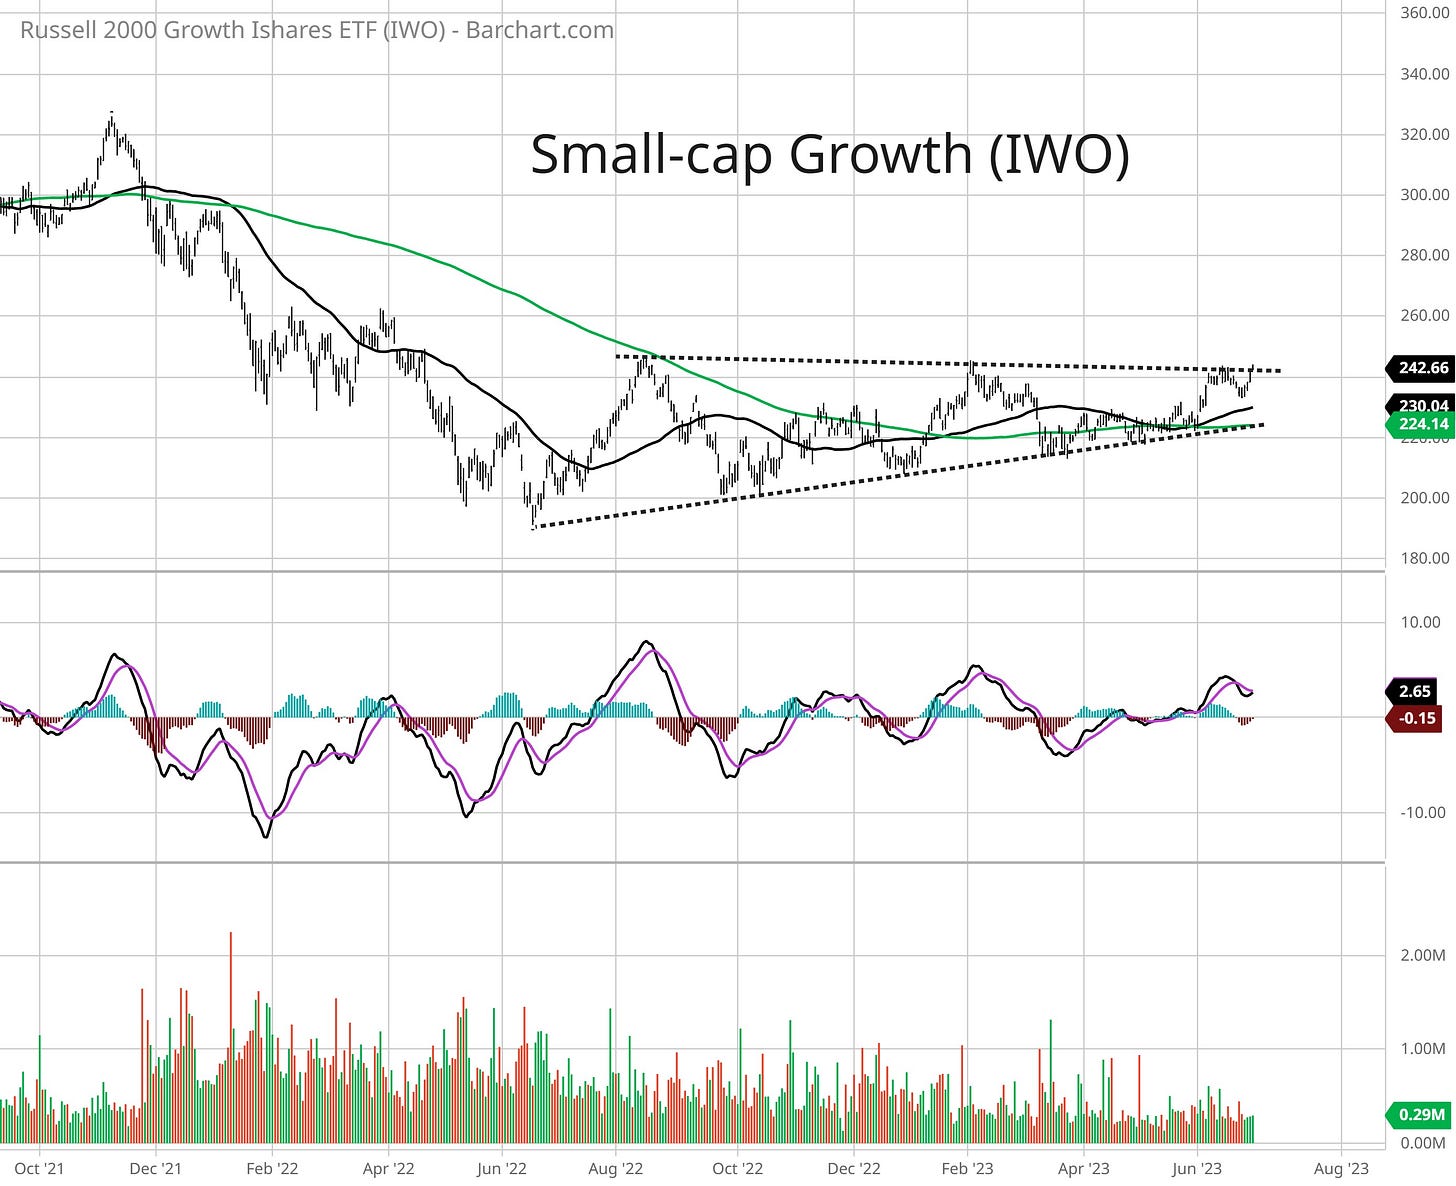
All three have a similar look in their chart pattern. Despite the moves you’re seeing in the S&P 500 Index, these ETFs have yet to emerge from their bottoming bases. The IWO small-cap growth ETF is a good example of this. IWO is close to taking out resistance around the $245 level, which could signal a breakout from the bottoming process.
If these start to go, then I’m watching IPO bases. My ideal setup is recent IPOs from 1-2 years ago, where the stock is trading just below the post-IPO high and ready to breakout.
IOT is a great example of this. The stock recently tested the post-IPO high around $30 and is pulling back off that level. I would now watch for a move to new highs.
I’m following a similar setup in NABL. After testing the post-IPO high around $15.50, the stock is pulling back and could be setting up a move to new highs.
That’s all for this week. Although we have a holiday-shortened week coming up, there will be plenty of important economic reports. That includes the ISM’s manufacturing and services PMI, and the June payrolls report. But amidst the headlines, don’t neglect the message coming from the market. Happy Fourth of July!
I hope you’ve enjoyed The Market Mosaic, and please share this report with your family, friends, coworkers…or anyone that would benefit from an objective look at the stock market.
And make sure you never miss an edition by subscribing here:
For updated charts, market analysis, and other trade ideas, give me a follow on Twitter: @mosaicassetco
And if you have any questions or feedback, feel free to shoot me an email at mosaicassetco@gmail.com
Disclaimer: these are not recommendations and just my thoughts and opinions…do your own due diligence! I may hold a position in the securities mentioned in this report.


