The Market Mosaic 7.16.23
Earnings will drive the next move in stocks.
Welcome back to The Market Mosaic, where today I gauge the stock market’s next move by looking at macro, technicals, and market internals. I’ll also highlight trade ideas using this analysis.
If you find this content helpful please hit that “like” button, share this post, and become a subscriber to this always free report if you haven’t already done so!
And be sure to check out Mosaic Chart Alerts. It’s a midweek update covering chart setups among long and short trade ideas in the stock market, along with levels I’m watching.
Now for this week’s issue…
I’m traveling and away from the office this weekend, so I don’t have my usual Sunday post. But I still want to provide a quick update on what I’m watching…just in a more condensed format.
So instead of my normal distillation of the past week’s events impacting the economy and stock market outlook, I have a quick summary and links to recent posts that remain impactful for what happens next in the market (plus a few more trade ideas at the end).
Big Picture
The S&P 500 is adding further gains ever since breaking out at the start of June. After crossing above the 4200 level, the S&P 500 continues demonstrating the hallmarks of an uptrend since October: higher lows and higher highs.
And in another positive sign, some of the more speculative corners of the stock market are joining the party.
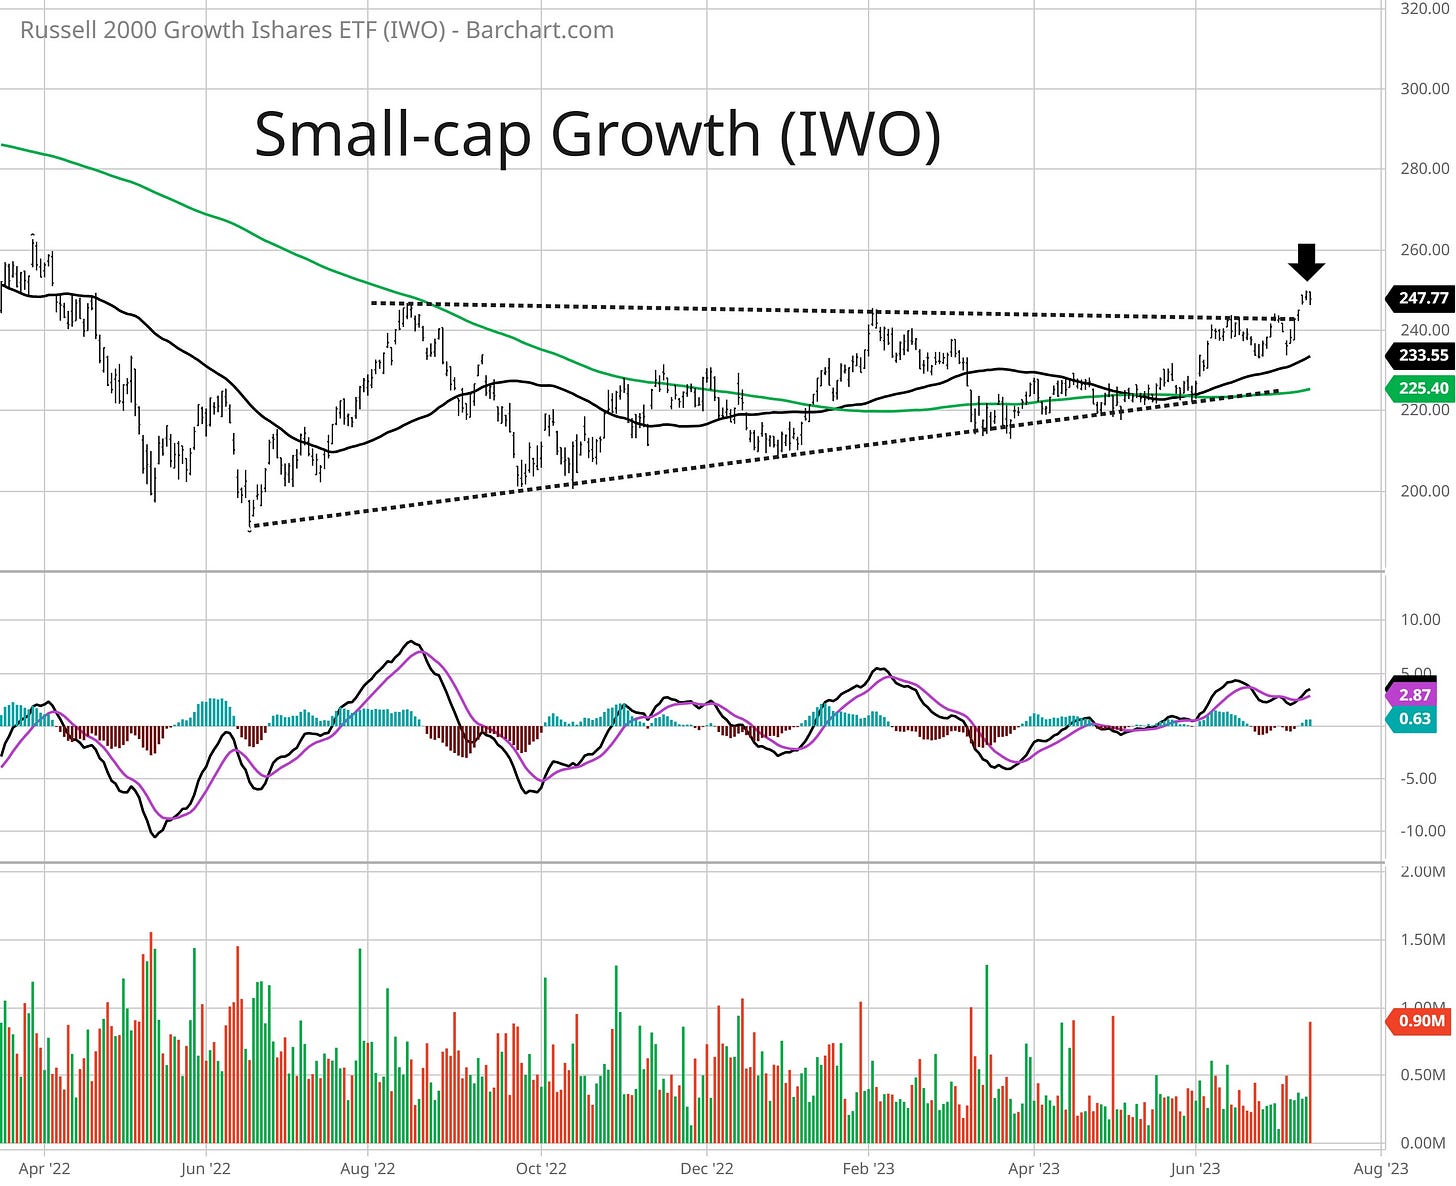
While key cyclical sectors have been showing positive action, we’re seeing breakouts from my “Big 3” for gauging risk sentiment. That includes small-cap growth ETFs, like the Russell 2000 small-cap growth ETF (IWO) that’s finally taking out a key resistance level going back a year as you can see below.
There’s other evidence of broadening participation, like with the number of stocks making net new 52-week highs across the stock market. There’s been a persistence of net new highs, and we need this figure to stay in positive territory to signal a healthy bull market phase.
And in order for the bulls to stay in charge, earnings need to come through. We’ve just started the 2Q reporting season with several banks delivering good results.
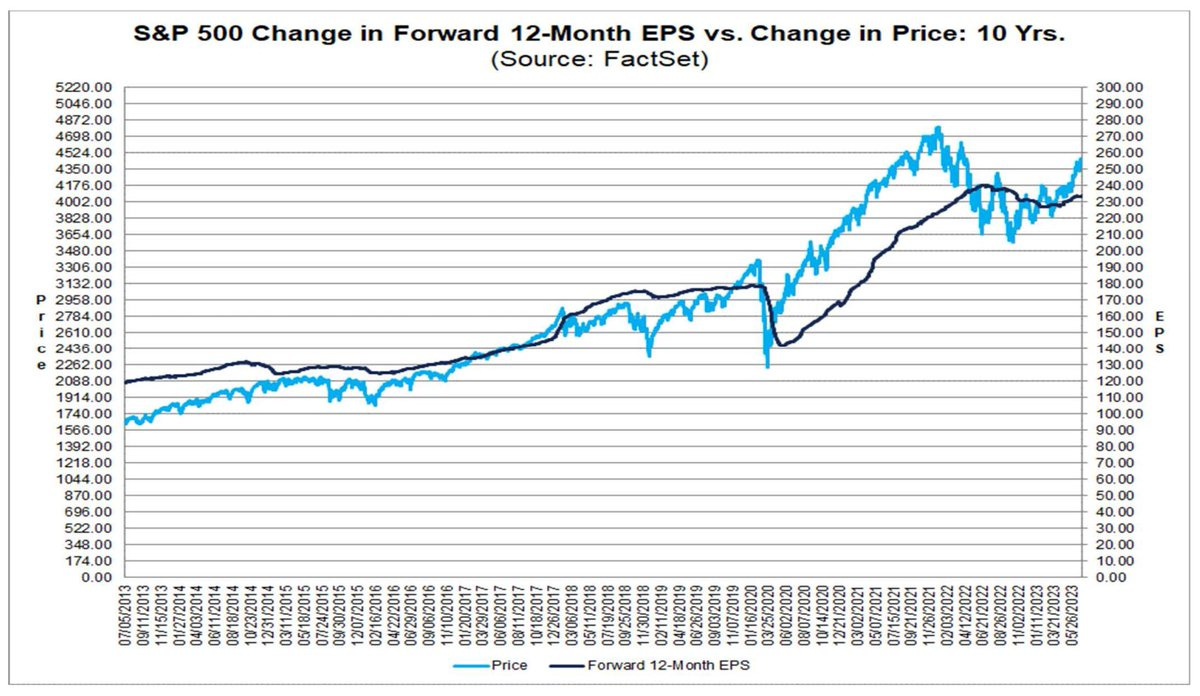
But broadly speaking, estimates on a cumulative basis needs to keep working higher. Analysts will follow guidance given by corporate management teams, and that will be reflected in forward analyst estimates (translating to a better economic outlook). Those estimates started turning higher last quarter as you can see below.
Finally, I want to touch on calendar seasonality for the S&P 500. For the past 20 years, July has seen a positive trend in stock returns throughout the month which we’ve experienced so far. The summer swoon then hits in August with volatility through October.
Mosaic Tidbits
Here are a few recent posts that are still impactful and relevant to the stock market’s next move:
I recently outlined three conditions in place that could support demand for stocks and drive prices higher. Margin debt, positioning in stock index futures, and low volatility levels can keep the rally going.
Both consumer and producer inflation reports came in less than expected last week. But the bond market has been signaling disinflation and the end of the rate hiking cycle for quite some time.
If the economy were in trouble, then cyclical stock market sectors would be flashing warning signs. That’s hardly been the case with these economic barometers heading higher.
Plus trade ideas I’m watching from the most recent Mosaic Chart Alerts post.
Chart Updates
As I wrap up my weekly scans, here are a few extra trade ideas that I’m monitoring.
AEHR
I’m going to be upfront about this one. Based on how I trade, there’s a lot of risk involved here. On a gap breakout, I usually set my stop at the bottom of the gap which is almost 17% below Friday’s close. But the setup checks just about everything else I look for. Volume surged, the MACD is turning up from the zero line, and the relative strength (RS) line made a new high. Position size accordingly if you trade it.
MNSO
Chinese retailer attempting to breakout then pulling back on Friday. Want to see follow through above resistance at around $19, preferably on higher volume and the RS line pushing toward a new 52-week high.
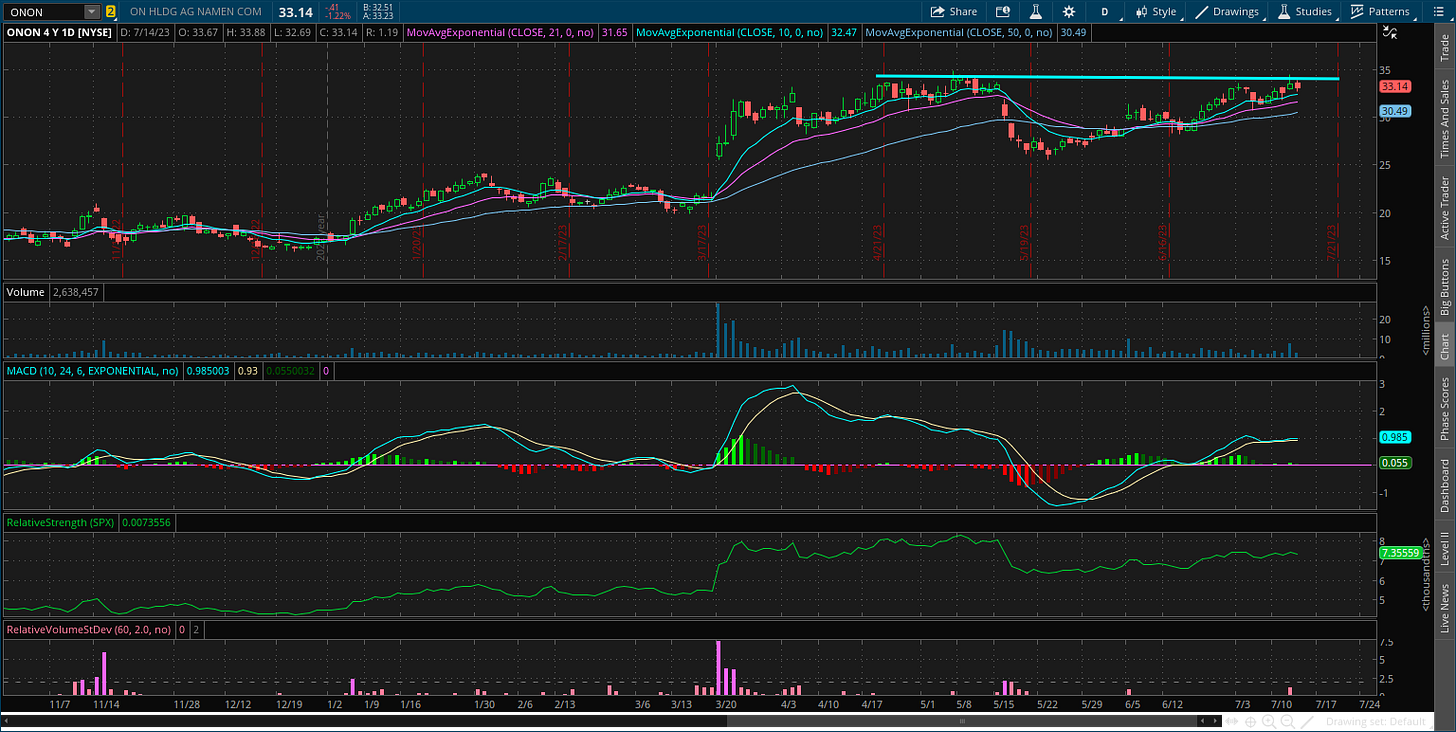
ONON
This stock is an IPO from 2021 and has seen a recent string of solid quarterly sales and earnings growth. If the stock can breakout above the $34/35 level, then price could target the post-IPO highs.
That’s all for now! Over the coming weeks, we’ll see the pace of earnings reports increase and I’ll be fixated on aggregate forward estimates. Earnings drive the stock market over the long run, so the earnings recovery will need to stay intact to keep the rally going.
I hope you’ve enjoyed The Market Mosaic, and please share this report with your family and friends…or anyone that would benefit from an objective look at the stock market.
And make sure you never miss an edition by subscribing here:
For updated charts, market analysis, and other trade ideas, give me a follow on Twitter: @mosaicassetco
And if you have any questions or feedback, feel free to shoot me an email at mosaicassetco@gmail.com
Disclaimer: these are not recommendations and just my thoughts and opinions…do your own due diligence! I may hold a position in the securities mentioned in this report.


