Welcome back to The Market Mosaic, where I gauge the stock market’s next move by looking at macro, technicals, and market internals. I’ll also highlight trade ideas using this analysis.
If you find this content helpful please hit that “like” button, share this post, and become a subscriber to this always free report if you haven’t already done so!
And be sure to check out Mosaic Chart Alerts. It’s a midweek update covering my best chart setups among long and short ideas in the stock market, along with levels that could trigger a trade.
Now for this week’s issue…
As promised in last week’s post, headlines around the debt ceiling continued to whipsaw the stock market. As the U.S. Treasury gets closer to running out of cash (chart below) and potentially defaulting on debt obligations, negotiations seemed to go nowhere for most of the week.
That brought warnings from several of the credit rating agencies. Fitch put their AAA rating for the U.S. on negative watch, while Moody’s also said it could do the same depending on how talks progressed to raise the debt ceiling.
We’ve seen this play out plenty of times before, and not just with the debt ceiling. Talks between interested political parties go down to the wire in order to extract concessions. But in this case, the stakes impact nearly all corners of capital markets given the $24 trillion market for treasuries.
That’s led to some volatile action in the S&P 500. Just when it looked like the S&P was breaking out of a range (shown at the arrow) that’s contained the index going back to February, price reversed course and fell back toward the 50-day moving average (black line).
But now price is attacking the same level once again. Just like how the S&P is struggling to find direction, the same can be said for other areas of the stock market as well. That’s leading to a market full of conflicting bullish and bearish signals.
Here are several signs of the market’s growing personality disorder.
The Stock Market’s Different Faces
Just like the Jekyll and Hyde nature of the S&P 500 last week, we’ve seen different faces of the stock market showing up in other ways as well.
This is probably best captured by looking at the performance of the average stock compared to the market-cap weighted indexes, which is really just another way of measuring breadth.
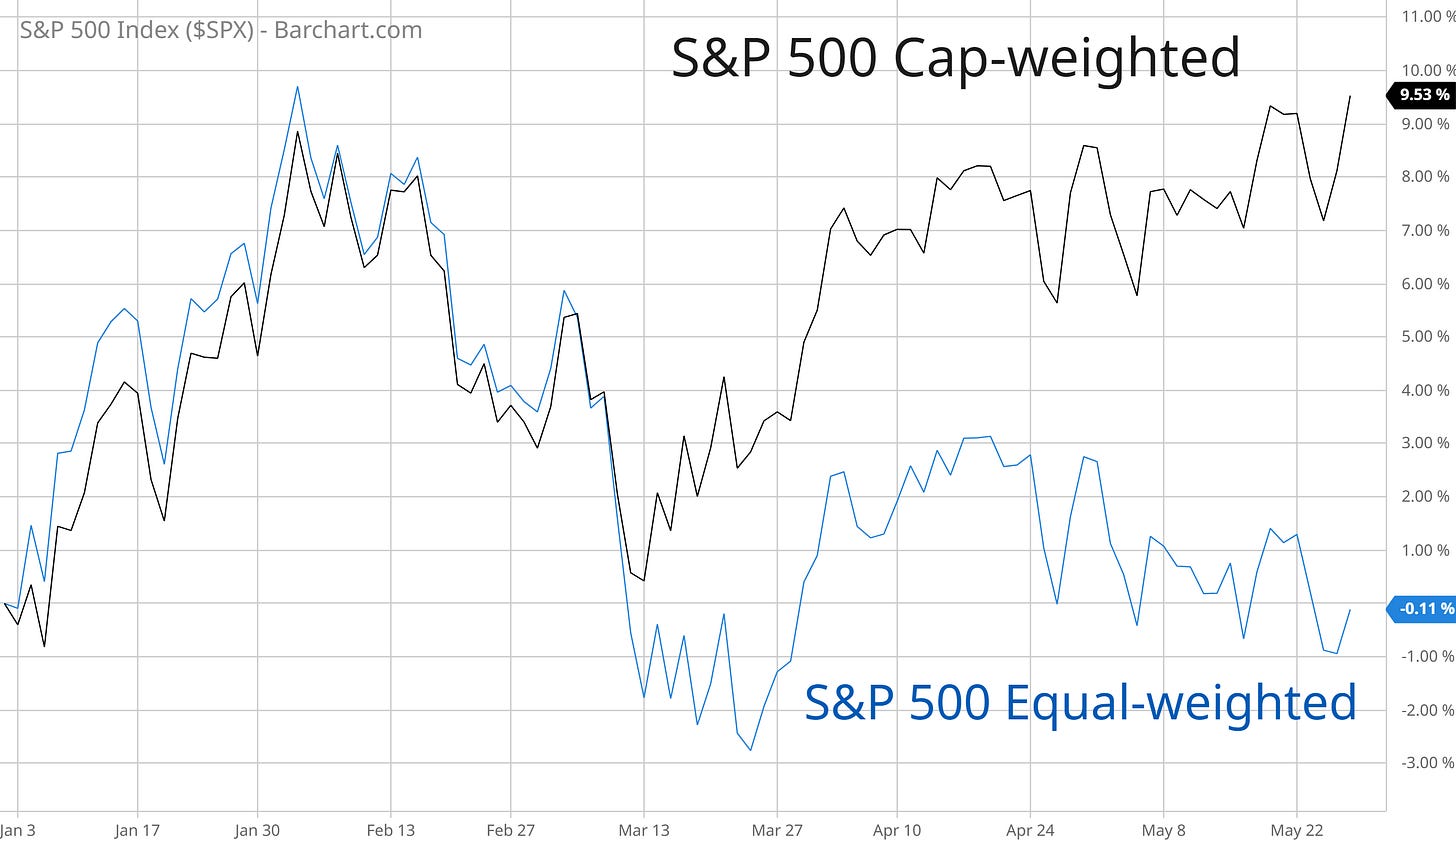
Much was made of Nvidia’s one-day 24% surge that took the company toward the trillion dollar market-cap club. And it’s these big technology companies leading the way for the S&P 500, which is now up nearly 10% year-to-date.
But compare that to the performance of the S&P 500 if you were to simply hold each stock in equal proportions. The chart below shows the S&P relative to the equal-weighted version of the index, which is still flat on the year. The year-to-date difference in performance is the largest spread since 1998…just ahead of the last great tech bubble.
This diverging performance is being echoed across sectors as well. Nvidia isn’t the only semiconductor stock that’s rallying. The entire chip space is seeing a recent surge of historic magnitude.
And given the cyclical (i.e. economically-sensitive) nature of chip stocks, that’s normally a great sign for the economic outlook. But other cyclical sectors are not confirming the move. Transports are lagging and trading below important resistance levels, while small-value is down on the year and trading near its bear market lows.
Even sentiment indicators are sending conflicting signals on whether investors are feeling more bullish or bearish. I showed you last week that individual investors surveyed by the AAII was skewed to the bearish side, especially with the bulls nearly disappearing.
The most recent update shows that there are still fewer bulls and more bears relative to the historical averages. From a contrarian standpoint, more bears are a good thing. But compare that to CNN’s Fear & Greed Index, which is back into greed territory as you can see in the chart below.
This is just a sample of the conflicting signals unfolding across the stock market. I utilize breadth and sentiment metrics to assess the near-term potential of the stock market, and the divergences among indicators is quite staggering.
Now What…
Yesterday brought news that White House and Republican negotiators reached an agreement in principal to raise the debt ceiling. That agreement still needs to make its way through Congress, so nothing is certain on the debt ceiling just yet.
Whether it’s the debt ceiling or something else…there will always be headlines. That’s why I stay objective by analyzing the activity under the market’s hood versus making emotional decisions based on the news.
We do remain in the strong seasonal period over the next couple of weeks as I covered here, and it looks like the S&P 500 is taking another crack at breaking out. This time I want to see the S&P hold over the 4200 level shown in the four hour chart below.
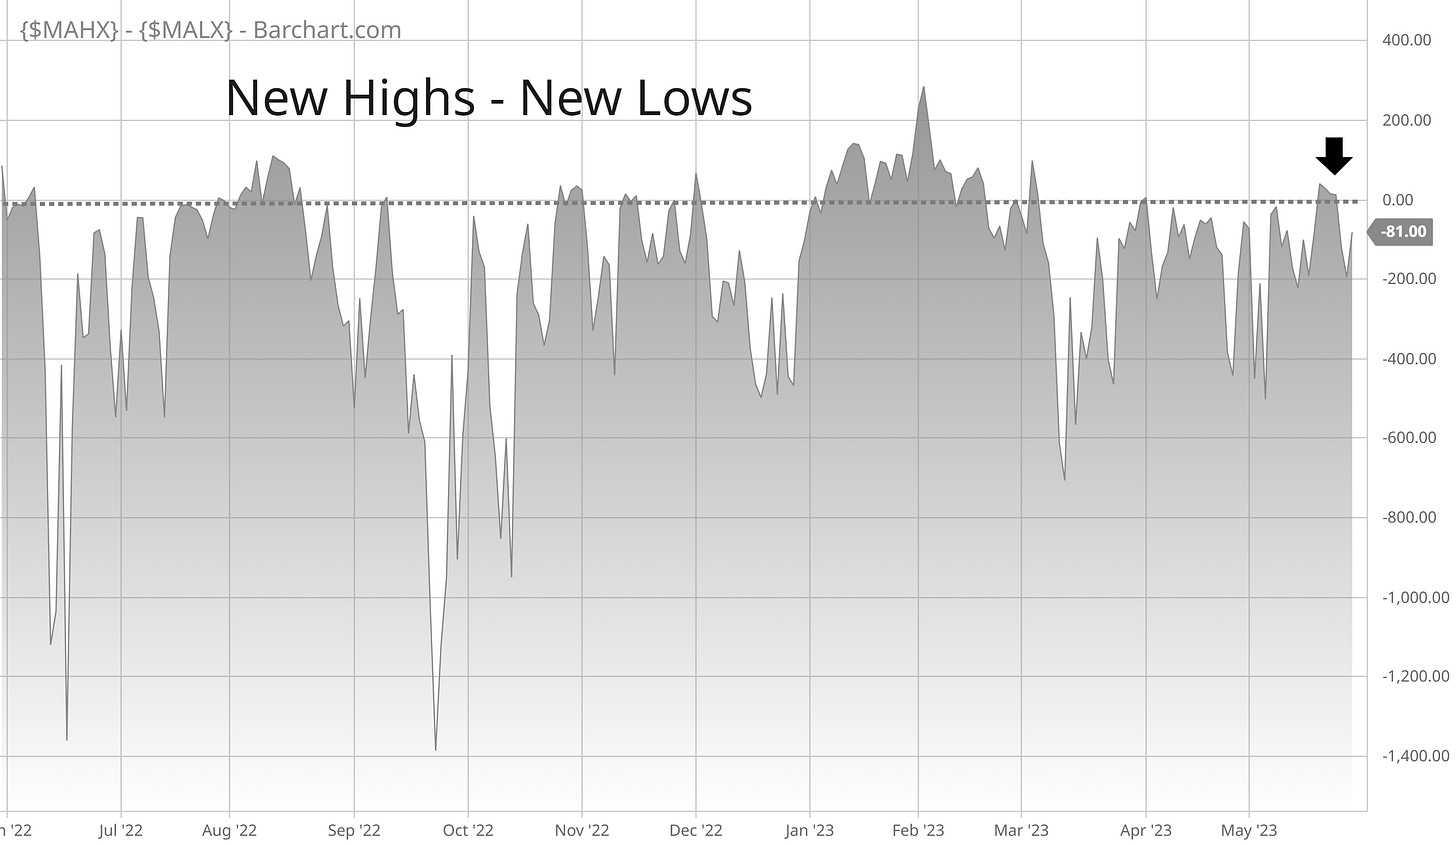
The last try at breaking out was accompanied by net new highs crossing into positive territory, but they didn’t stay positive for very long. If the S&P holds its ground here, it’s important to see net new highs recover as well and get back above the dashed line in the chart below. That shows more stocks are making 52-week highs than 52-week lows.
As discussed frequently this year, I’m still taking breakouts that meet my criteria discussed in Mosaic Chart Alerts. I just position size more conservatively when the market backdrop is less certain, which remains my take based on the conditions reviewed in this post.
There are a few setups on the long side that I’m monitoring into next week. That includes FTNT on the cybersecurity side that I posted about below:
I’m also monitoring the setup in SWAV. The stock is basing just under the all-time highs around the $310 level. Both FTNT and SWAV have put together an impressive string of quarterly sales and earnings growth.
That’s all for this week. The coming week will still bring uncertainty around the debt ceiling as the agreement makes its way through Congress. We’ll also get an updated report from the ISM on manufacturing sector activity, plus the May jobs report. Regardless of those headlines, I’m watching the action in the average stock and cyclical sectors most closely.
I hope you’ve enjoyed The Market Mosaic, and please share this report with your family and friends…or anyone that would benefit from an objective look at the stock market.
And make sure you never miss an edition by subscribing here:
For updated charts, market analysis, and other trade ideas, give me a follow on Twitter: @mosaicassetco
And if you have any questions or feedback, feel free to shoot me an email at mosaicassetco@gmail.com
Disclaimer: these are not recommendations and just my thoughts and opinions…do your own due diligence! I may hold a position in the securities mentioned in this report.


