
The Market Mosaic 4.2.23
S&P 500: bull market or bull trap?

Welcome back to The Market Mosaic, where I gauge the stock market’s next move by looking at macro, technicals, and market internals. I’ll also highlight trade ideas using this analysis.
If you find this content helpful please hit that “like” button, share this post, and become a subscriber to this always free newsletter if you haven’t already done so!
And be sure to check out Mosaic Chart Alerts. It’s a midweek update covering my best chart setups among long and short ideas in the stock market, along with levels that could trigger a trade.
Now for this week’s issue…
With the first quarter of 2023 officially in the books, you might be scratching your head and wondering why stocks are doing so well. After all, the S&P 500 gained 7% over the three-month period while the Nasdaq 100’s 20% jump is the best quarter in three years.
But we’re still sorting through the fallout of the worst bank crisis since 2008’s financial meltdown. March witnessed two of the three largest bank failures in U.S. history, while Credit Suisse was barely salvaged with an acquisition by UBS.
There’s still looming questions over the health of banks and if the deposit flight will topple more financial institutions. But amidst the uncertainty, a few positives have emerged that’s allowing investors to breathe a collective sigh of relief.
First, measures of financial conditions are quickly moderating, indicating that perhaps the worst of the bank fiasco is in the rearview. That includes the St. Louis Fed’s measure of financial market stress that I discussed below:

There are also growing signs that the Federal Reserve’s rate hiking campaign will be coming to a conclusion. First, 2-year Treasury yields are sustaining their move lower, which tends to lead the way for the fed funds rate as you can see below.

But last week also featured the release of the Fed’s preferred inflation gauge with the personal consumption expenditures (PCE) price index. The year-over-year core rate of inflation is slowly coming down, following a trend of deceleration with other inflation measures as you can see below.

At 4.6% year-over-year, the core PCE measure is now below the fed funds rate, which is at 4.8%. That’s another sign this tightening cycle could be coming to an end. At the same time, the Fed is pumping liquidity into the financial system to help alleviate pressures facing banks.
So a combination of more liquidity, less stress in the financial market, and signs of a Fed pause are releasing bullish animal spirits.
The key question now is whether this is the start of a more durable bullish trend, or just a bear market bounce.
Room to Run?
Despite the gloom and doom facing stocks in recent weeks, the rally didn’t catch us by surprise. I’ve noted for the past several weeks that a combination of oversold breadth and extremely bearish sentiment was supportive of a rally.
And based on more intermediate-term measures of breadth and trend, I believe the S&P 500’s rally that started in mid-March has more room to run. First, take a look at the percent of stocks trading above their 50-day moving average.
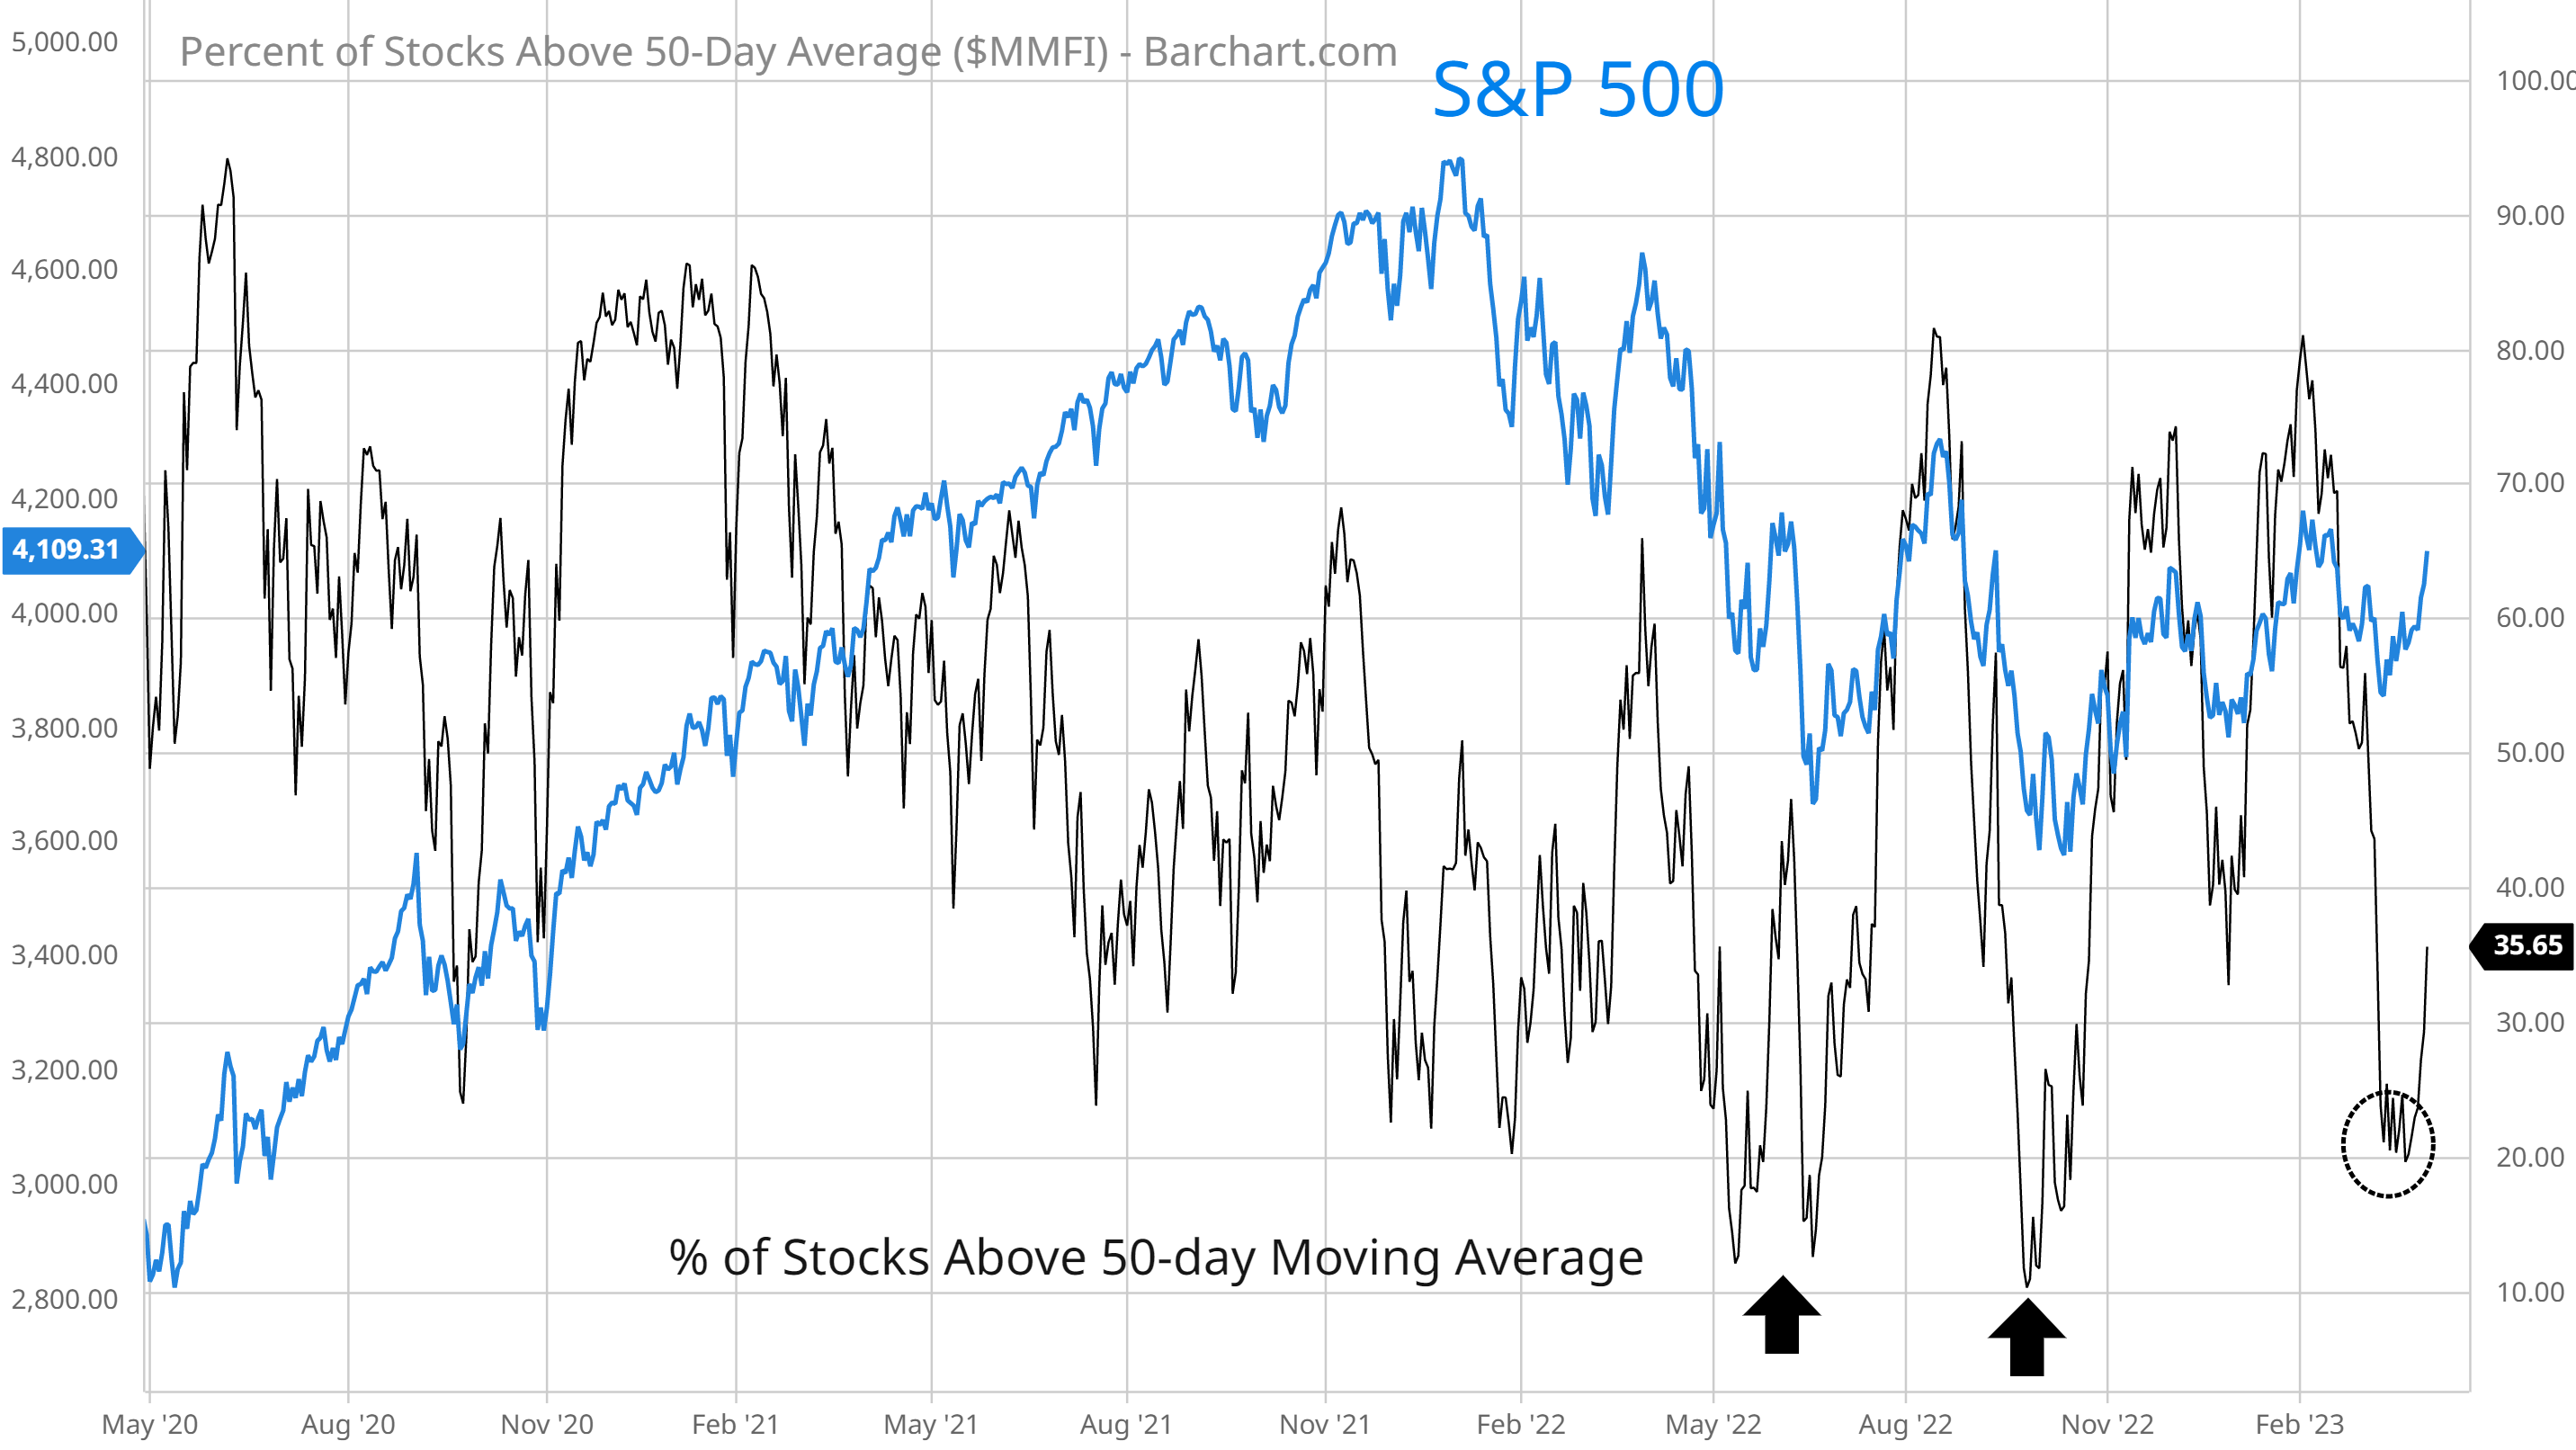
The last two times the stock market became this oversold by falling to the 20% threshold on this metric, the S&P 500 went on to rally 17% and 14%.
Next consider the McClellan Summation breadth oscillator. This measures nets the difference between advancing and declining stocks on the NYSE over a trailing period. After falling since early February, this gauge is now crossing above its 10-day moving average (MA), creating a fresh buy signal as you can see below.

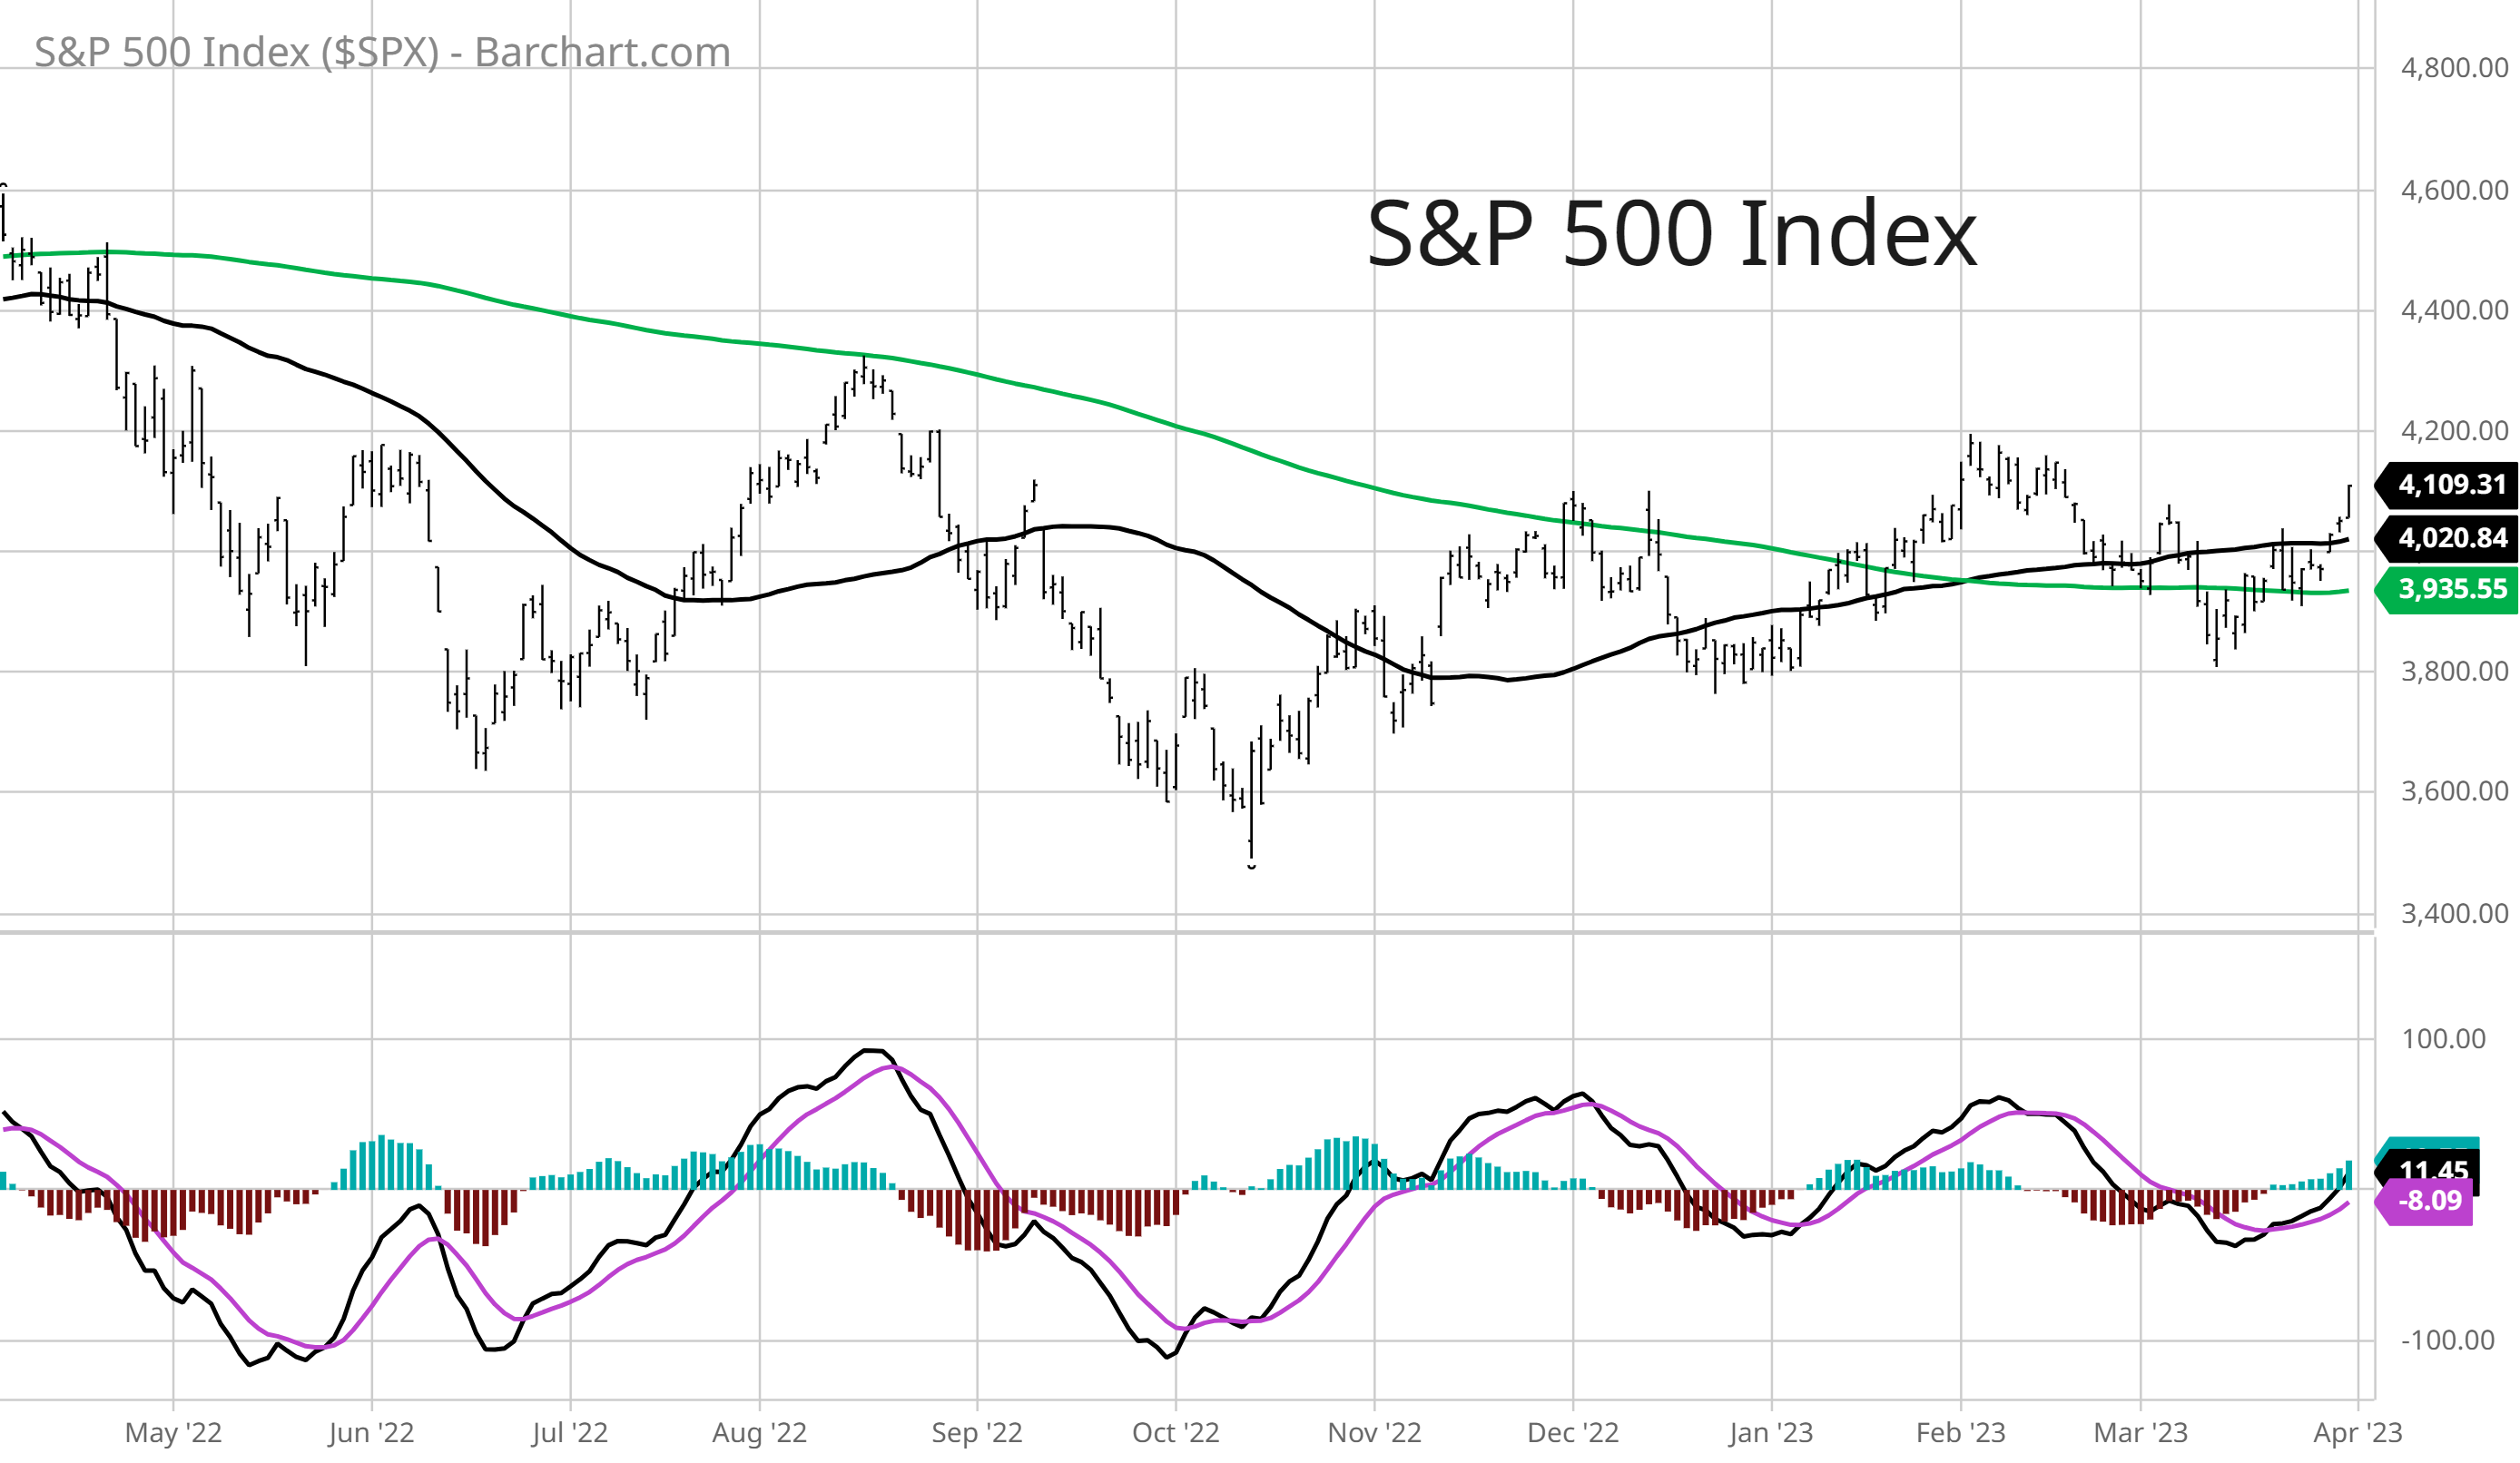
The fact that these more intermediate-term metrics became so oversold without the S&P 500 violating its uptrend off the October lows (marked by a series of higher highs and higher lows) is an encouraging sign. And after a brief dip below the 200-day MA (green line), the move higher is retaking both the 200- and 50-day (black line) MAs as you can see below.
The prevalence of oversold conditions was enough to send stocks higher. But now the focus is on the durability of this advance, or if we’re facing a bear market rally destined to fail.
Now What…
While the stock market can keep working its way higher on an oversold bounce combined with positive seasonals, the next thing I want to see is broadening participation.
As highlighted above, breadth metrics hit washed out levels that indicated serious selling across the board. The fact the S&P 500 didn’t fare worse can be attributed to a few mega-cap growth names propping up the index.
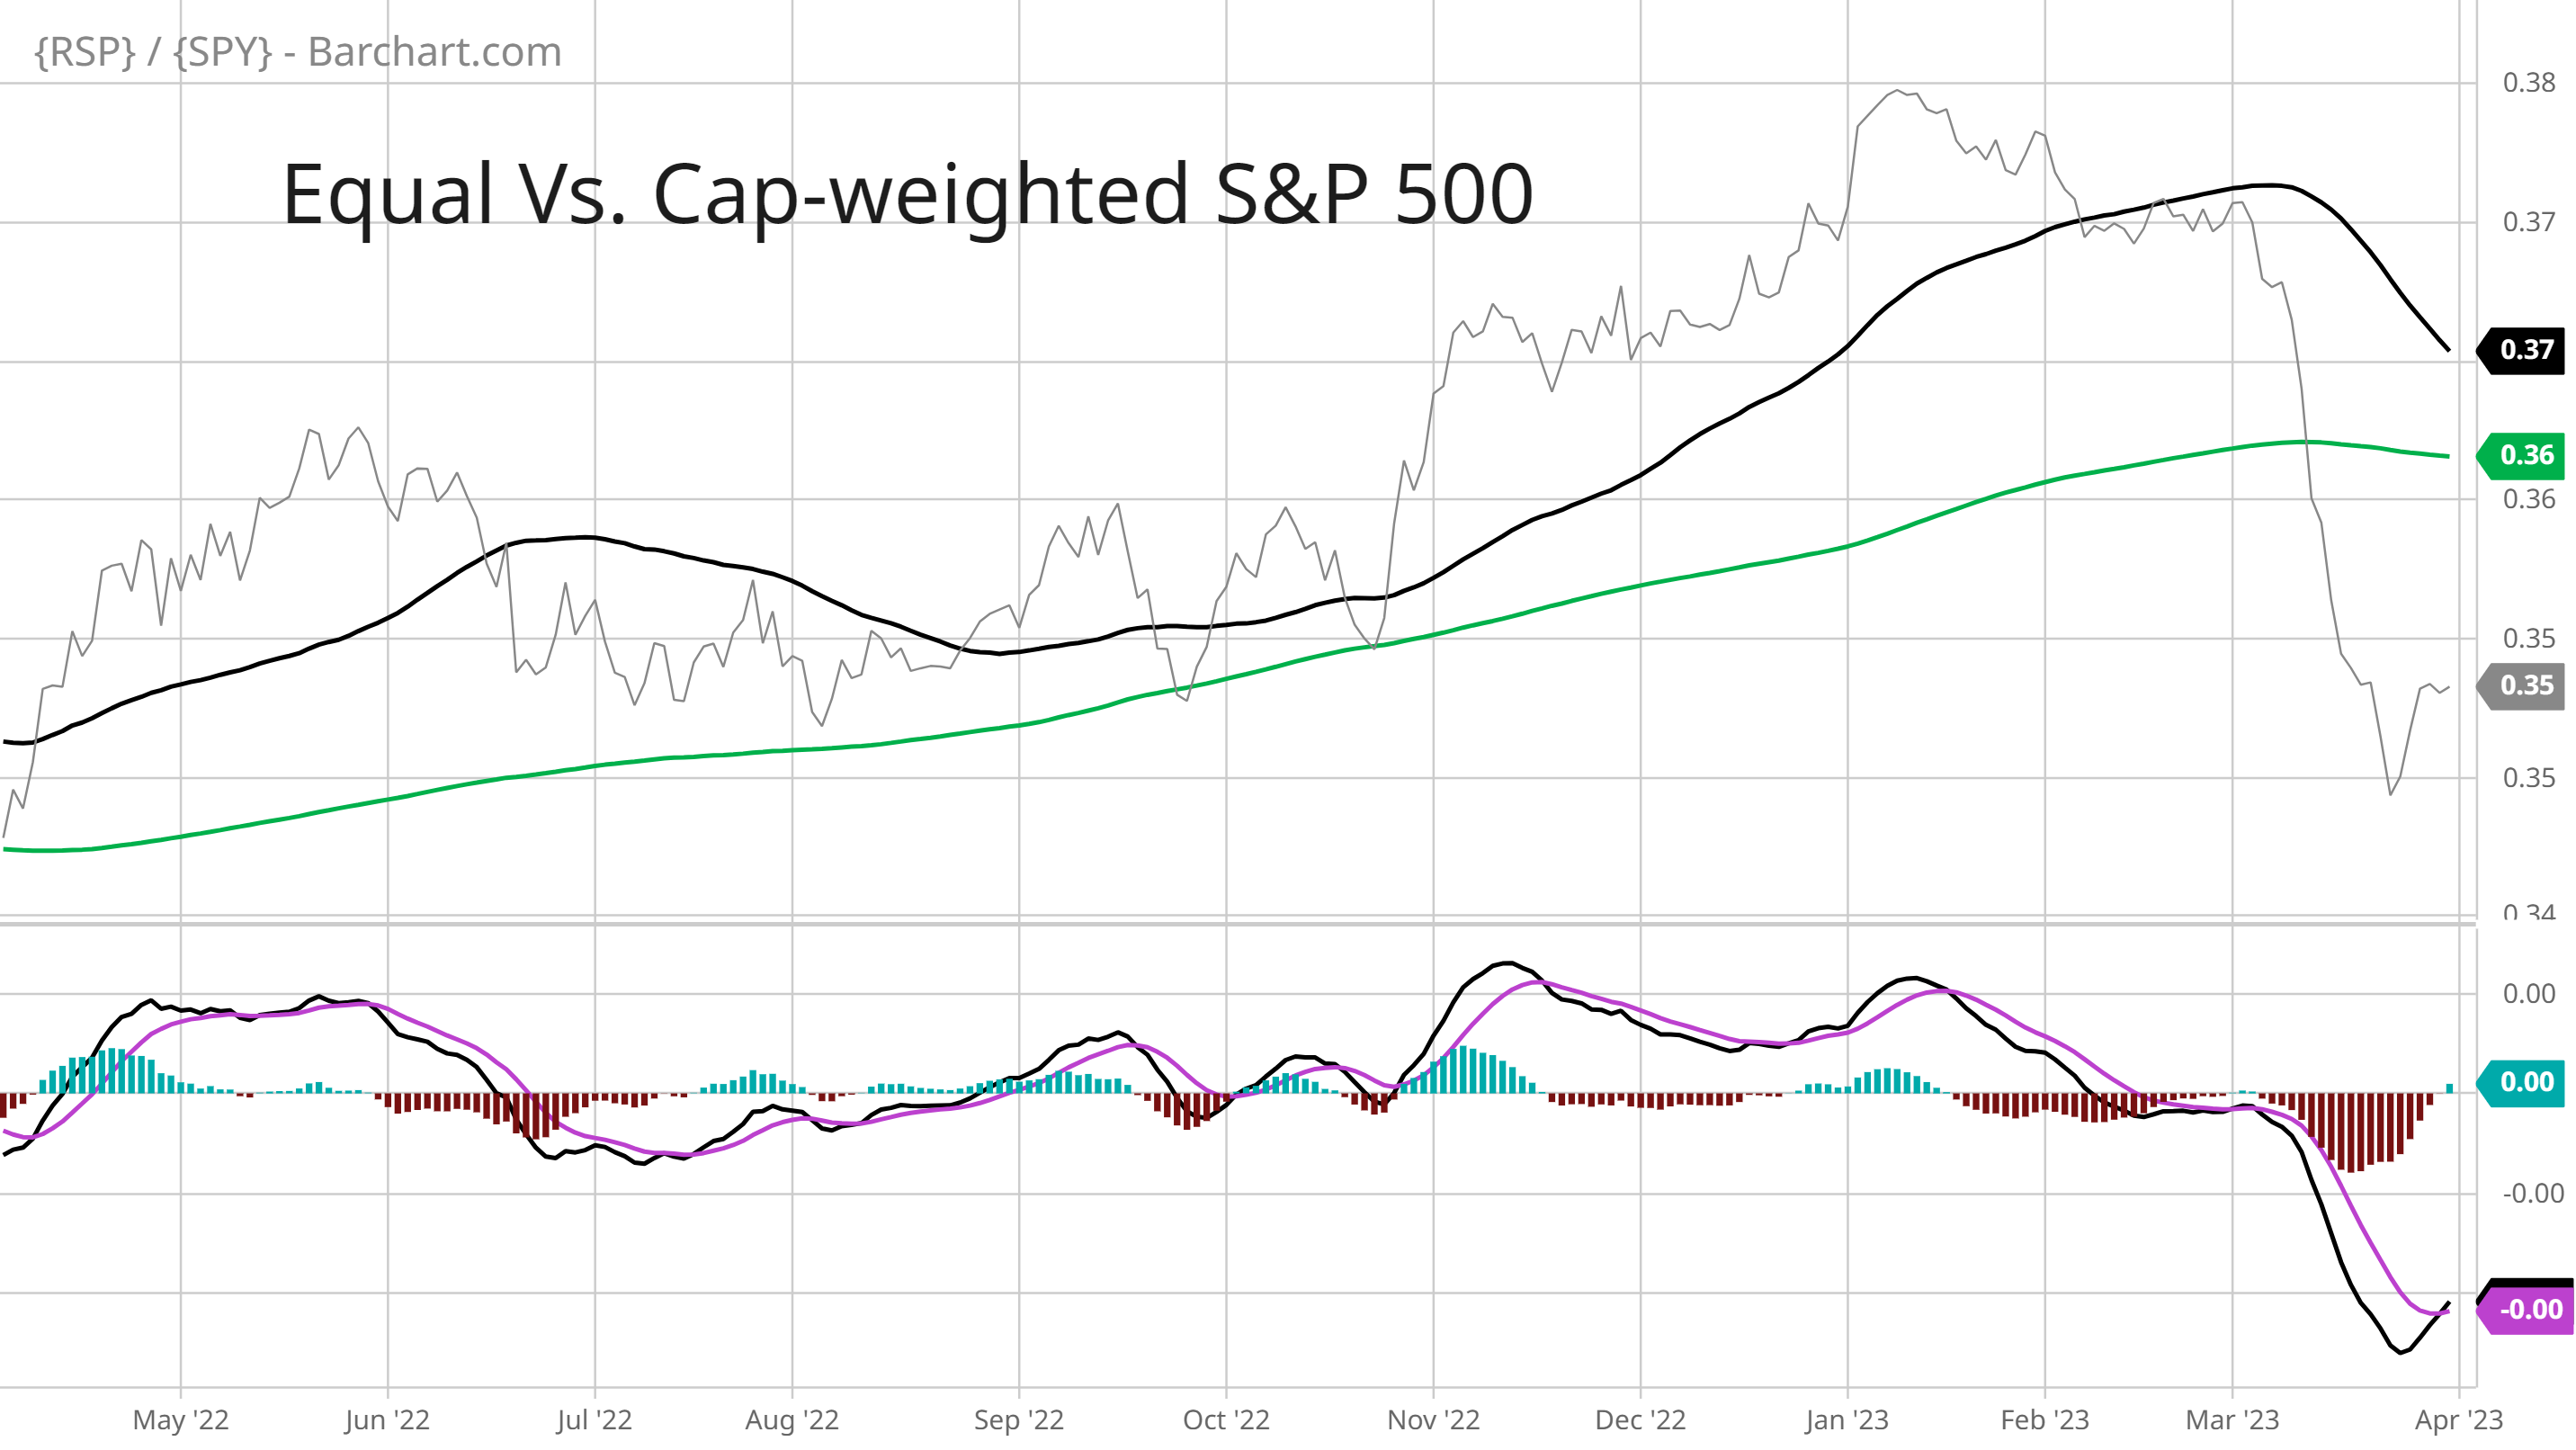
That is quite evident in the chart below, which is a price ratio of the S&P 500 equal-weighted ETF (RSP) versus the market-cap weighted ETF (SPY). A falling line indicates that the equal-weight ETF is underperforming the cap-weighted ETF and vice versa. The plunging line since the start of the year lays bare the struggles of the average stock.
In addition to seeing the average stock perform better, I will also be looking for confirmation from other cyclical sectors. Semiconductors have been on an absolute tear, which is a great sign. But I want to see that confirmed in areas like transportation stocks and small-caps that are lagging the S&P 500 this year.
Broadening participation and a pickup in cyclical sectors outside of semiconductors will be a key clue if the stock market can sustain a more lasting uptrend. One encouraging sign is the number of setups starting to breakout across a variety of economically-sensitive industries. That includes homebuilder SKY, which I’ve highlighted in Mosaic Chart Alerts and is holding its breakout over the $73 level.
After struggling lately, stocks in the oil and gas industry are starting to perk back up as well. That includes REPX, where I posted about the setup below:

There’s also a setup developing in SPSC, which is starting to move above trendline resistance over $150 level (chart below). A breakout would be notable given the company operates a global supply chain management platform.

That’s all for this week. A combination of breadth, sentiment, and easing concerns around the bank crisis are supporting a rally in the stock market. But for that rally to have legs, we now need to see participation broaden and more cyclical sectors step up. With the March jobs report and several other key economic releases on the calendar this week, be ready for more headline-inducing volatility. Just don’t forget to look under the hood to assess the strength of the stock market’s trend.
I hope you’ve enjoyed this edition of The Market Mosaic, and please share this newsletter with your family and friends…or anyone that would benefit from an objective look at the stock market.
And make sure you never miss an edition by subscribing here:
For updated charts, market analysis, and other trade ideas, give me a follow on Twitter: @mosaicassetco
And if you have any questions or feedback, feel free to shoot me an email at mosaicassetco@gmail.com
Disclaimer: these are not recommendations and just my thoughts and opinions…do your own due diligence! I may hold a position in the securities mentioned in this newsletter.