The Market Mosaic 4.10.22
Staying cautious...
Welcome to The Market Mosaic, where we gauge the stock market’s next move by looking at trends, market internals, and the mood of the crowd. We also look for information contained in sectors and other areas of the capital markets. Finally, I’ll highlight one or two trade ideas I’m tracking using this information.
Disclaimer: these are not recommendations and are just my thoughts and opinions…do your own due diligence! I may hold a position in the securities mentioned in this newsletter.
Lets start with the S&P 500. The index is pulling back so far in April, which is to be expected off the strong run from the March lows. That left the MACD extended and needing to reset. Right now, the index between the 50- and 200-day moving average…so far nothing that’s too concerning with this move lower.
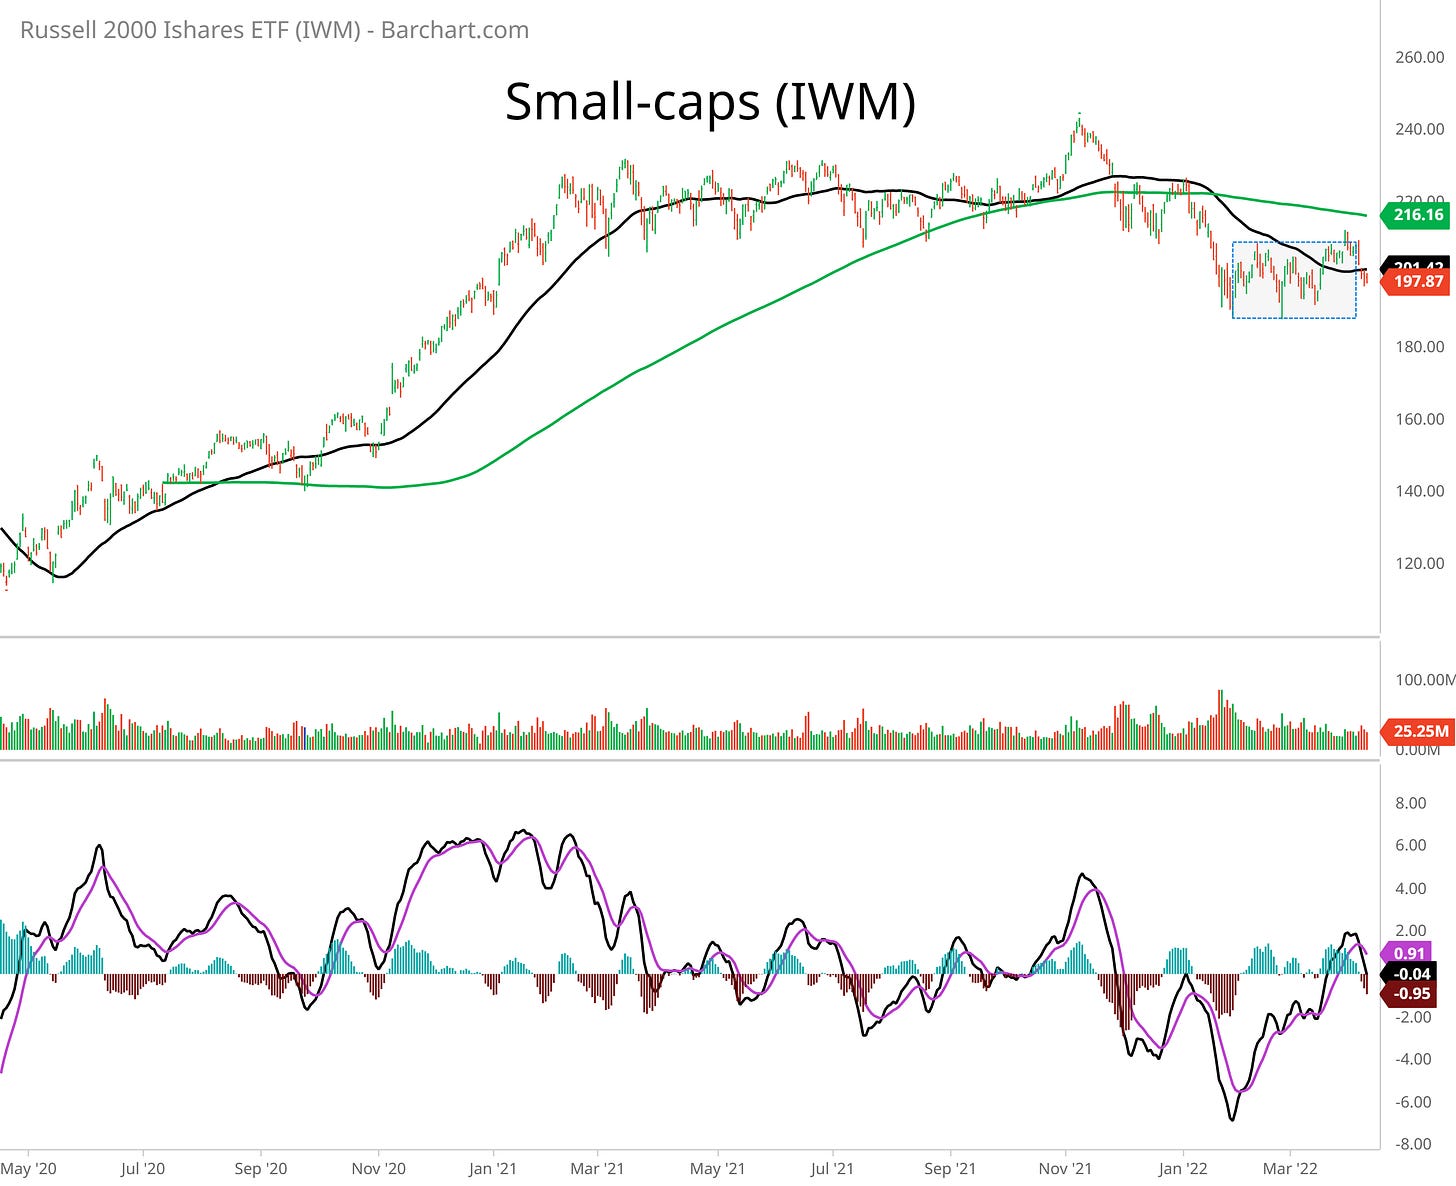
But small-caps are in a worse position as you can see with IWM. Price is below both key moving averages, and I would watch the low end of the boxed range. A breakdown would be a huge warning for the rest of the market.
We’re also seeing weakness in other important sectors, like transports and semiconductors, while defensive areas of the stock market show relative strength. Check out this move in utilities as the stock market has pulled back.
The recent weakness across the market means that the percent of stocks trading above their 20-day moving average is moving lower. This is one of my preferred metrics for gauging short-term trends in the stock market, and we still have more room to work lower toward oversold conditions.
One last thought here. I’m following metrics of stock and bond market stress to determine if last week’s dip starts to turn into something more serious. Volatility levels aren’t too worrisome, but a move over 22 then 24 in VIX could trigger more selling by risk parity strategies.
In bond markets, high-yield spreads moved back toward historically low levels over the past month. That suggests surging interest rates and inverted yield curves isn’t causing too much stress in fixed income…at least yet. A move back toward 3% would be an early warning signal.
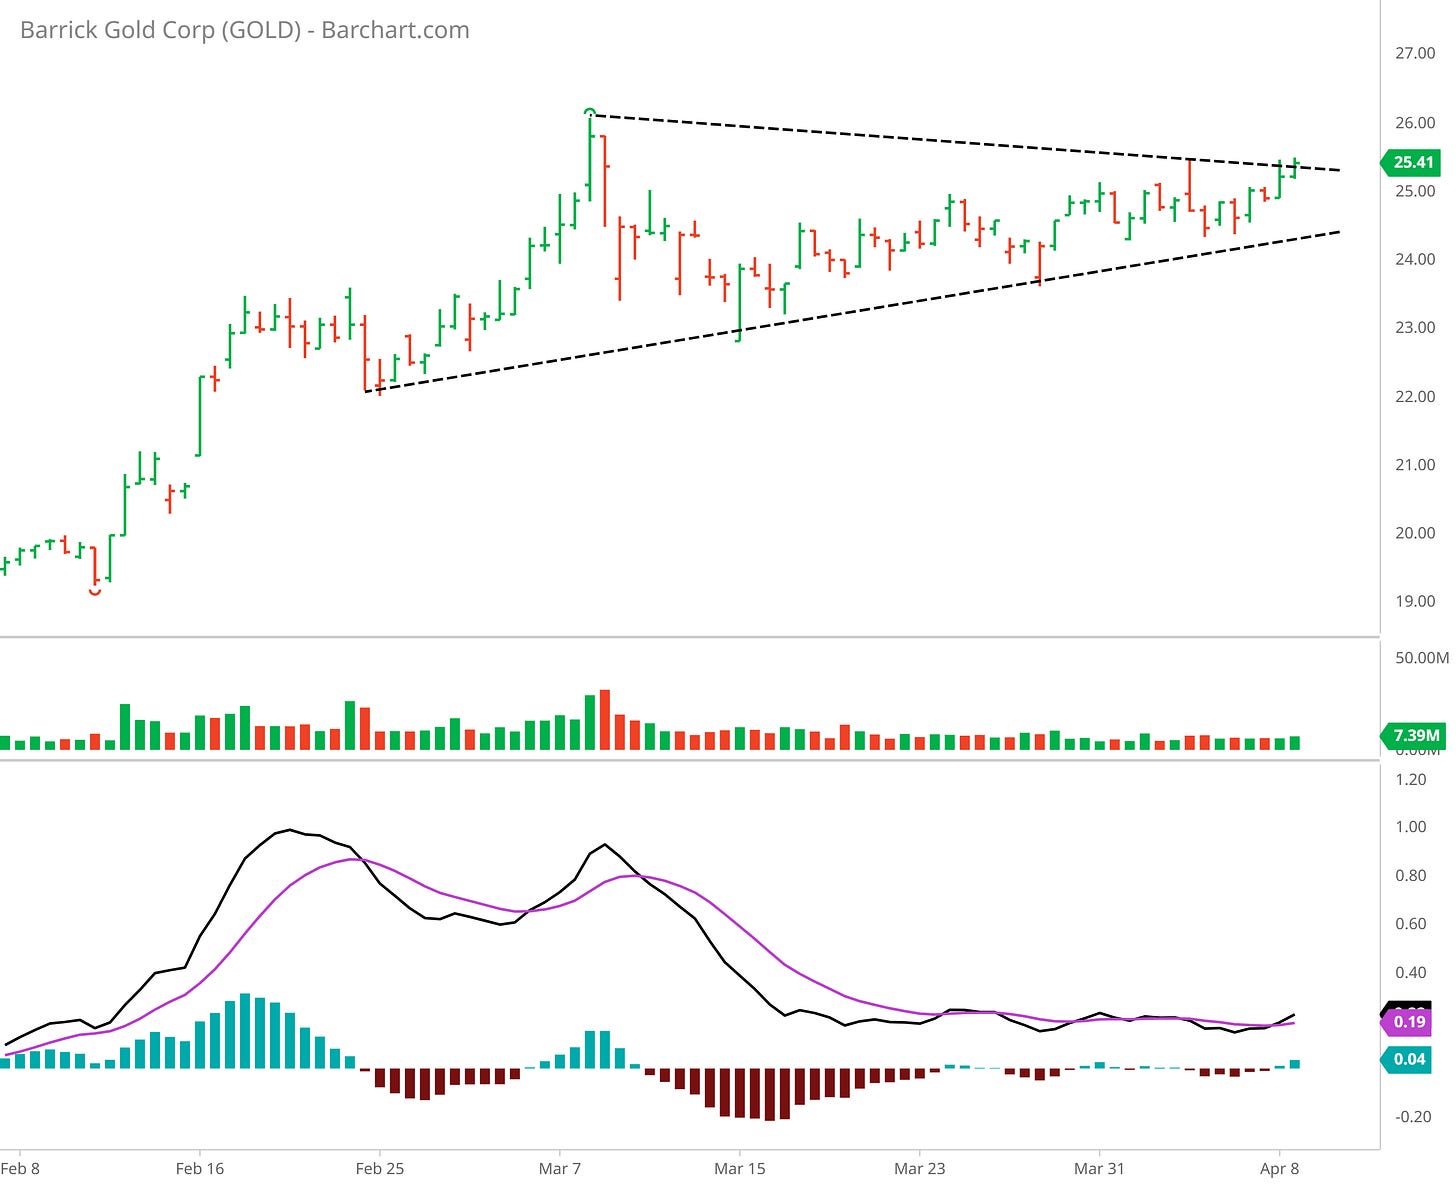
I’m taking a cautious approach with new longs in this market. At least until we see signs of becoming oversold and economically-sensitive sectors start to show relative strength. And with the longs I am considering, many are tied to defensive and “safe haven” corners of the stock market. That includes opportunities with gold miners, and I’m watching GOLD. Here’s a four-hour chart to zoom in on the pattern I’m following. Barrick Gold might be in the early stages of a move out of this triangle, which could see $30 on a successful breakout.
That’s all for this week. I hope you’ve enjoyed this edition of The Market Mosaic, and please share this newsletter with anyone you feel could benefit from an objective look at the stock market!
Make sure you never miss an edition by subscribing here:
Plus for updated charts and other trade ideas, follow me on Twitter: @MosaicAssetCo


