
The Market Mosaic 3.23.25
S&P 500: More bullish catalysts to support a low.

👋Welcome back to The Market Mosaic, where I gauge the stock market’s next move by looking at macro, technicals, and market internals. I’ll also highlight trade ideas using this analysis.
If you find this report helpful please hit that “like” button, share this post, and become a subscriber if you haven’t already done so!
And be sure to check out Mosaic Traders Hub. It’s a members-only platform to alert trade ideas, track a model portfolio of open positions, and further analyze the message coming from the capital markets.
🚨You can start a 7-day free trial to the Hub by clicking here. By starting a trial, you will unlock all market updates and trade alerts reserved exclusively for members.
Now for this week’s issue…
Following another rate-setting meeting by the Federal Reserve, major stock indexes staged a rally that finally snapped a four-week losing streak for the S&P 500.
The Fed elected to keep interest rates unchanged as widely expected. But the central bank’s updated Summary of Economic Projections went in the direction of stagflation. The median forecast saw economic growth estimates revised lower (1.7% from 2.1%) while the inflation outlook increased (2.8% from 2.5%) compared to December’s projections.
But amidst concerns over the growth outlook, there were dovish elements in the Fed meeting as well. Quantitative tightening around the balance sheet runoff will be reduced from $25 billion per month to $5 billion. While there is speculation that the reduction is temporary, comments from Fed chair Jerome Powell would suggest otherwise. Since 2022, the Fed’s balance sheet has declined by over $2 trillion (chart below).

At a time when the rate of change in the M2 money supply is still inflecting higher, the reduction in the Fed’s balance sheet runoff could deliver another boost to the liquidity backdrop and help stabilize the stock market.
The dovish aspects of the Fed meeting helped the stock market finally deliver a green week. But investors are still wondering if the lows will hold following the S&P 500’s fall into correction.
We’ve already been following the conditions in place to see a rally unfold across breadth and sentiment. But more bullish signs are emerging that the S&P 500 can keep building off the lows seen on March 13.
This week, let’s take a look at how investor positioning is becoming a tailwind for the stock market. I also want to unpack the Fed’s updated economic projections, and why the global liquidity cycle remains a tailwind for asset prices.
The Chart Report
While Fed Chair Powell downplayed the potential inflation impact of tariffs as being “transitory”, central bank officials clearly see more downside risk to the economy after lowering growth estimates. In their updated economic projections, Fed members now see 2025 GDP growth at 1.7% compared to 2.1% in December’s projections. But the table below shows where members see risks to the outlook, and if inflation and economic growth will surprise to the upside or downside. On the right hand side of the chart, you can see a significant jump in members seeing risks weighted to the downside for growth compared to December’s projections.

The global liquidity cycle remains a bullish tailwind for stock prices. The yearly rate of change in M2 money supply is accelerating after dropping into negative territory for the first time ever, and financial conditions remain much looser than average. Just as the Fed is set to slow its balance sheet runoff, the global liquidity cycle that tracks long-term credit creation is in full swing (chart below). The current cycle started in 2022 and is not projected to peak until later this year. Liquidity and ample credit is the lifeblood of asset prices, and remains a positive catalyst for speculative assets like stocks.

Various investor surveys have shown sentiment becoming excessively bearish. The AAII survey of retail investors has stayed near bearish extremes for four consecutive weeks. And CNN’s Fear & Greed Index has been in extreme fear territory for nearly a month. But indicators of investor positioning were not confirming via bearish allocations until recently. The National Association of Active Investment Managers is now showing equity exposure among active managers dropping to low levels (chart below). That shows investor positioning is starting to reflect the bearishness in survey indicators, which is a bullish contrarian indicator.

Commodity Trading Advisors (CTAs) manage investment portfolios utilizing futures contracts. That includes futures tied to stock market indexes like the S&P 500 and Nasdaq 100 Index. CTAs frequently deploy momentum and trend following strategies to adjust exposure. The chart below shows CTA exposure to US equities, which turned negative for the first time since the last correction in 2023. A modest rally in stock indexes could trigger short-covering by CTAs and help fuel fund flows into equities.

Another boost to fund flows could come from risk-parity strategies. These institutional investors target a risk budget, and reduce equity exposure when volatility levels are rising. The CBOE Volatility Index (VIX) measures implied volatility on the S&P 500 and has a long-term average around 20. Whenever the VIX jumps above the long-term average, that can fuel selling by risk-parity strategies to stay within their risk budget. But the opposite can happen when vol levels drop below average, which allows risk-parity to increase equity exposure. The chart below shows the jump in VIX above 20 in late February shortly after the peak in the S&P 500. The recent rally is helping push VIX back below 20, which can draw risk-parity flows and further stabilize VIX levels while creating a positive feedback loop for stock prices.

As institutional positioning evolves to support fund flows into the stock market, there have been signs that institutions are already becoming active. Since the recent market lows on March 13, several days have seen a large imbalance of advancing stocks relative to declining issues. That includes within the S&P 500, which saw back-to-back days with 90% advancing issues. The table below looks at past instances of consecutive 90% days going back to 1972. You can see the S&P has positive forward returns 90% of the time 3-, 6-, and 12-months out along with stronger than average gains.

Heard in the Hub
The Traders Hub features live trade alerts, market update videos, and other educational content for members.
Here’s a quick recap of recent alerts, market updates, and educational posts:
Adding new trades in miners to take advantage of gold’s rally.
A high-growth stock breaking out to new highs as the market bottoms.
How to use market internals to confirmation the correction lows are in.
One sector showing relative strength could be a winner on a market recovery.
You can follow everything we’re trading and tracking by becoming a member of the Traders Hub.
By becoming a member, you will unlock all market updates and trade alerts reserved exclusively for members.
👉You can click here to join now👈
Trade Idea
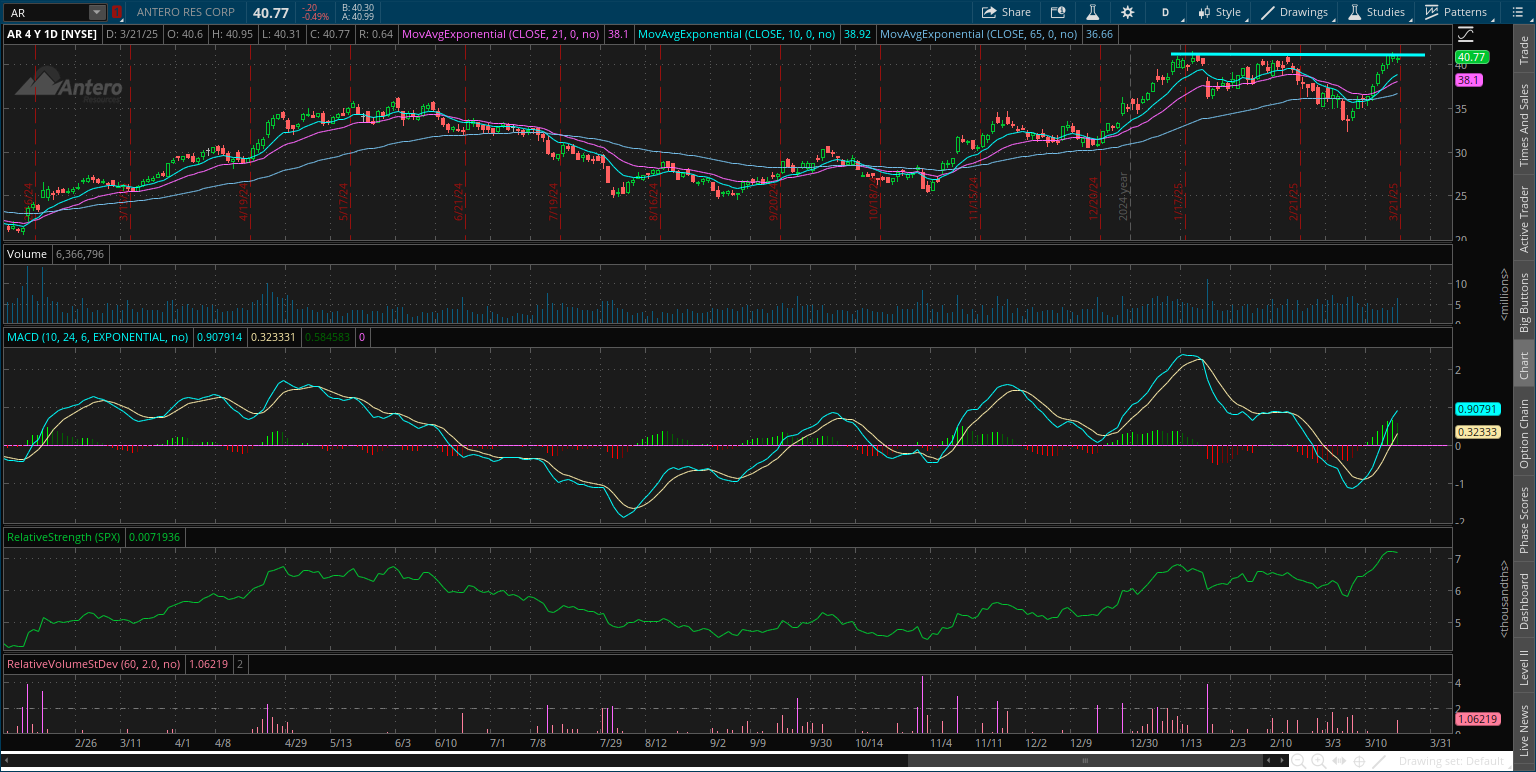
Antero Resources (AR)
Oil and gas stock making a base-on-base pattern after breaking out from a larger base over the $34-35 area at the end of December. The stock is creating a new resistance level at $41. I want to see one more smaller pullback before attempting a breakout over $41.
Key Upcoming Data
Economic Reports

Earnings Releases

I hope you’ve enjoyed The Market Mosaic, and please share this report with your family, friends, coworkers…or anyone that would benefit from an objective look at the stock market.
Become a member of the Traders Hub to unlock access to:
✅Model Portfolio
✅Members Only Chat
✅Trade Ideas & Live Alerts
✅Mosaic Vision Market Updates + More
Our model portfolio is built using a “core and explore” approach, including a Stock Trading Portfolio and ETF Investment Portfolio.
Come join us over at the Hub as we seek to capitalize on stocks and ETFs that are breaking out!
And if you have any questions or feedback, feel free to shoot me an email at mosaicassetco@gmail.com
Disclaimer: these are not recommendations and just my thoughts and opinions…do your own due diligence! I may hold a position in the securities mentioned in this report.
Good post! That CTA positioning is wild.