The Market Mosaic 2.19.23
Conditions point to a stock market pullback...but that could be a good thing.
Welcome back to The Market Mosaic, where I gauge the stock market’s next move by looking at macro, technicals, and market internals. I’ll also highlight trade ideas using this analysis.
If you find this content helpful please hit that “like” button, share this post, and become a subscriber to this always free newsletter if you haven’t already done so!
And be sure to check out Mosaic Chart Alerts. It’s a midweek update covering my best chart setups among long and short ideas in the stock market, along with specific levels that would trigger a trade.
Now for this week’s issue…
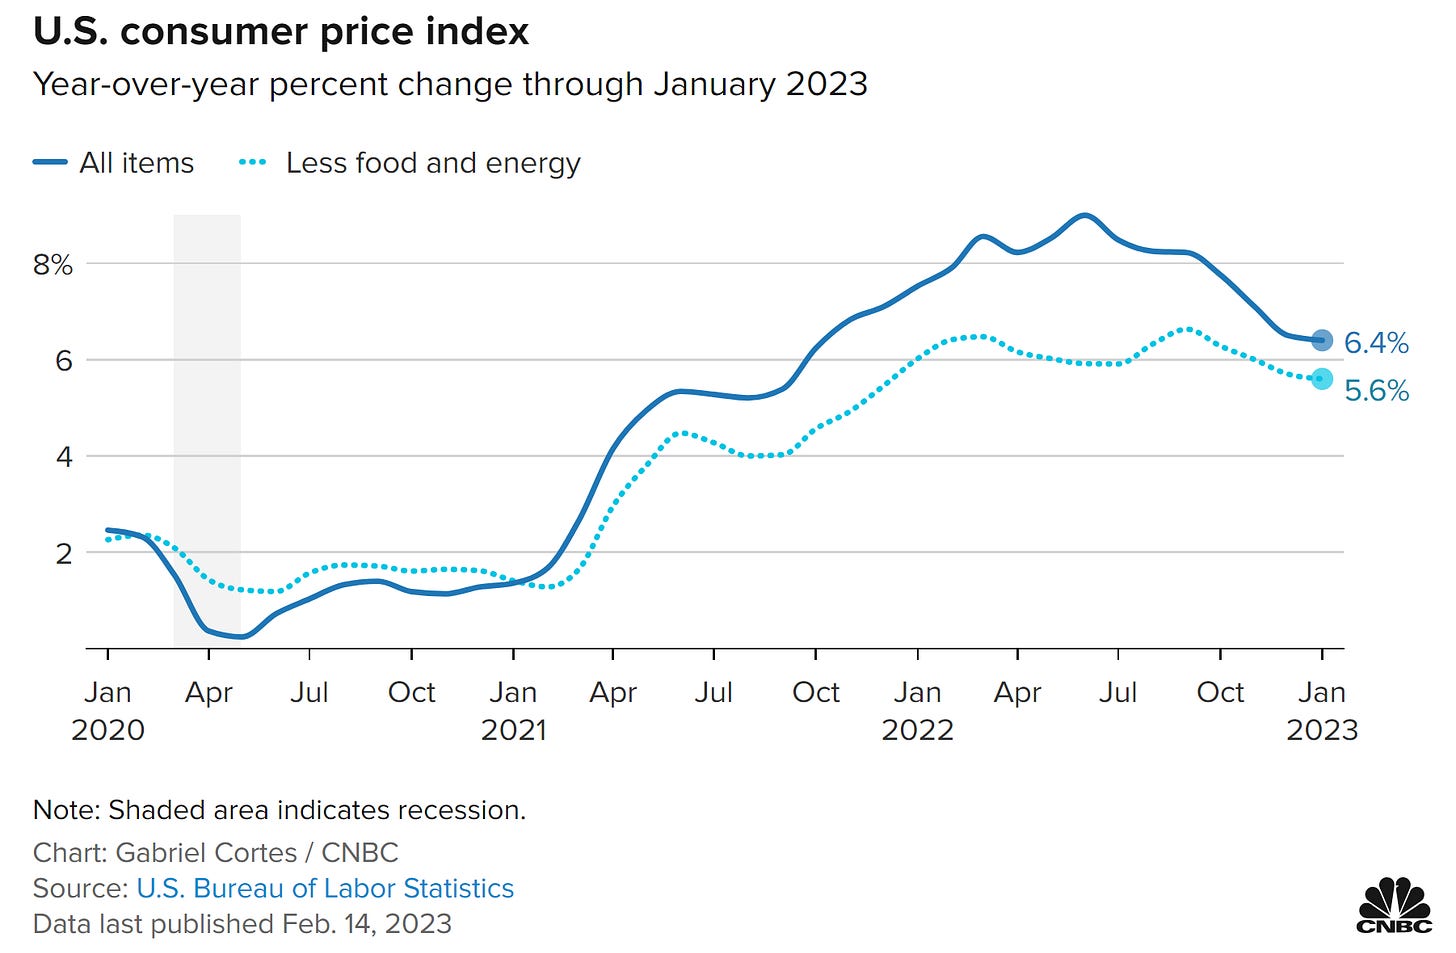
When the latest report on consumer inflation was released, it sure looked like investors were in store for a roller coaster ride. The Consumer Price Index (CPI) was reported at 6.4% for the month of January (see the chart below), and while inflation is moderating from prior months it’s still higher than economists were expecting.
And since CPI has much bearing on the Federal Reserve’s rate setting policy, it has become one of the most highly anticipated releases every month. It’s also developed a reputation for delivering wild price swings in the stock market. Back in October, the S&P 500 traded in a 5.5% range in a single day when CPI came out!
That’s why the market’s reaction is so notable. Despite the hotter than expected inflation figure, the S&P 500 traded flat which is yet another sign of character change in the stock market this year. And it follows a string of other positive signals that’s accompanied the rally to start 2023.
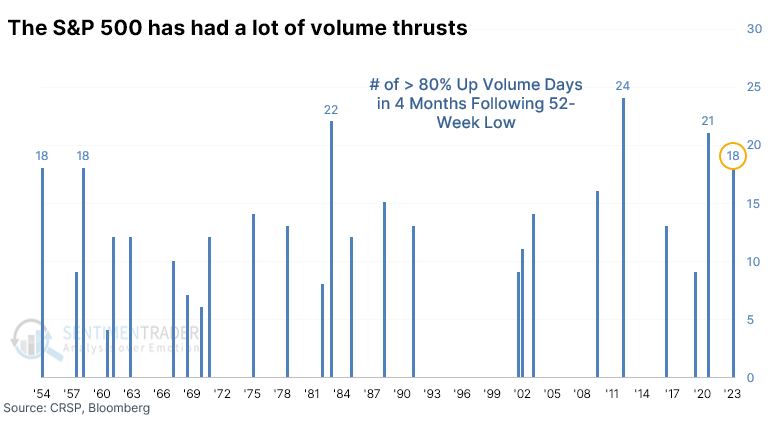
Back in January, short-term breadth signals and record fear among investors pointed to conditions for a rally as I discussed here. That gave way to several breadth thrusts, which is a positive longer-term signal for stocks as it indicates institutions are buying. Here’s another example with the number of days seeing more than 80% of volume in issues trading higher. At 18 days over the last four months, that’s a historically high level where prior clusters have marked significant bottoms following a selloff.
Then you have the right sectors leading the way, with cyclical industries like transports and semiconductors outperforming. Now falling levels of volatility like the muted reaction to CPI is another step in the right direction for the bull camp.
Collectively, here’s what I think these signals mean for investors, what I’m watching in the stock market’s next move, and how to interpret the positives against the big picture macro backdrop.
A Stock Market Pause that Refreshes
The year is off to a great start, but a pause in the uptrend would be a healthy development. That would allow stocks to consolidate recent gains and setup another move higher. It also creates the potential for fresh breakout opportunities (more on that below).
And there are several signs that a dip could unfold in the near-term. Since the start of February, a growing divergence is showing up in the percent of stocks trading above their 20-day moving average. You can see that in my post below, where participation in the stock market’s uptrend is being supported by fewer stocks.


Deteriorating breadth is also showing up in the McClellan Summation Index. This metric is built off of the net number to stocks advancing versus declining on the NYSE. After signaling positive breadth since the start of 2023, the Index turned lower at the start of the month.
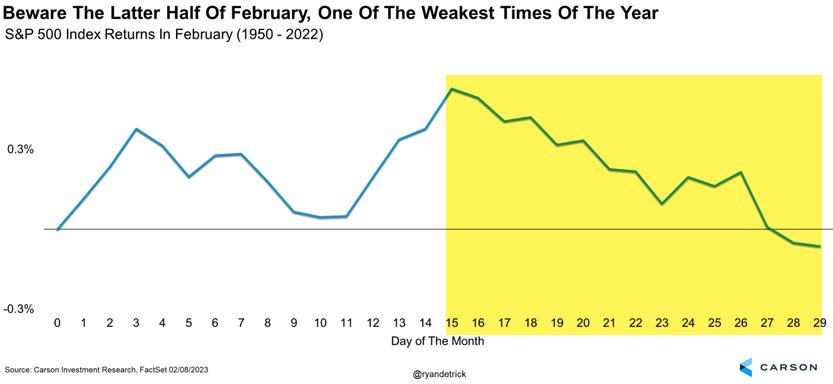
We are also entering a seasonally weak period for the stock market. In the chart below from Ryan Detrick, you can see the S&P 500 has historically dipped during the second half of February. I wouldn’t make trading decisions based on seasonality alone, but the upcoming period of weakness is notable alongside worsening breadth.
If we do see a pullback, it will be key to study the reaction in stocks that have recently been breaking out. The second half of 2022 was characterized by a large number of failed breakouts, where stocks emerging from consolidation patterns were unable to hold onto gains for very long.
I will look for recent breakouts to hold key short-term moving averages, like the 21-day exponential moving average, and NOT fall back into their prior consolidation ranges.
That messaging will say a lot about the durability of this rally, and whether the bear market is preparing to make a return.
Now What…
Anytime the stock market dips, be ready for the bears come back out in full force. They have a great point about the economic and earnings outlook. As I covered last week, the divide between lagging and leading indicators is absolutely incredible.
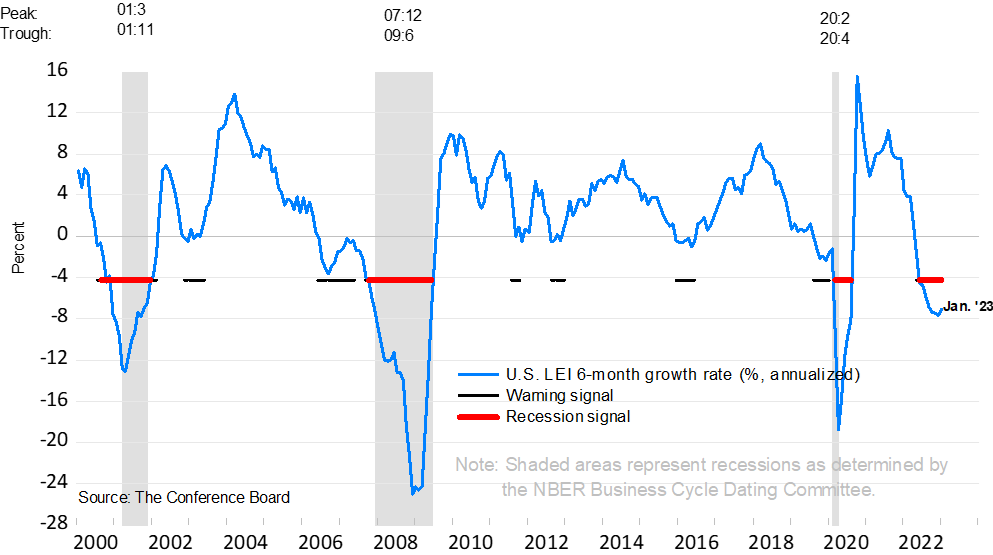
That was demonstrated again this week when an updated report on leading economic indicators came out, which is still flashing recession signals as you can see below.
But since CPI is still running over three times the Fed’s inflation target of 2% and a healthy first quarter GDP report is in the making, the burden remains on the Fed to keep hiking rates…threatening to further divide the gap between current conditions and the outlook.
I’m staying aware of the big picture macro environment, including the latest report on leading indicators and deeply inverted yield curves. But above all else, I will follow the message coming from the stock market, and will pay particularly close attention to how recent breakouts handle any broader market weakness as discussed above.
As has been the case since last year, my primary adjustment considering macro uncertainty is to reduce my typical position size and be more proactive on taking gains (versus letting positions ride until they hit my tailing stop).
That also means I continue to take breakouts that meet my criteria for fundamentals, momentum, and relative strength. I posted about the setup on BOWL and here’s an updated chart below. The stock closed above the $15 breakout level on Friday, and look at the volume on gains from the last four candlesticks.
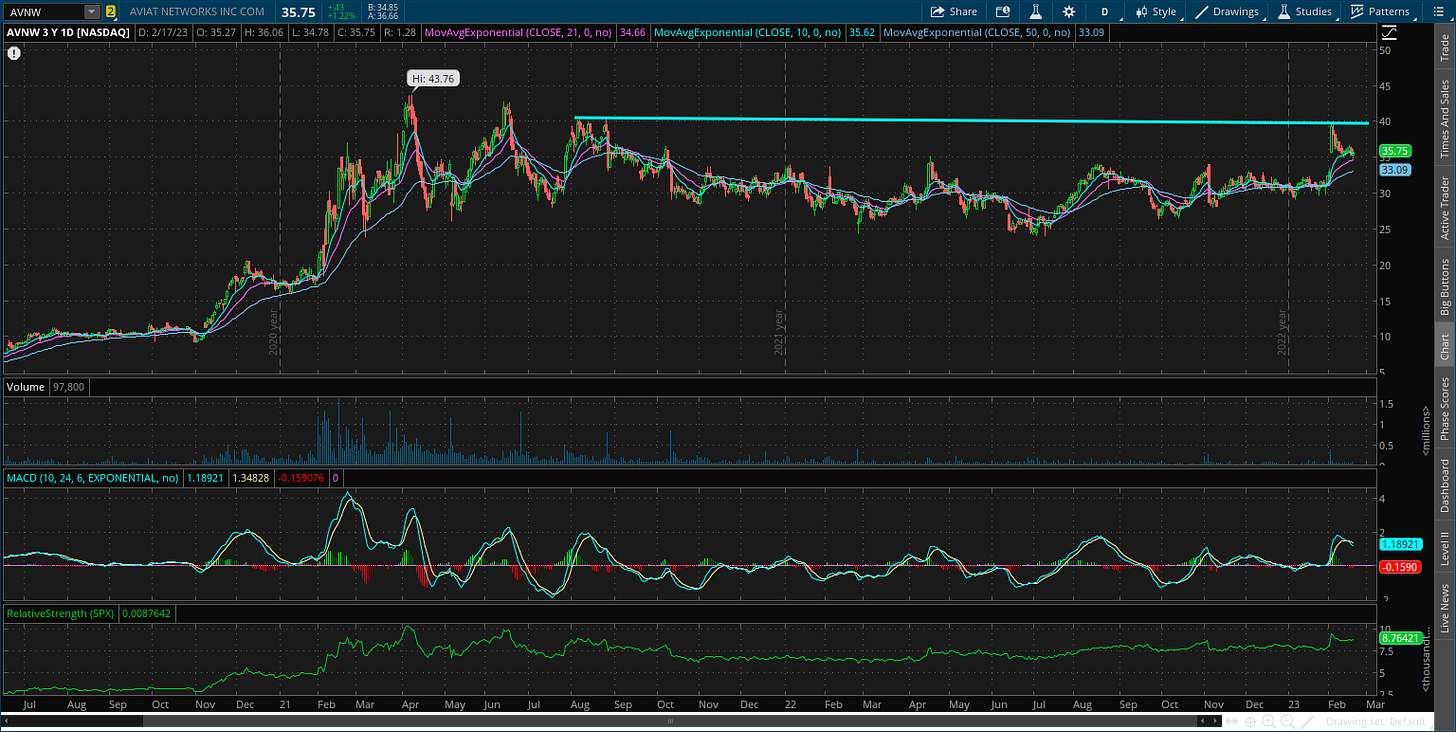
Here’s another setup I’m tracking with AVNW. This is a great example where a pullback can help this breakout pattern setup. The stock has been consolidating after a gap higher on earnings. That’s resetting the MACD back toward the zero line, recharging momentum before a run at the $40 level.
That’s all for this week. The coming week will feature earnings and consumer insights from several retail bellwethers including Walmart, Costco, and Target as well as the Q4 GDP report. But I will be paying most attention to how stocks handle the combination of deteriorating breadth and challenging seasonality.
I hope you’ve enjoyed this edition of The Market Mosaic, and please share this newsletter with your family and friends…or anyone that would benefit from an objective look at the stock market.
And make sure you never miss an edition by subscribing here:
For updated charts, market analysis, and other trade ideas, give me a follow on Twitter: @mosaicassetco
And if you have any questions or feedback, feel free to shoot me an email at mosaicassetco@gmail.com
Disclaimer: these are not recommendations and just my thoughts and opinions…do your own due diligence! I may hold a position in the securities mentioned in this newsletter.




Thanks you. Appreciate your thoughts processes. Truly looking forward to your next discussion
Cheers