The Market Mosaic 1.29.23
Signs of a new bull market. Or just another bear market rally?
Welcome back to The Market Mosaic, where I gauge the stock market’s next move by looking at macro, technicals, and market internals. I’ll also highlight trade ideas using this analysis.
If you find this content helpful please hit that “like” button, share this post, and become a subscriber to this always free newsletter if you haven’t already done so!
And be sure to check out Mosaic Chart Alerts. It’s a midweek update covering my best chart setups among long and short ideas in the stock market, along with specific levels that would trigger a trade.
Now for this week’s issue…
Despite the S&P 500 closing down 19% at the end of 2022, the stock market was showing subtle signs of improvement under the hood.
The first clue was a growing number of stocks in short-term uptrends. Even as the S&P 500 was reeling from a 5.8% decline in December, the percent of stocks trading above their 20-day moving average (MA) was moving higher. That happened as bearish sentiment hit its highest level ever as measured by the equity put/call ratio…a contrarian bullish signal.
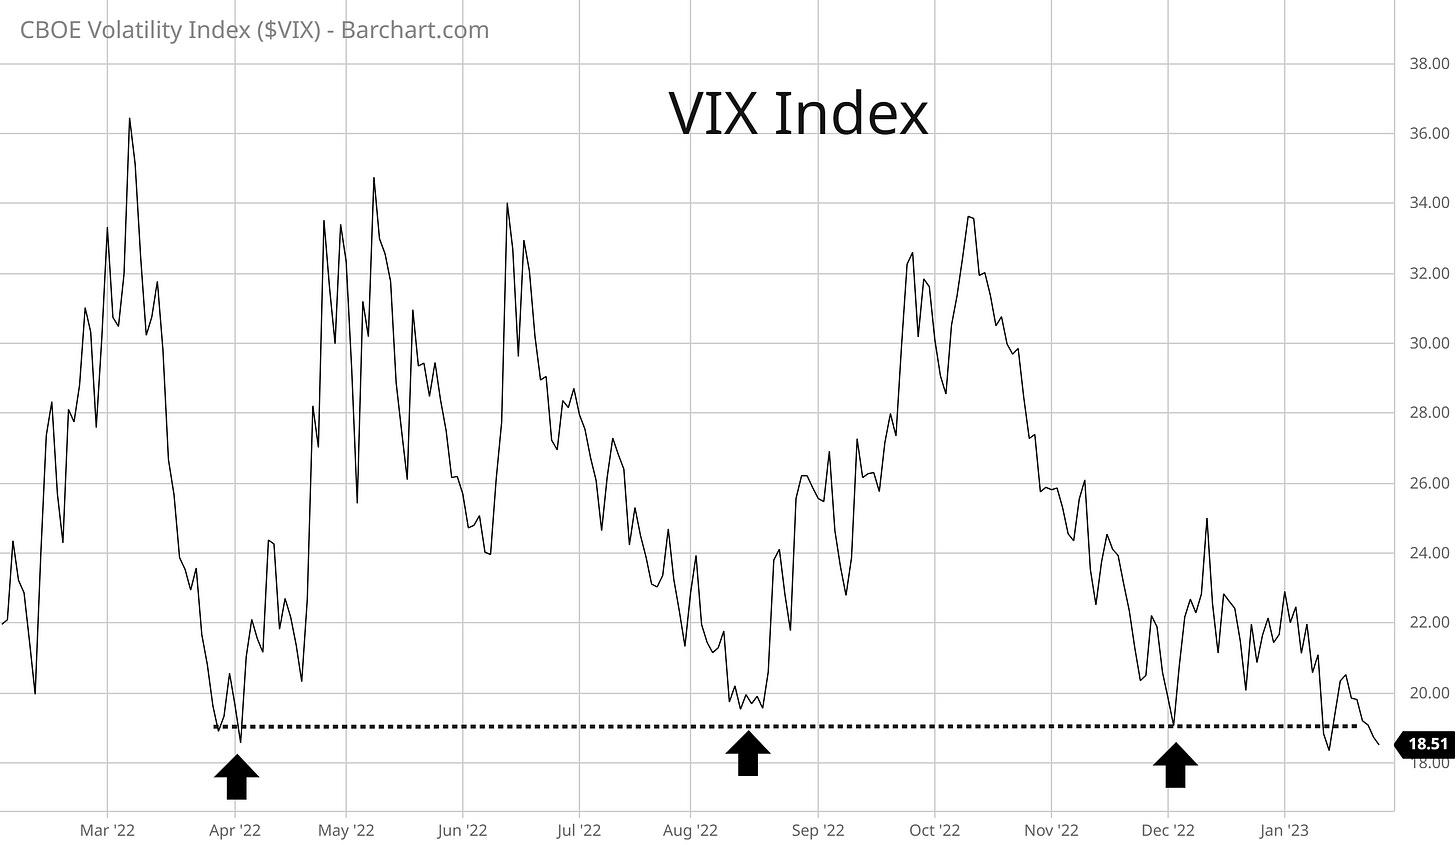
Then came falling volatility levels as the stock market stabilized (see the VIX chart below). I previously explained how falling volatility can draw institutional fund flows back into the stock market. That was evidenced by the breadth thrusts I covered last week.
Next came the all important test of the S&P’s test of the 200-day MA, which has stopped four prior rally attempts over the past year. But I showed you here how an important stock sector was already pointing the way higher. Economically-sensitive semiconductor stocks were showing relative strength and leaving their 200-day MA behind.
That weight of the evidence – our mosaic – favored the S&P 500 breaking out over the 200-day moving average and trendline resistance stemming from the 2021 peak. That’s exactly what happened last week as you can see in the chart below.
Now investors are wondering: can this really be the start of a new bull market, or just another bear market head fake?
After all, every other rally attempt over the past year fizzled out as the bear remained in charge. But now for the first time, there are concrete signs that a new bull market is underway. Here’s what I’m following…and if I think this rally is prone to failure.
Building A Bullish Foundation
I’m a strong proponent of tracking participation to gauge the strength of the stock market’s trend. Breadth can be measured in a variety of ways, spanning short- and long-term time frames.
While most of my commentary and analysis focuses on the near-term to assist trading strategy, today I want to spotlight metrics that can help confirm (or deny) the stock market’s longer-term trend.
I recently wrote about tracking cumulative net new 52-week highs on the NYSE, and how this functions as a longer-term breadth metric. You can utilize a moving average to create bull/bear signals, while I noted that a potential bullish development was in the works:
Now we’re potentially seeing a crossover back above, which would be a positive longer-term signal for the market.
Here’s the updated chart below, where you can see that we indeed have a bullish crossover for the first time since June 2020…coming out of the last bear market.
I also want to spotlight bullish action with the percent of stocks trading above their 100-day moving average. By using the 100-day MA, we can look at how many stocks are trading in intermediate-term uptrends.
Look at the action in this metric since last June. As the S&P 500 (blue line) sold off and made a new low, the percent of stocks gauge (black line) made a higher low as shown with the arrows. Then as the S&P rallied into December, the percent of stocks over their 100-day MA made a higher high relative to August while the S&P didn’t (shown with the circles). Those are positive divergences, and you can see breadth is still leading the way higher in 2023.
Those positive breadth developments makes the S&P 500’s break above the 200-day MA even more significant. Strong participation in the uptrend is the foundation needed to sustain a new bull market.
Here’s what to know about the bullish signals that the stock market is sending.
Now What…
Admittedly, I’m conflicted right now on declaring a new bull market is underway. More than anything, I put the most weight into the message and evidence coming directly from the stock market.
The combination of the stock market’s trend, strong breadth, and leadership from the right sectors is all very encouraging.
But the recent moves contradicts the macro signals pointing to caution. An updated look at the Conference Board’s Leading Economic Index (LEI) shows yet further deterioration. Not only does that strengthen the recession signal, but the year-over-year decline in LEI tends to produce negative forward returns for the S&P 500.
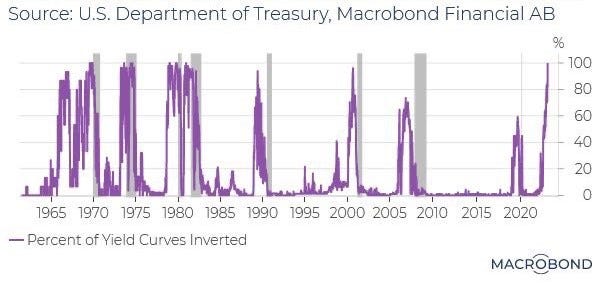
Economic signaling from the yield curve also continues to worsen. There are many different yield curve combinations, and you can track how many are inverted. The chart below shows that nearly all yield curve combinations are inverted, and is a strong recession signal historically (represented by the shaded areas).
A looming recession could negatively impact the earnings picture and drive the next phase of the bear market as I wrote about last week.
Here’s how I’m reconciling the conflicting bullish/bearish views.
I’m still taking high quality long setups that break out, while the biggest change I’ve made is increasing position size on trades. But I’m not as aggressive as I would be if macro signals were aligned with the stock market.
Some of those setups are developing in the transportation sector. Breakouts in this economically-sensitive sector would be another positive sign for the broader market…similar to semiconductors noted above.
Here’s one pattern that I’m tracking with HUBG, where I’m watching for a breakout over the $87 resistance level (please note that earnings are due on 2/2).
There are also breakout setups developing across various energy-sector stocks. That includes service providers and equipment suppliers into the industry like with RES. I describe the setup in the post below:
That’s all for this week. While each coming week feels like it’s the most important one ever for the stock market, that may hold true this time. We have a highly anticipated Federal Reserve meeting, PMI gauges that will provide a real-time look at economic activity, the January jobs report…not to mention earnings reports from companies like Apple, Amazon, and Google. Expect plenty of volatility, but stay disciplined and follow your trade plan!
I hope you’ve enjoyed this edition of The Market Mosaic, and please share this newsletter with your family and friends…or anyone that would benefit from an objective look at the stock market.
And make sure you never miss an edition by subscribing here:
For updated charts, market analysis, and other trade ideas, give me a follow on Twitter: @mosaicassetco
And if you have any questions or feedback, feel free to shoot me an email at mosaicassetco@gmail.com
Disclaimer: these are not recommendations and just my thoughts and opinions…do your own due diligence! I may hold a position in the securities mentioned in this newsletter.


Thanks as always.