👋Welcome back to The Market Mosaic, where I gauge the stock market’s next move by looking at macro, technicals, and market internals. I’ll also highlight trade ideas using this analysis.
If you find this report helpful please hit that “like” button, share this post, and become a subscriber if you haven’t already done so!
🚨And be sure to check out Mosaic Traders Hub. It’s a members-only platform to alert trade ideas, track a model portfolio of open positions, and further analyze the message coming from the capital markets (👇be sure to check out our offer to join the Hub below).
About 18 months ago, I published a research report detailing my outlook for the stock market and key catalysts that would drive equity prices through the end of 2025.
My bullish views at that time were built around liquidity, an economy supporting the earnings outlook, and decade cycle seasonality. You can read the original post here.
Here’s quick summary of my views from back then that would drive the bull market to new heights through the end of 2025:
Liquidity Cycle
Liquidity is the lifeblood of asset prices, especially speculative ones like stocks and cryptocurrencies. I like to think about liquidity in a similar manner as financial conditions, which impacts the availability and cost of credit.
Plentiful liquidity can help promote looser financial conditions, which means that credit is readily available and at a low cost.
While many measures of financial conditions are already looser than historical averages, there are emerging signs that improving liquidity could deliver another positive boost.
That includes the year-over-year change in the M2 money supply. The M2 money supply is a broad measure of cash or instruments that can be quickly turned into cash in the U.S.
After surging in the wake of the pandemic, growth in M2 turned negative for the first time ever in 2022. The deceleration in growth and plunge into negative territory coincided with 2022’s bear market in the S&P 500. But a couple months ago, M2 growth turned back positive.
There are signs that the liquidity cycle is improving on a global scale, and not just in the U.S. The chart below comes from Capital Wars (via the Financial Times), who constructed a Global Liquidity Index that takes into account cash and credit across the global financial markets.
You can see in the chart that the global liquidity cycle is in the early stages of turning higher. Along with positive M2 growth, improving liquidity conditions on a global scale through next year can help boost asset prices including stocks.
Earnings Growth
Looser financial conditions are historically correlated with positive economic growth. And there are signs that the rate of change in both the economy and corporate earnings is improving.
You can see in the chart below that forward earnings estimates for the S&P 500 continue moving out to new highs. Positive revisions led forward earnings to new all-time highs in late 2023, which was well before the S&P 500 was breaking out to record highs.
And it’s not just in the U.S. Forward earnings estimates for various international regions including emerging markets, Europe, and Japan continue moving higher as well. And earnings across those regions can keep increasing given the evidence of rebounding economic activity.
The chart below looks at manufacturing purchasing managers’ indexes (PMI) from around the world. PMI’s are constructed so that a reading above 50 indicates expansion while below 50 shows contracting activity. The chart shows the percentage of PMI’s across 35 countries that are above 50, which is rebounding this year and recently stands at 60%.
Despite gloomy news that tends to dominate mainstream headlines, manufacturing activity is rebounding in major economies across the world. A synchronized boost in corporate earnings is another catalyst to keep pushing the bull market forward.
Decade Seasonality
Much is made about seasonal patterns intra-year, like months that tend to see pockets of strength or weakness. We also have common mantra’s like “sell in May and go away” or the “Santa Claus Rally.”
But zoom out, and you’ll notice seasonal patterns unfold across longer time frames as well.
The chart below traces the average movement of the Dow Jones Industrial Average by years ending with the same digit going all the way back to 1897. In other words, how did the Dow perform on average in years ending with 1, 2, 3, and so on.
And historically speaking, years ending with “5” rank as the best across the decade. More recent decades with years ending in “5” like 2015 and 2005 experienced sideways volatile trading and don’t really stand out. But 1995, 1985, and 1975 all produced large gains for the Dow.
I would not make trading or investment decisions based on seasonal patterns alone. But I do find the strong stock market seasonality in year “5” interesting given the liquidity cycle and earnings growth catalysts mentioned above.
I would argue all three catalysts played a key role in driving the bull market to its current level, especially with those tailwinds converging at the same time.
While the outlook at that time had multiple factors favoring rising stock prices, the outlook for 2026 could encounter serious challenges as the year progresses. In other words, the easy money has been made while clouds are forming on the horizon.
What Lurks Ahead
Looking back, I would say that my analysis on the catalysts driving stock prices proved very accurate.
But I want to make one thing clear. I am neither a bull or a bear. Instead, I pride myself on being objective and adjusting to conditions as they evolve.
And right now, my read on the capital markets is that 2026 will be a pivotal year of transition. I expect a bullish start to the year largely based on a continuation of the factors that I outlined above.
But I’m tracking a growing possibility that the stock market could see a major peak in the year ahead.
I’m not pushing an agenda of economic fear or stock market uncertainty. I simply read and react to what’s developing in the capital markets. By being able to follow and interpret factors impacting stock prices, you can gain an edge in forecasting the forward path for the equity market.
In a forthcoming post, I will break down the key charts and catalysts that I believe will impact the stock market in the year ahead, along with specific factors I’m watching that could suggest a major peak in stock prices and a return of sustained volatility.
For now, I’m enjoying some time with my family during the holidays. There will be no Market Mosaic published on 12/27. I will be back at it the week after that, including my views on the year ahead.
I want to send a special thank you my Traders Hub members. I love the trading community we’ve built to take our market analysis and turn it into actionable trade ideas.
Since I launched the Hub, over the past year my hope is that I’ve shown you how to evaluate a trade setup, and the fundamental and technical factors that can lead to powerful gains.
By correctly identifying the conditions that would spark a risk-on trading environment, we’ve generated multiple double- and triple-digits gains by focusing on growth themes like AI, space, and quantum computing.
Those conditions also ignited precious metals, and we’ve seen great success trading gold and silver along with related mining stocks. I believe there’s more to come, and am excited for the trading opportunities developing as we enter a new year.
I want to wish everyone Happy Holidays, and I hope for nothing but prosperity for you and your family in the New Year.
🚨Traders Hub members: I will still send my video update next week and will remain active posting trade alerts and market analysis in the chat.
Heard in the Hub
The Traders Hub features live trade alerts, market update videos, and other educational content for members.
Here’s a quick recap of recent alerts, market updates, and educational posts:
The inflation sweet spot for commodity returns.
An alternative method to measure the Fed’s dovishness.
Silver’s breakout could be early innings based on this chart.
Why commodities are historically undervalued versus stocks.
How volatility in AI and growth stocks are helping their chart setups.
You can follow everything we’re trading and tracking by becoming a member of the Traders Hub.
By becoming a member, you will unlock all market updates and trade alerts reserved exclusively for members.
🚨Gold mining stocks could be setting up another round of breakouts. Hub members are currently sitting on gains of 152% and 103% on mining positions, while our silver trade is up 93%. Click the link below for a special discount to join the Hub today!
Forming a base-on-base pattern after a breakout to new highs over the $230 level back in August. The August gap higher over the $160 pivot level is serving as key support. A recent smaller pullback just below the highs is a bullish development. I’m watching for a move to new highs over the $270 level.
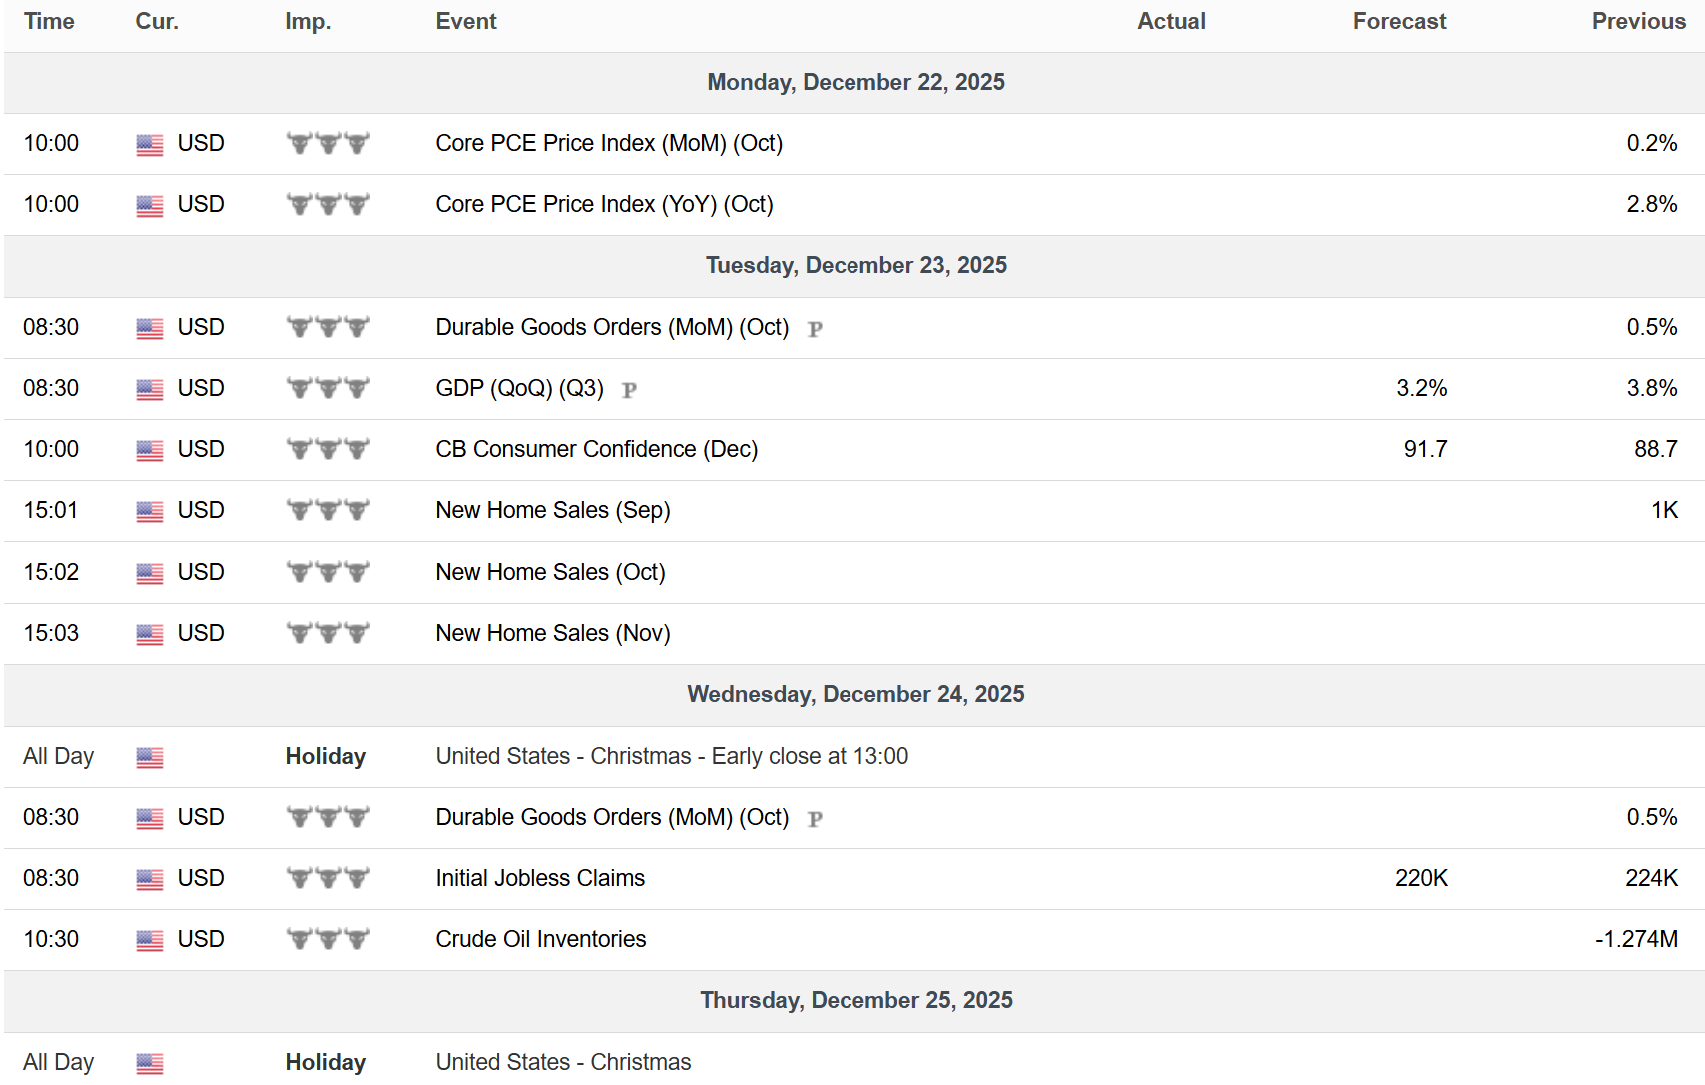
Key Upcoming Data
Economic Reports
Earnings Reports
I hope you’ve enjoyed The Market Mosaic, and please share this report with your family, friends, coworkers…or anyone that would benefit from an objective look at the stock market.
And if you have any questions or feedback, feel free to shoot me an email at mosaicassetco@gmail.com
Disclaimer: these are not recommendations and just my thoughts and opinions…do your own due diligence! I may hold a position in the securities mentioned in this report.