The Market Mosaic 12.17.23
Track commodity sectors following the Fed.
Welcome back to The Market Mosaic, where I gauge the stock market’s next move by looking at macro, technicals, and market internals. I’ll also highlight trade ideas using this analysis.
If you find this content helpful please hit that “like” button, share this post, and become a subscriber to this always free report if you haven’t already done so!
And be sure to check out Mosaic Chart Alerts. It’s a midweek update covering chart setups among long and short trade ideas in the stock market, along with levels I’m watching.
Now for this week’s issue…
Dovish surprises marked a busy week of macro reports before the holidays and year-end, and it started with inflation.
While the Consumer Price Index (CPI - blue line) came in as expected with a 3.1% increase in November compared to last year, the Producer Price Index (PPI - red line) rose just 0.9% year-over-year (chart below). It’s also worth noting that more recent CPI readings are just above 2% on an annualized basis.
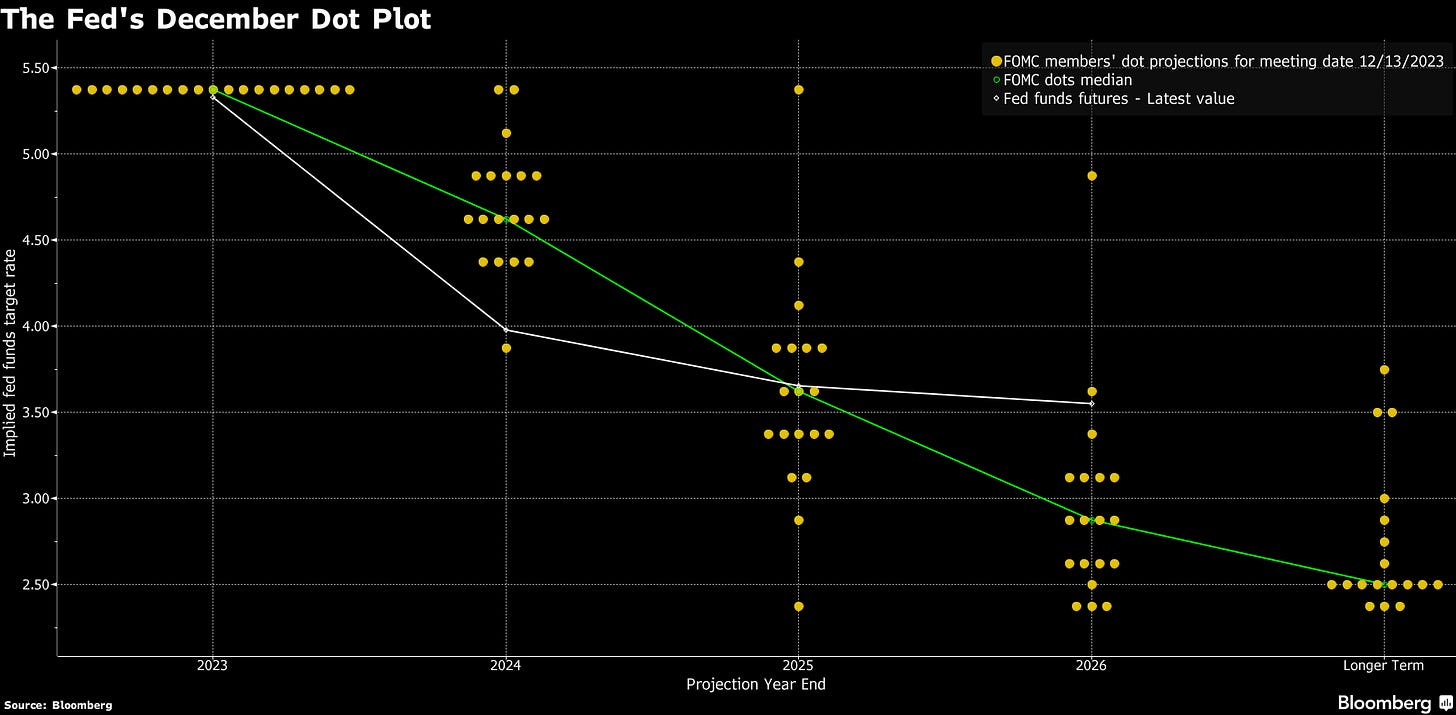
But the real fireworks came with the final Federal Reserve rate-setting meeting of the year. While holding rates steady at the highest level in over 20 years, the Fed’s updated Summary of Economic Projections (SEP) contained a surprise.
The SEP provides Fed members’ forecasts for things like inflation and where they think the fed funds rate will be in the future. The SEP below now shows the median forecast for fed funds at 4.6% at the end of 2024…implying at least 0.75% worth of rate cuts next year.
Assuming the Fed moves in 0.25% increments, that comes out to three cuts over the next twelve months. And during his press conference, Fed Chair Jerome Powell also revealed that Fed members discussed the possibility of rate reductions. It was only a couple weeks ago that Powell said rate cut speculation was premature.
But coupled with inflation trending toward the Fed’s 2% target, the dovish pivot by the Fed kicked off a chain reaction driving a boost in risk-on sentiment.
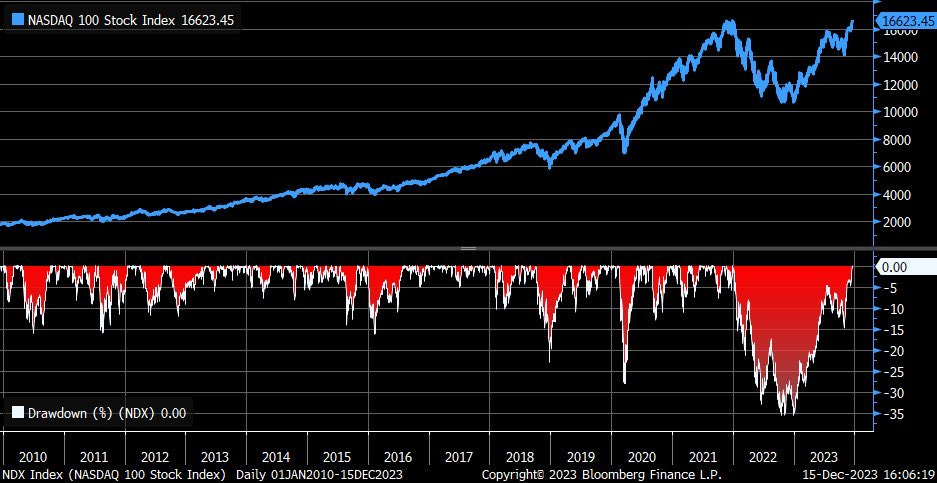
Both the Dow Jones Industrial Average and the Nasdaq 100 reached new all time highs this past week. That ended the longest and largest drawdown for the Nasdaq since 2010 as you can see below.

But there are other spillover effects that have big implications for other areas of the capital markets. Falling yields and a renewed dollar downtrend could spark commodity and cyclical sectors, which have been forming massive bases.
Here are several key charts that I’m watching into year-end.
Track How the Dominoes Are Falling
In the aftermath of last week’s inflation reports and Fed meeting, we could be in the early stages of very consequential moves in key markets.
Following signs that inflationary pressures are easing, interest rates on longer-dated bonds are continuing to pullback. The 10-year Treasury yield is now at 3.92% compared to nearly 5.0% just two months ago, while the 30-year Treasury yield has dropped to 4.0% compared to 5.11% over the same time frame.
I’m also paying close attention to recent moves in the U.S. dollar. The U.S. Dollar Index most recently made a peak at 114 back in September 2022 and started pulling back. After finding a bottom at 100 in July, the dollar then went on to retrace 50% of the decline off the peak as you can see below.
Following that retracement, the U.S. Dollar Index is rolling back over since October and could be setting up a test of support at 100. That’s a big level to watch, where a breakdown could be a major catalyst to support breakouts in several charts I’m watching.
A falling dollar and falling real yields can boost commodity prices, especially in the metals space. Most commodities are traded in dollars, so when the dollar weakens it increases the purchasing power of non-U.S. buyers. Plus commodities don’t make dividend payments. So when interest rates are rising, that makes fixed income a more attractive asset for investor capital. But when rates are falling, fixed income presents less competition for investor funds.
I’m still watching the breakout in gold prices over the $2,000 per ounce level. While many chart-watchers will tell you that gold experienced a false breakout at the start of December, the monthly chart below tells a different story.
Gold’s monthly candlestick chart shows multiple attempts to break over $2,000 on four different occasions going back to 2020. Those attempts all failed, while creating a key resistance level to watch. But last month’s candle held above $2,000, with price back testing what is now support.
I’m also watching metal producers and mining companies, with the XME metals and mining ETF providing exposure to different sub-industries like steel producers along with copper, gold, and coal miners.
Here’s the weekly XME chart below, which has been trading in a symmetrical triangle pattern since last peaking in early 2022. But price is recently breaking trendline resistance, which can set up a test of the prior high around $65.
While all-time highs on key stock market indexes are getting most of the attention, I believe a big move in key commodity markets and their related miners and producers could just be getting underway if the dollar and longer-dated yields keep pulling back.
Now What…
I don’t make predictions or forecasts based on an opinion, since opinions are often wrong. If you need any further evidence of that, just take a look at the Fed’s SEP from the end of 2021 (shown below). Back then, the most important and informed central bankers in the world saw the fed funds rate somewhere around 1.5-2.0% right now, and not the current 5.3% level.
I’m not trying to pick on the Fed, but I am highlighting the pitfalls of forecasts. So instead, I try to stay objective by following the message coming from the capital markets while staying adaptive and flexible in my views.
I have no idea how many times the Fed will cut rates next year. But I’ve frequently posted the chart below showing the 2-year Treasury yield (red line) which tends to lead fed funds (blue line). The market has been telling you that this hiking cycle is finished, and means last week’s developments should not have been much of a surprise.
I’m also not surprised to start seeing stock indexes move out to new highs. As I noted here back at the start of September, bullish action in leading sectors like semiconductors and homebuilders were pointing to new highs in the stock market. Both sectors are jumping to new highs over the last two weeks as well.
And if there’s yet another bullish development last week, it’s the massive expansion in net new 52-week highs across the major stock exchanges. The chart below shows the daily net new highs over the past year, which jumped over +500 on Thursday last week. That’s the highest daily level since May 2021.
It also shows that this is one of the best environments that we are seeing for breakout trading since before 2022’s bear market. I’m focusing on stocks with strong growth fundamentals that are that emerging from sound basing patterns. On a breakout, I prefer to see rising volume along with confirmation with the relative strength line at new highs.
Like what you recently saw with solar tracking stock NXT. The company has seen four consecutive quarters of year-over-year earnings growth over 100%. And you can see in the chart below how price broke above the $45 resistance level on rising volume and with the relative strength line confirming at new highs. I keep an updated list of breakout setups I’m tracking in Mosaic Chart Alerts, where you can find my most recent post here.
That’s all for this week. The economic calendar is much lighter for the week ahead, and will feature housing data and the PCE inflation gauge. While breadth and leading stock market sectors are pointing the way higher, I’ll also be following how trends in the dollar and interest rates are driving breakout setups in the commodity space.
I hope you’ve enjoyed The Market Mosaic, and please share this report with your family, friends, coworkers…or anyone that would benefit from an objective look at the stock market.
And make sure you never miss an edition by subscribing here:
For updated charts, market analysis, and other trade ideas, give me a follow on Twitter: @mosaicassetco
And if you have any questions or feedback, feel free to shoot me an email at mosaicassetco@gmail.com
Disclaimer: these are not recommendations and just my thoughts and opinions…do your own due diligence! I may hold a position in the securities mentioned in this report.


Thank you for this update. I am always learning something reading you!