
The Market Mosaic 1.19.25
S&P 500: Breadth and sentiment spark a rally.

Welcome back to The Market Mosaic, where I gauge the stock market’s next move by looking at macro, technicals, and market internals. I’ll also highlight trade ideas using this analysis.
If you find this content helpful please hit that “like” button, share this post, and become a subscriber if you haven’t already done so!
And be sure to check out Mosaic Traders Hub. It’s a members-only platform to alert trade ideas, track a model portfolio of open positions, and further analyze the message coming from the capital markets.
🚨You can start a 7-day free trial to the Hub by clicking here. By starting a trial, you will unlock all content and reports reserved exclusively for members.
For today’s update, I want to highlight several key charts I’m watching for the capital markets and how they are impacting the near-term outlook.
I also have a quick summary and links to recent posts that remain impactful for monitoring the markets. And after that, you can find a bonus trade idea on a chart setup that I’m monitoring.
Big Picture
Investors are breathing a sigh of relief after core consumer inflation came in cooler than expected. The headline Consumer Price Index (CPI) increased by 2.9% year-over-year in December, which matched estimates for the month. But the core measure that strips out food and energy prices increased by 3.2% which was less than expected and a slight deceleration from November’s pace. The chart below shows the core annualized rate over three-, six-, and 12-month time frames.

Although core CPI rose by less than expected during the prior month, I continue to expect that accelerating inflation could be a major theme as we progress through 2025. As I’ve previously highlighted, the Producer Price Index (PPI) often leads changed in CPI and continues tracking higher. While much was made of core CPI’s annual deceleration in December, the headline figure’s month-to-month change at 0.39% is the highest since last February. The chart below shows the monthly and 3-month annualized headline CPI, which has increased five months in a row.

Core CPI may be driving the narrative around last week’s 2.9% gain for the S&P 500. But in my opinion, technical conditions have been evolving for weeks to support a rebound. I highlighted here how 2025 was primed for a good start based on positive breadth divergences and bearish investor sentiment. Not only did breadth divergences become incrementally more positive as January progressed, but sentiment became a larger tailwind as well. The chart below shows the spread between bulls and bears from the AAII survey of retail investors. Last week, the spread hit the lowest levels in over a year.

Just as investor sentiment reached extremely bearish levels, several signs emerged that the average stock was outpacing the indexes. I noted frequently over the past two weeks the improvement in stocks trading above their 20-day moving average even as the S&P 500 was pulling back. The combination of improving breadth and bearish sentiment led to a rebound that was historically positive by one measure. The chart below shows the number of consecutive days with more than 68% of the S&P 500 advancing. At five consecutive days, that tied the record going back to 1928.

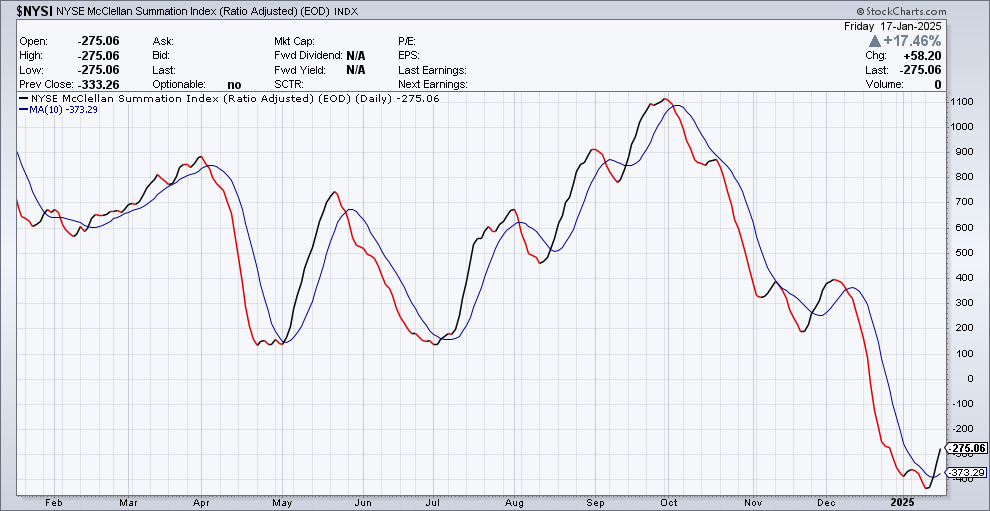
The improvement in the average stock is triggering buy signals among some breadth signals. The chart below shows the NYSE McClellan Summation Index. The Summation Index is cumulative value of the oscillator, which measures advancing versus declining stocks on the NYSE over a trailing period. The Summation Index is crossing above the 10-day moving average for the first time in a month.
While concerns around inflation and the ongoing strength of the labor market is weighing on the interest rate outlook and equity prices over the past month, it’s serving as a positive catalyst for the commodity trade. Commodities are the best performing asset class during periods of high and rising inflation. You can see in the chart below that a broad commodities ETF has rallied back toward the high end of the trading range stretching back over two years. A breakout higher from the range would be another signal inflation could be growing issue facing investors and the economy over the coming year.

Mosaic Tidbits
Here are a few of my recent posts that are still impactful and relevant to the stock market’s next move:
The S&P 500 pulled back following the most recent jobs report. Investors are concerned that a strong labor market means that there are fewer interest rate cuts in store by the Federal Reserve this year. But good news for the economy is usually good news for stocks.
Leading indicators for inflation suggests an acceleration is in store. That includes the prices paid component from a report measuring service sector activity and consumers’ inflation expectations.
My 2025 outlook video outlines three catalysts that can keep the bull market charging higher. That includes the global liquidity upswing, decade cycle seasonality, and ongoing corporate earnings growth.
Santa Claus didn't show up for the S&P 500 at the end of last year. But that wasn’t the case for other market capitalizations. Here’s why improving breadth can get the stock market off to a bullish start in 2025.
Heard in the Hub
The Traders Hub features live trade alerts, frequent market update videos, and other educational content for members.
Here’s a quick recap of recent alerts, market updates, and educational posts:
Adapting a trading approach when volatility picks up.
The key level on inflation that matters most for retirement portfolios.
How to combine the MACD with DMI/ADX to spot trend-ready breakouts.
Our most recent addition to the model portfolio is gaining following earnings.
You can follow everything we’re trading and tracking by starting a 7-day free trial here. By starting a trial, you will unlock all content and reports created exclusively for members.
Chart Idea
Alphabet Inc (GOOG)
The stock is creating a base-on-base pattern after breaking out over $190 in mid-December. A new resistance level at $200 has been tested several times since then. I want to see price keep trading in a tight sideways range that resets the MACD at zero before breaking out over $200.

I hope you’ve enjoyed The Market Mosaic, and please share this report with your family, friends, coworkers…or anyone that would benefit from an objective look at the stock market.
Become a member of the Traders Hub to unlock access to:
✅Model Portfolio
✅Members Only Chat
✅Trade Ideas & Live Alerts
✅Mosaic Vision Market Updates + More
Our model portfolio is built using a “core and explore” approach, including a Stock Trading Portfolio and ETF Investment Portfolio. Come join us over at the Hub as we seek to capitalize on stocks and ETFs that are breaking out!
And if you have any questions or feedback, feel free to shoot me an email at mosaicassetco@gmail.com
Disclaimer: these are not recommendations and just my thoughts and opinions…do your own due diligence! I may hold a position in the securities mentioned in this report.