The Market Mosaic 11.3.24
3 charts to navigate the election and Fed meeting.
Welcome back to The Market Mosaic, where I gauge the stock market’s next move by looking at macro, technicals, and market internals. I’ll also highlight trade ideas using this analysis.
If you find this content helpful please hit that “like” button, share this post, and become a subscriber if you haven’t already done so!
And be sure to check out Mosaic Chart Alerts. It’s a midweek update covering chart setups among long and short trade ideas in the stock market, along with levels I’m watching.
Now for this week’s issue…
A huge week ahead is waiting for investors, but recent polling data and economic reports are making it difficult to predict outcomes.
Tuesday’s general election features contests spanning federal, state, and local officials. Attention will be fixated on the presidential contest, where various polls shows a tight race. Whoever ends up winning, both candidates are promising more spending at a time when federal expenditures are already running at a high rate.
Last week’s initial look at third quarter GDP showed 2.8% annualized real growth during the quarter. While the consumer spending component remains strong with a gain of 3.7%, government spending also increased at a 5% annualized pace.
Under current proposals from both Trump and Harris, federal spending looks set to accelerate further. The chart below projects the spending impact under plans from both presidential candidates, along with forecasted deficit and debt levels versus the current baseline.
And while the dust is settling on elections and potential impact to the economy, the Federal Reserve will be concluding their next rate setting meeting. After surprising investors with a 0.50% rate cut in September, recent strength in economic data is raising questions over how quickly the Fed can keep reducing rates.
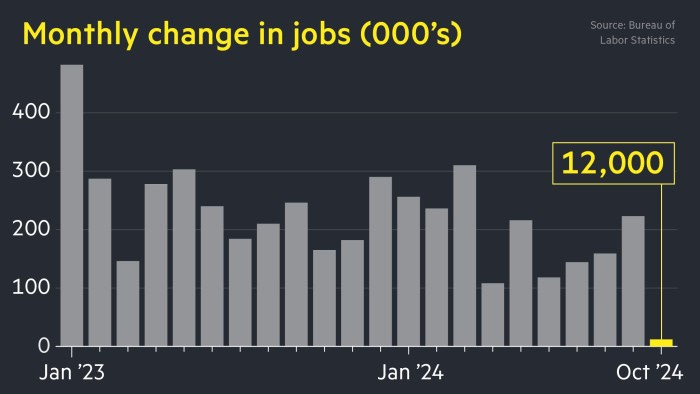
But then the October payrolls report delivered a downside labor market surprise. There were only 12,000 jobs created during the month (chart below) versus expectations for 100,000. That’s the fewest since December 2020.
While the jobs figure was distorted by the impact of hurricanes last month and a large strike at Boeing, it’s worth noting that the prior two months saw job gains revised lower by 112,000. The Fed made it clear that maintaining strength in the labor market is taking precedent over fighting inflation.
Investors are facing an uncertain week ahead. But instead of guessing how markets will respond, I’m watching key chart developments around the week’s events. Here’s what I’m watching for clues on how the stock market and economy will react to the election outcome and Fed meeting.
3 Charts to Navigate the Week Ahead
The week ahead will feature plenty of events to drive volatility (vol), with vol markets being at the top of my list to monitor the near-term impact on the stock market.
That’s because of the popularity of institutional strategies that utilize risk parity and volatility targeting. These portfolio strategies target a constant volatility level (think of it as a risk budget), so when vol is increasing these strategies tend to sell equities.
High and low vol regimes create a feedback loop to drive stocks in either direction. Since vol levels rise when equities are selling off, selling pressure can then push volatility even higher and create a negative feedback loop for stock prices.
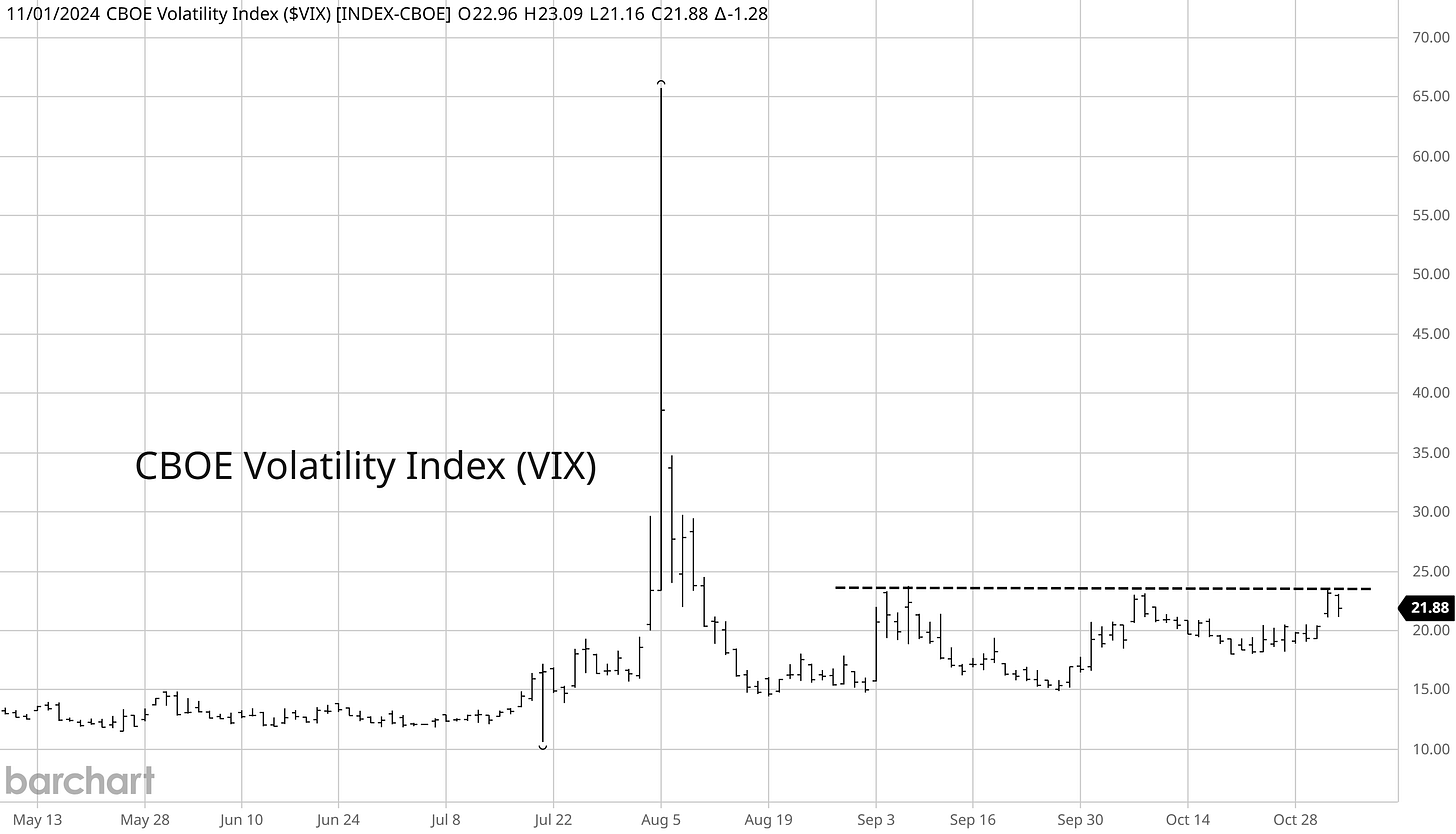
The CBOE Volatility Index (VIX) measures implied volatility for the S&P 500 in the chart below. You can see that the VIX surged into the early August selloff in global equities, then saw a mean reversion move lower.
But we now have new levels to watch. The average VIX value since its inception is just below the 20 level. On three instances since early September, the VIX has tested the 22-23 level at the dashed line, with the most recent test happening last week.
VIX is still hovering just below that level. No matter what happens next week, a jump in VIX above 23 could fuel further selling pressure by vol targeting strategies. Alternatively, a move back below the long-term average would signal calm and could draw fund flows into the market.
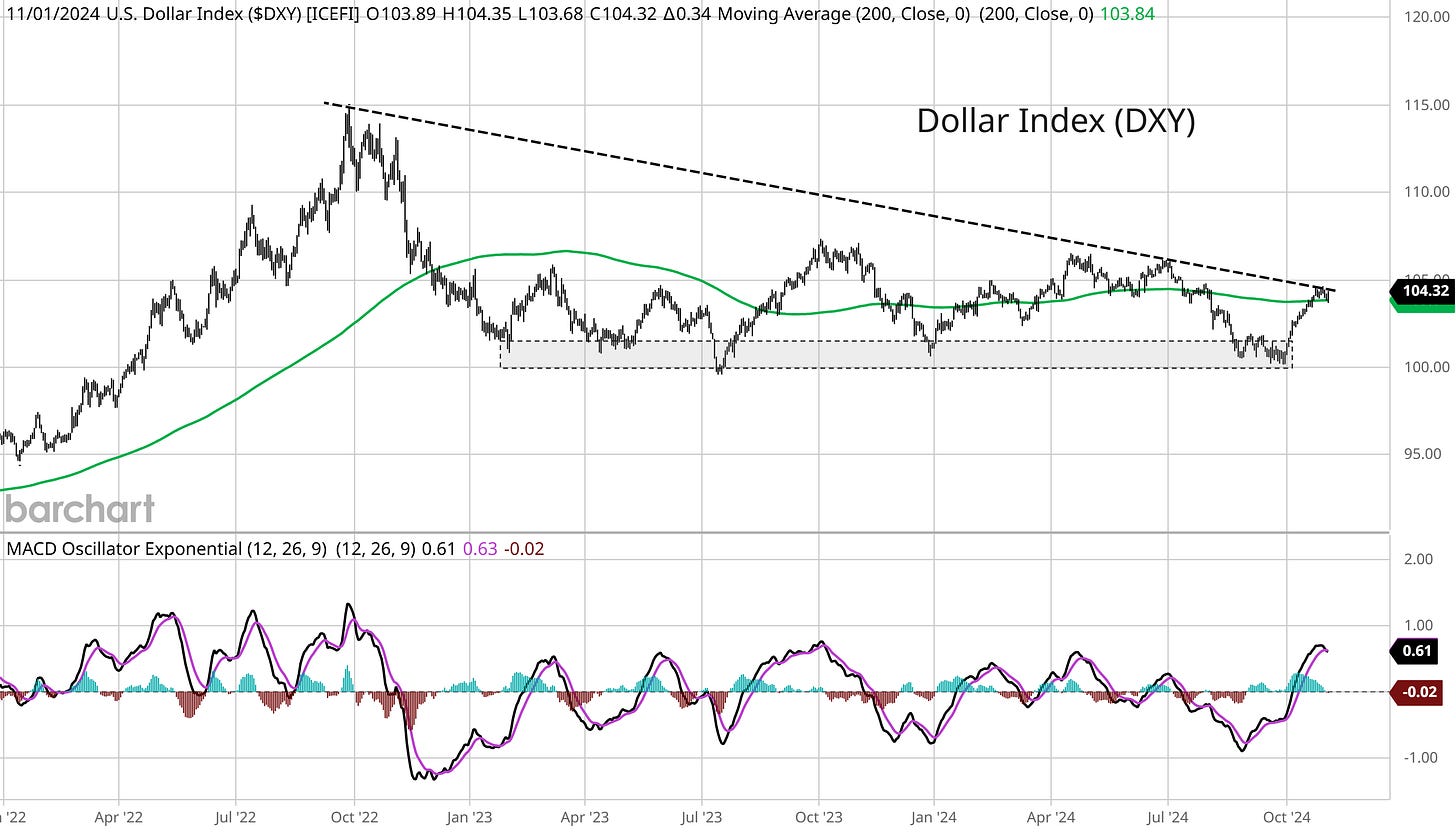
I’m also watching the action in the U.S. Dollar Index (DXY). That’s because DXY is bouncing off a key level yet again, but is now encountering several areas of resistance as you can see in the chart below. That includes trendline resistance off the 2022 peak, and the 200-day moving average (MA - green line).
The reaction to elections could drive a breakout or breakdown in DXY. If the dollar turns back lower at resistance, I believe that’s supportive of risk assets in the near-term. A weaker dollar helps the corporate earnings outlook (since foreign sales and earnings become worth more in dollar terms). A weaker dollar is also supportive for commodities that are often priced and traded in U.S. dollars.
Should the dollar fall enough to finally break support at the 100 level, I believe that would be a significant “risk-on” catalyst in the near-term. But longer-term, sustained weakness in DXY could reflect concerns over deficit spending and debt levels in the U.S. (I’ll have more on this in a future report).
Finally, I’m watching the action in the 2-year Treasury yield for clues on where monetary policy could be heading. That’s because the 2-year often leads changes in the fed funds rate as you can see in the chart below.
It can be tough at times to decipher and decode the message coming from central bankers. Following the 2-year Treasury yield can help gain clarity on the forward path of monetary policy. If the 2-year keeps closing in on the fed funds rate, that signals limited scope for the Fed to keep cutting interest rates.
Instead of guessing how markets will respond to major catalysts coming up this week, I’m following charts from different corners of the capital markets to interpret and gauge the market’s reaction to the election and Fed meeting.
Now What…
Following the most recent report, annualized GDP growth has held above 2.5% for six straight quarters. That’s the longest streak since 2006. And while October’s payrolls report was surprisingly weak, so far it’s not being confirmed initial jobless claims that fell to a five-month low last week (orange line in the chart below).
Those are lagging or coincident indicators of the economy at best, which is why the recent action in high yield spreads is encouraging as well. Companies issuing high yield debt are of lower financial quality and at higher risk of defaulting, which makes them sensitive to the economic outlook.
Spreads measure how much companies must pay above a safer fixed income security to borrow. Collectively, rising high yield spreads reflect concerns over the economic outlook and vice versa. And high yield spreads are recently falling toward their lowest level in 17 years as you can see below.
So while there will be lots of noise around the election and Fed meeting, the weight of the evidence points to an economy that’s chugging along just fine. Stocks should ultimately respond favorably if that means the corporate earnings outlook remains intact.
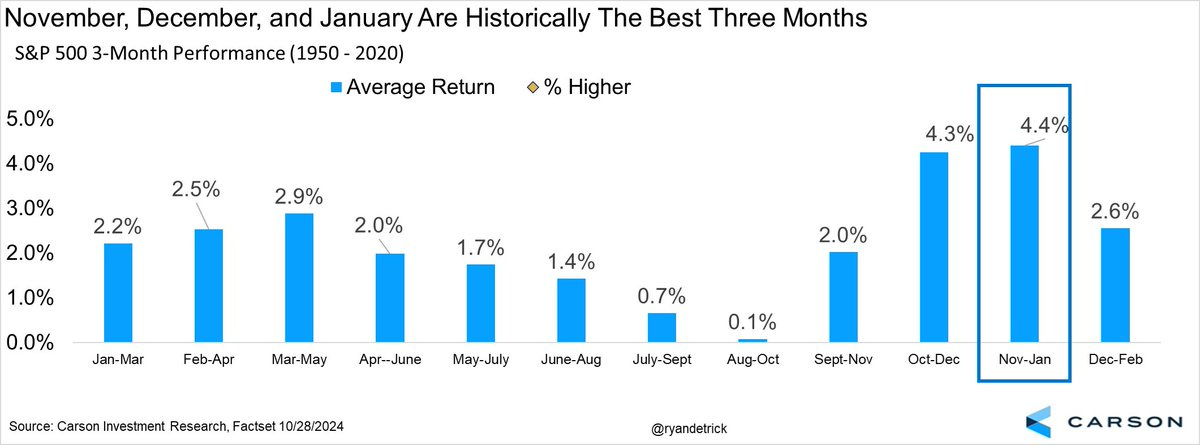
It’s also worth noting that the S&P 500 has just entered its best three month stretch. As you can see below, since 1950 the S&P 500 has averaged a 4.4% return during the three month period starting in November.
No matter what happens over the coming week, my trading plan stays the same. I’m focusing on companies with strong growth fundamentals, and whose stock price is emerging from sound basing patterns. Those patterns should demonstrate accumulation via a series of smaller pullbacks inside the base. Breakouts from those patterns should be on higher volume while showing relative strength.
I’m now releasing model book studies of chart setups for members of the Traders Hub, and I recently covered a prime setup in NVIDIA (NVDA) here. Be on the lookout for another model book study this week.
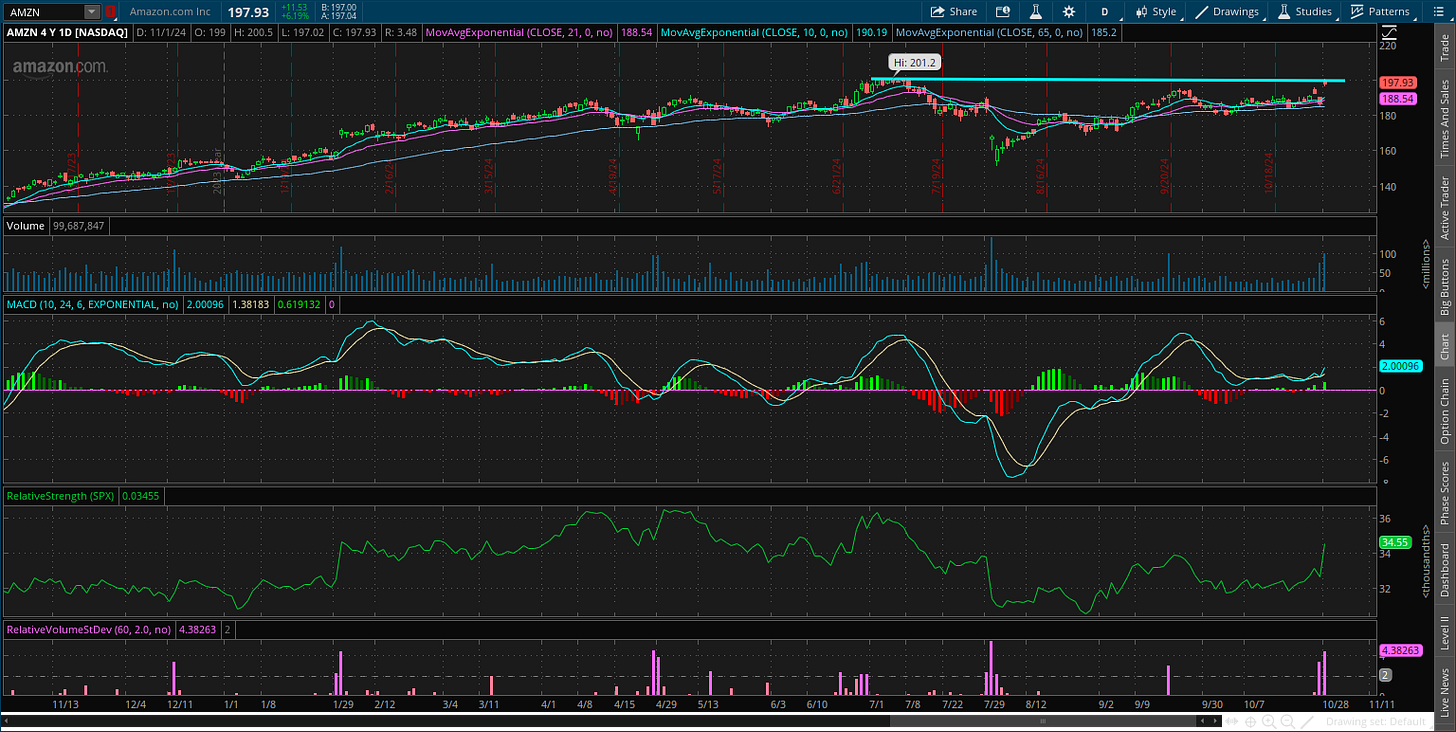
For current setups, I’ll be adding Amazon (AMZN) to Mosaic Chart Alerts for a potential trade. After testing the $200 level back in July, the stock started creating a new basing pattern. AMZN tested resistance again in September and made a smaller pullback. Following earnings last week, the stock is back near the key breakout level.
That’s all for this week. The coming week will be light on economic data, but another 103 companies in the S&P 500 are scheduled to report earnings. While attention will be fixated on election outcomes and the latest Fed meeting, I’ll be monitoring key chart levels shared above.
I hope you’ve enjoyed The Market Mosaic, and please share this report with your family, friends, coworkers…or anyone that would benefit from an objective look at the stock market.
And become a member of the Traders Hub to unlock access to:
✅Model Portfolio
✅Members Only Chat
✅Mosaic Chart Alerts
✅Trade Ideas & Live Alerts
✅Mosaic Vision Market Updates + More
Our model portfolio of open positions currently features three stocks still near their buy points!
And if you have any questions or feedback, feel free to shoot me an email at mosaicassetco@gmail.com
Disclaimer: these are not recommendations and just my thoughts and opinions…do your own due diligence! I may hold a position in the securities mentioned in this report.


