
The Market Mosaic 11.2.25
Bullish Momentum Fueled by Earnings Surprises and Robust Seasonal Trends.

👋Welcome back to The Market Mosaic, where I gauge the stock market’s next move by looking at macro, technicals, and market internals. I’ll also highlight trade ideas using this analysis.
If you find this report helpful please hit that “like” button, share this post, and become a subscriber if you haven’t already done so!
🚨And be sure to check out Mosaic Traders Hub. It’s a members-only platform to alert trade ideas, track a model portfolio of open positions, and further analyze the message coming from the capital markets (👇be sure to check out our special offer below).
Now for this week’s issue…
While the Federal Reserve cut interest rates by a quarter point as widely expected, investors were caught by surprise regarding the outlook for additional rate cuts.
Fed Chair Jerome Powell noted that another rate cut in December is “not a forgone conclusion” as deep divisions remain over the pace of easing. Core consumer inflation continues running at 3%, which is well above the Fed’s 2% inflation target.
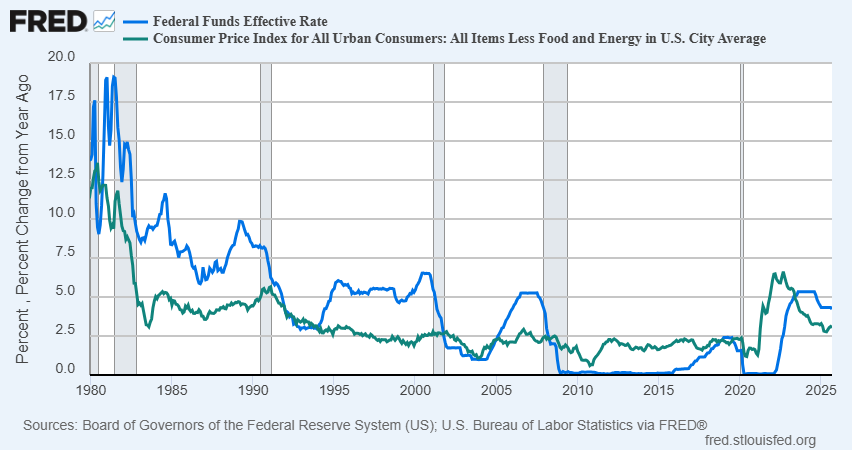
You could argue that the current level of the short-term fed funds rate is in neutral territory. Looking back, fed funds has been around 100 basis points higher than consumer inflation on average. The chart below compares fed funds (blue line) to the core Consumer Price Index (green line) going back to 1980.
At the same time that inflation is running well above target, there’s evidence that the economy is holding up fine. Even the Fed meeting statement added language noting that “economic activity has been expanding at a moderate pace.”
That has investors repricing the outlook for additional rate cuts. Market-implied odds for another cut at the Fed’s last meeting of 2025 in December stood at 92% last week. Following Powell’s comments, those odds are now down to 63%.
Despite the uncertainty over the pace and magnitude of further rate cuts, tailwinds remain in place for the bull market. During their meeting last week, the Fed also announced that quantitative tightening (QT) will end in December.
That’s the process by which the Fed allowed government debt securities held on the balance sheet to mature without reinvesting. That’s shrunk the Fed’s balance sheet from a peak of nearly $9 trillion in 2022 to $6.5 trillion now.
Ending QT removes a key source of financial market liquidity drain. At the same time, earnings season is showcasing higher than average beats across both sales and earnings and the S&P 500 is entering a favorable seasonal stretch despite already spending 125 consecutive days above its 50-day moving average.
This week, lets unpack what earnings season says about the state of the economy as the government shutdown drags on. We’ll also look at the period of strong seasonality incoming for the S&P 500, and various implications of the Fed’s most recent rate-setting meeting.
The Chart Report
As questions swirl over the strength of the economy during the government shutdown that’s limiting economic data releases, the S&P 500 is seeing a historically strong earnings season. At 83%, earning beats are well above the historical average of 74% and is the best showing in four years. The blended earnings growth rate is now running at 10.7% year-over-year, which would mark the fourth consecutive quarter of double-digit earnings growth. In addition, 79% of companies are beating on revenues (chart below containing S&P 500 and sector revenue beats), where manipulating the top line is more difficult compared to net profits. That’s well above the five-year average revenue beat at 70%, and points to a strong economy in the absence of government economic data.

The start of November marks a favorable stretch for equity returns over multiple time periods. November is the single best month for S&P 500 average returns since 1950 and over the past 10 years. The S&P 500 also just recently entered the best stretch for three month forward returns. At the same time, the six month period marking “sell in May and go away” is officially over with the next six months ranking as a top seasonal period. For the S&P 500 using data going back to 1950, you can see in the table below that the S&P averages a 7.1% return with a 77% win rate which beats ever other period shown.

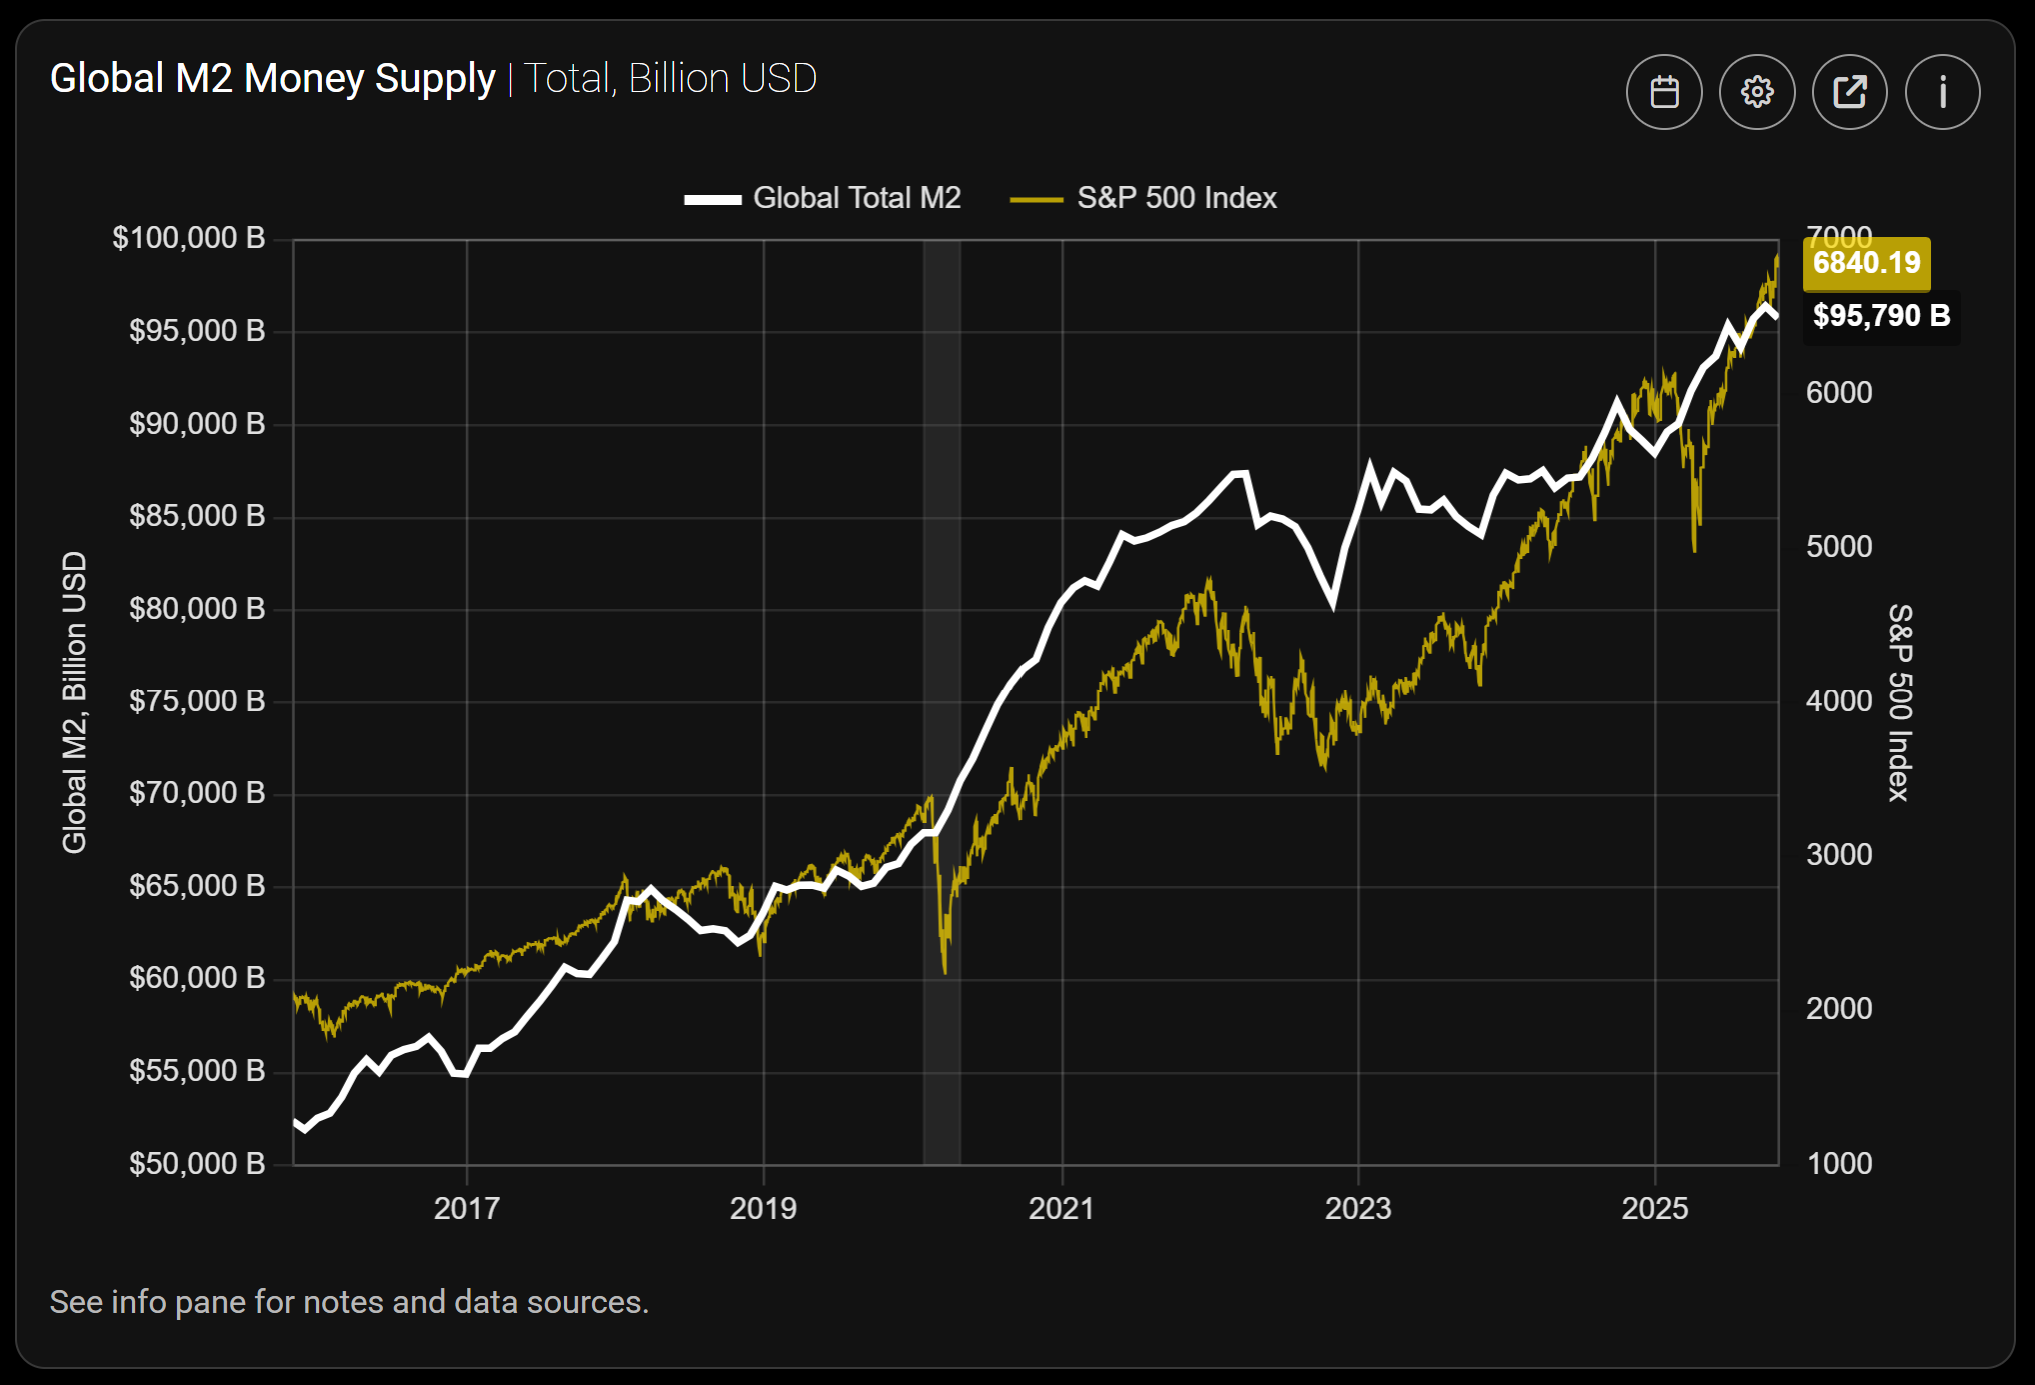
The global liquidity backdrop should remain a tailwind for the bull market heading into next year. The global money supply as indicated by the M2 measure is recently topping historical records at over $95 trillion as you can see in the chart below, which compares total M2 to the S&P 500. You can see the positive correlation between stock prices and liquidity, which is a boost to financial assets. Liquidity also helps keep financial conditions loose, which is supportive of the economy and earnings backdrop. The global liquidity cycle could also receive another boost from the end of the Fed’s quantitative tightening program.
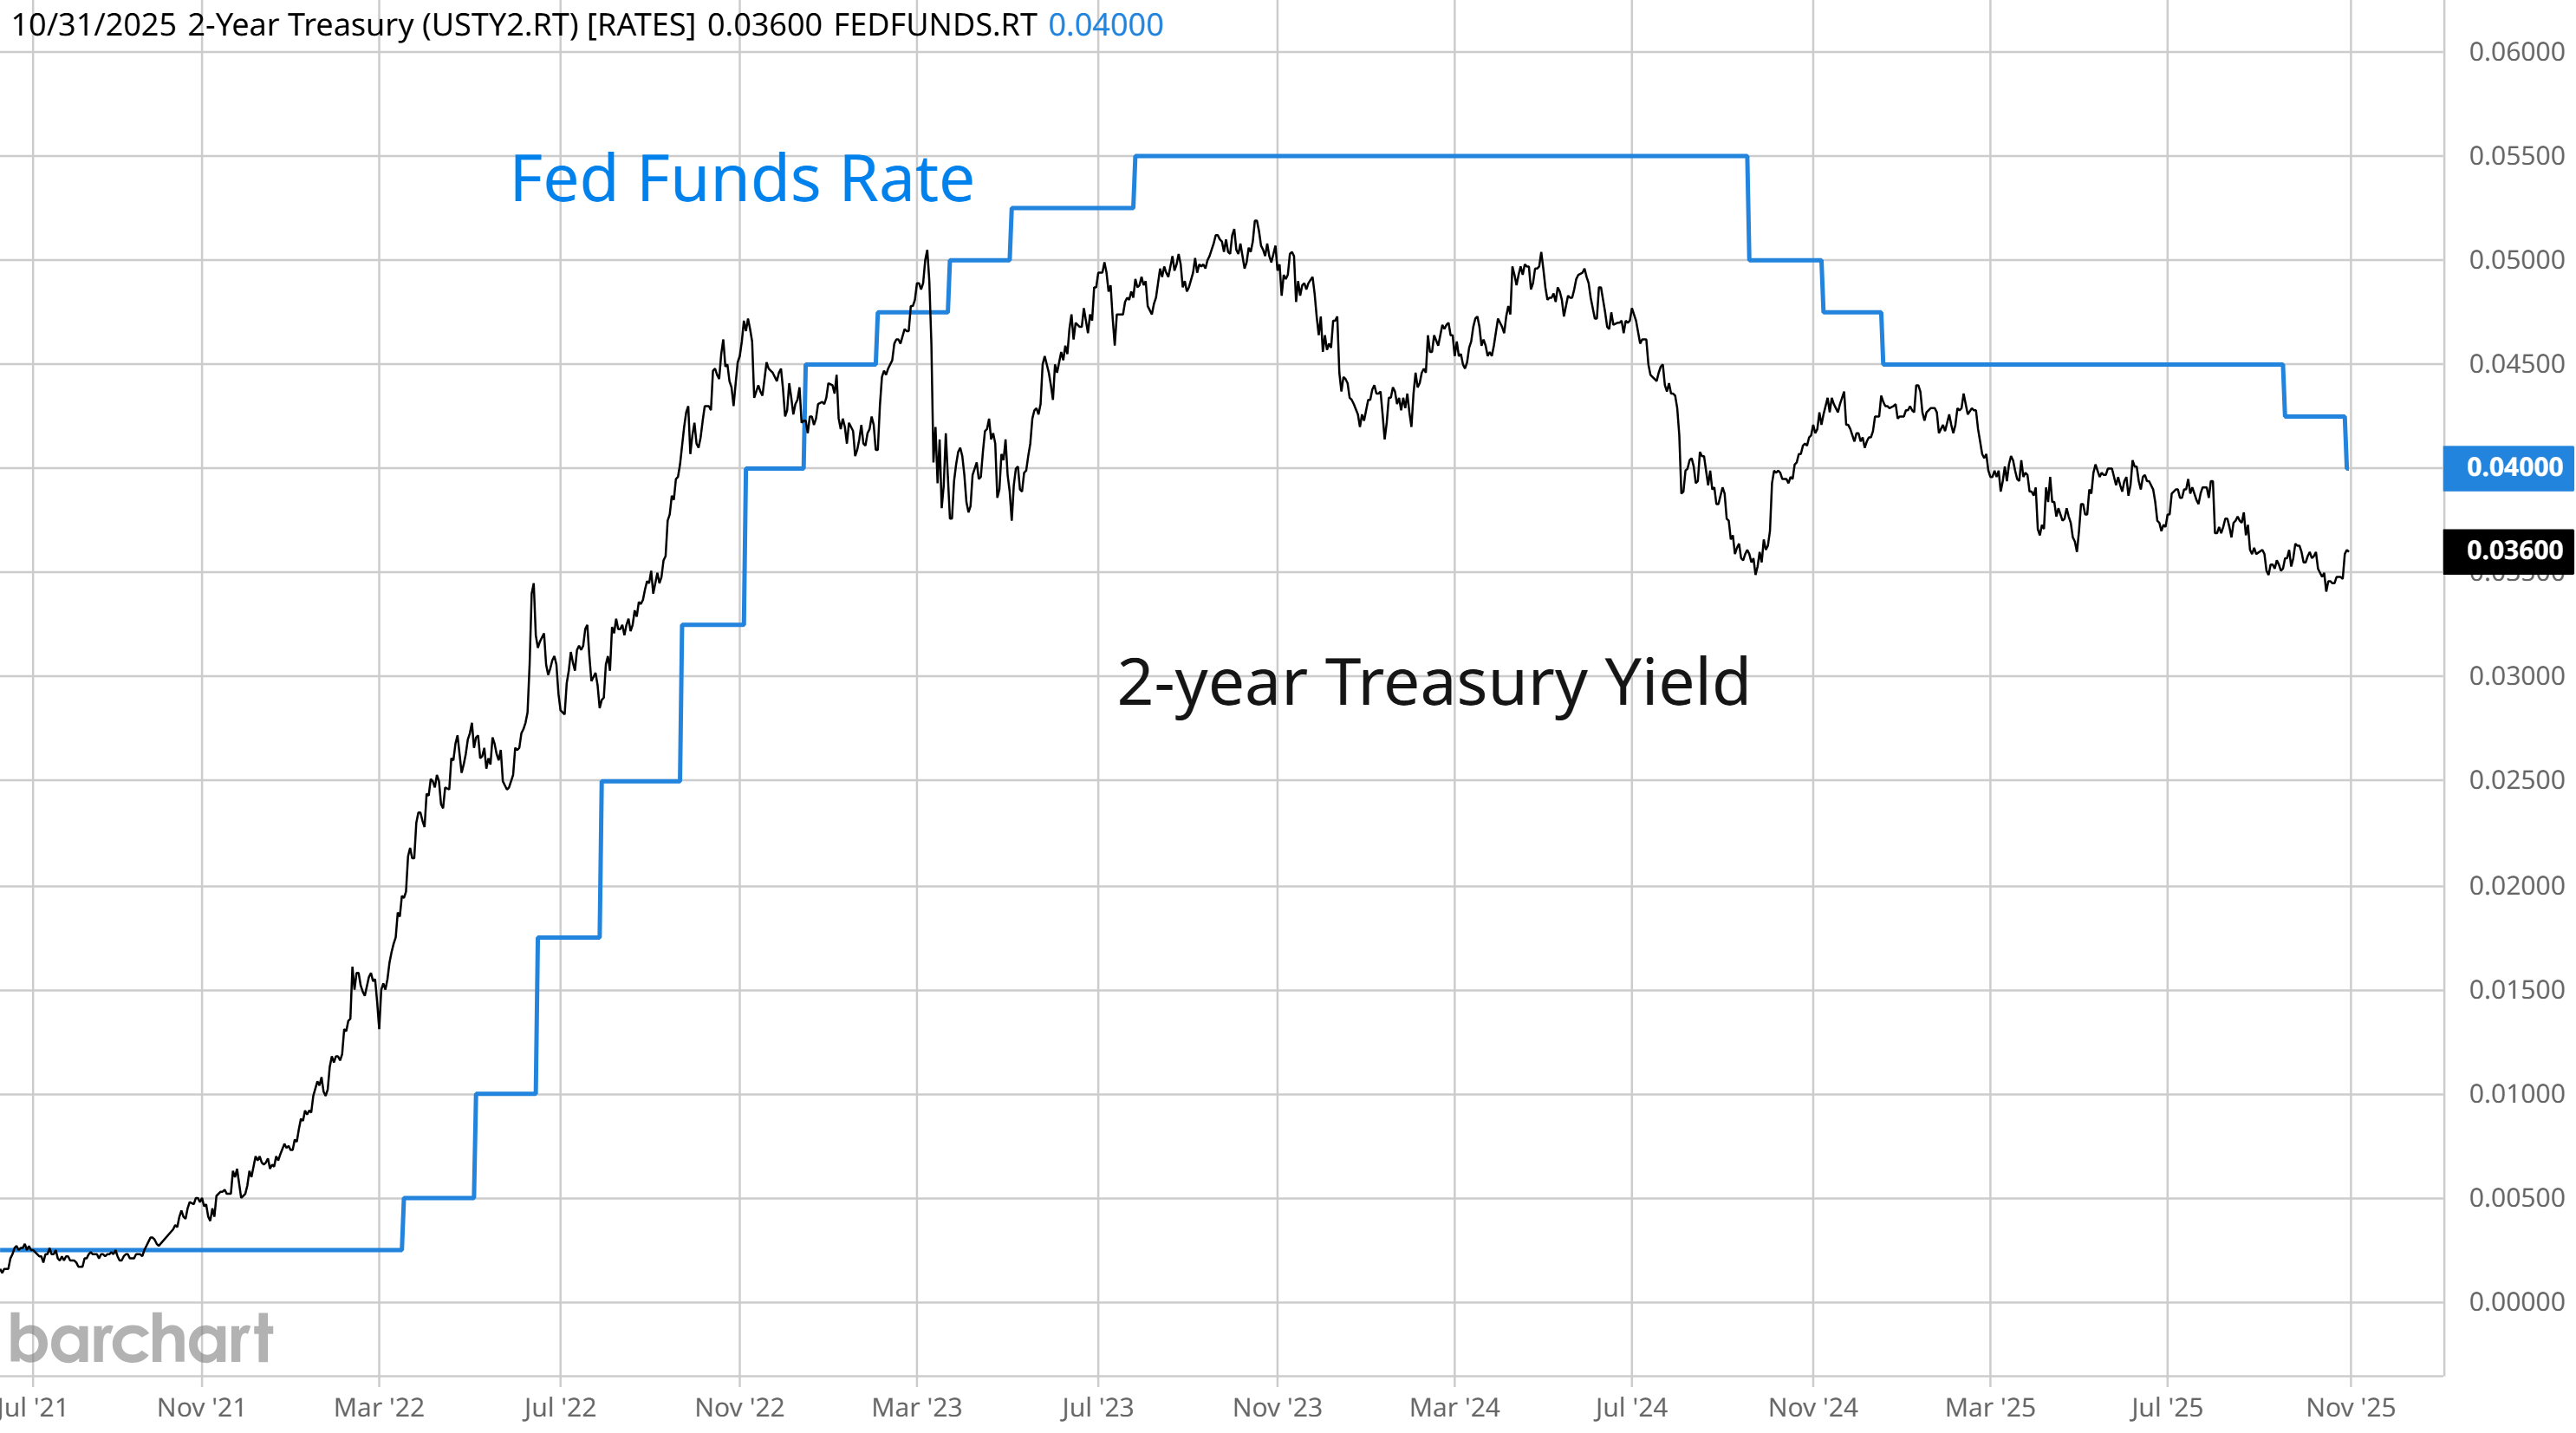
While the dovish aspects of the Fed’s most recent meeting include another rate cut and end to QT, hawkish comments from Powell and changes in the meeting statement has the market repricing the outlook for further rate cuts. I noted the change in market-implied odds above, and would also point to the recent jump in the 2-year Treasury yield. The 2-year yield (black line) tends to lead changes in the fed funds rate (blue line), and now sits just 0.40% below the current level of fed funds. That implies fewer than two quarter point rate cuts in total before the easing cycle is complete.
The Fed reduced rates as widely expected and demands from Trump administration officials are calling for further cuts despite deep divisions emerging within the central bank. The Fed started this easing cycle in late 2024, cutting the fed funds rate by 1.5% since then. But there’s a growing risk that cutting rates at a time when the economy is performing fine will stoke inflation. That could especially be the case if you see a major breakout and commodity prices. There was a surge in commodity prices during the last inflation wave into mid-2022, which coincided with loose monetary policy. The chart below overlays an equal weighted commodities index (white line) with the fed funds rate (red line). Commodities are rallying again ever since the Fed started its most recent easing campaign.

Heard in the Hub
The Traders Hub features live trade alerts, market update videos, and other educational content for members.
Here’s a quick recap of recent alerts, market updates, and educational posts:
Tesla’s textbook chart setup.
Investor positioning could spark oil prices.
What the average stock says about the rally.
The S&P 500 is just entering a seasonal sweet spot.
Focus on these reports during the government shutdown.
You can follow everything we’re trading and tracking by becoming a member of the Traders Hub.
By becoming a member, you will unlock all market updates and trade alerts reserved exclusively for members.
🚨Hub members recently locked in gains of 244.4% and 165.4%. Check out the special offer below to join the Hub today!
👉You can click here to join now👈
Trade Idea
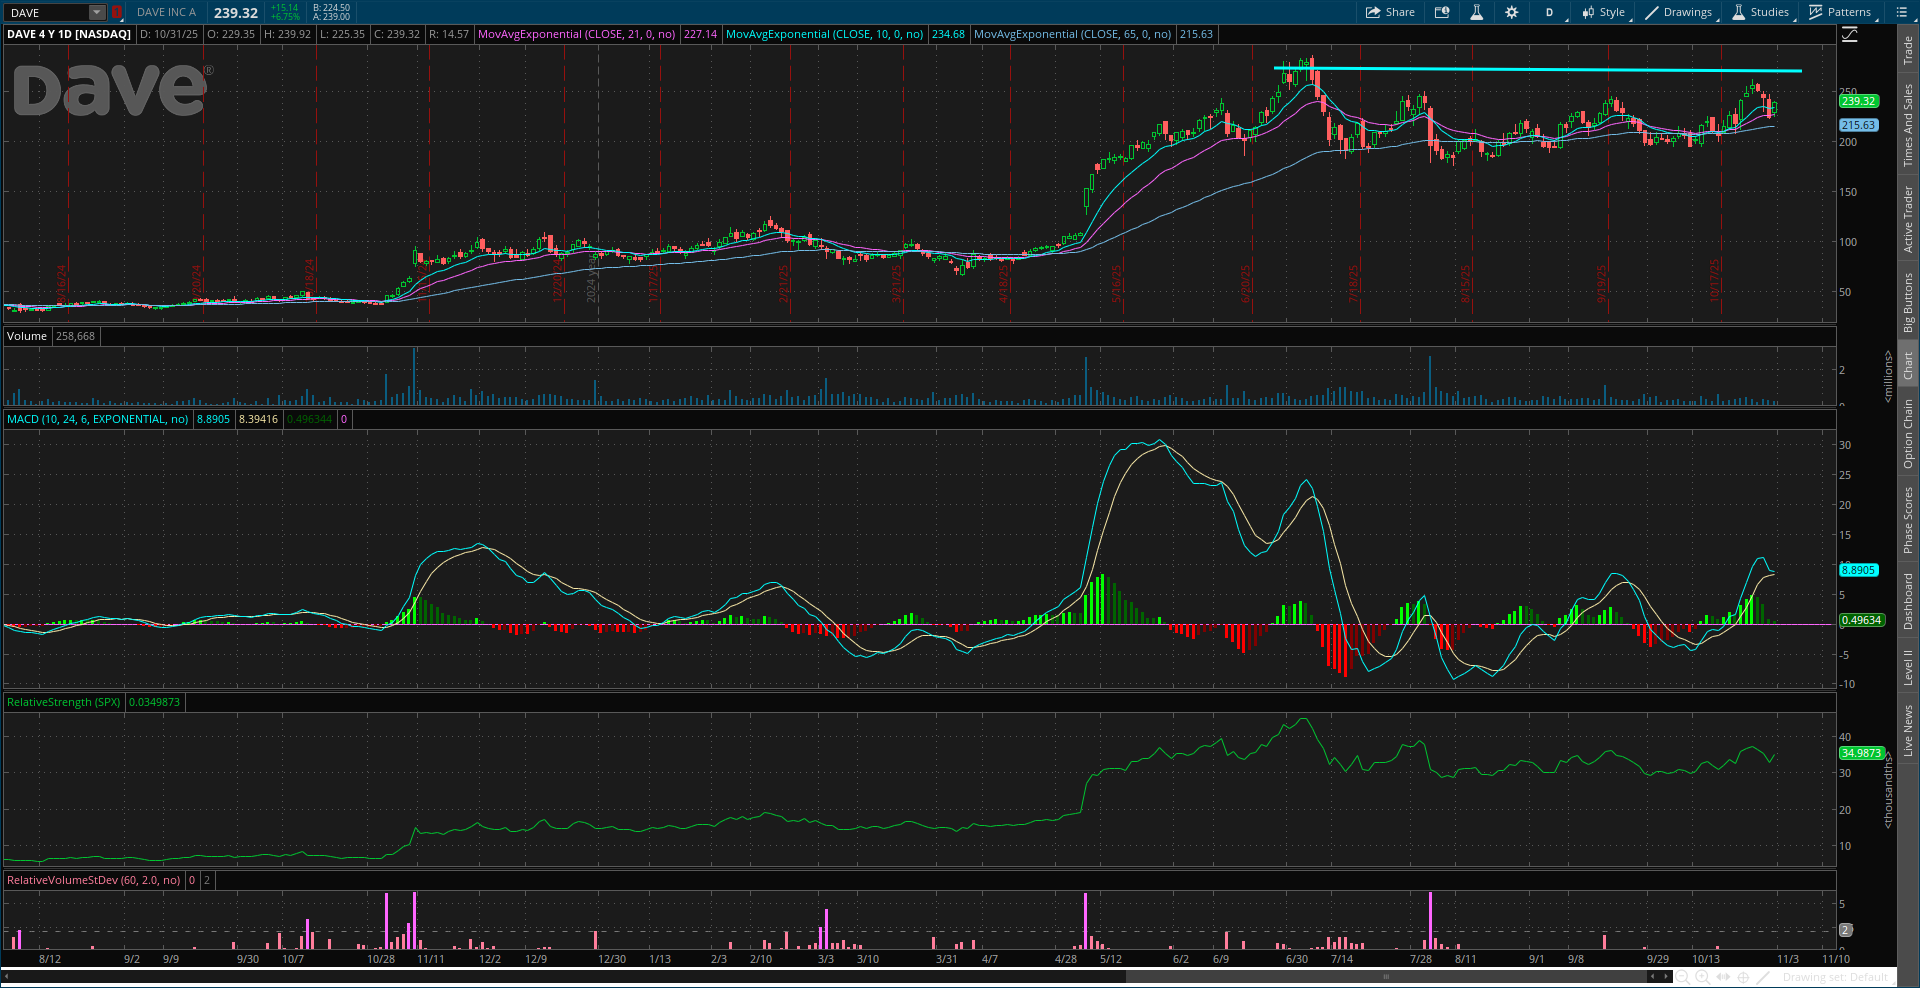
Dave Inc (DAVE)
The stock ran up to the $275 level following a breakout in May. DAVE is rallying toward that area this past week and is making a smaller pullback. I’m watching for that pullback to reset the MACD above zero followed by a breakout.
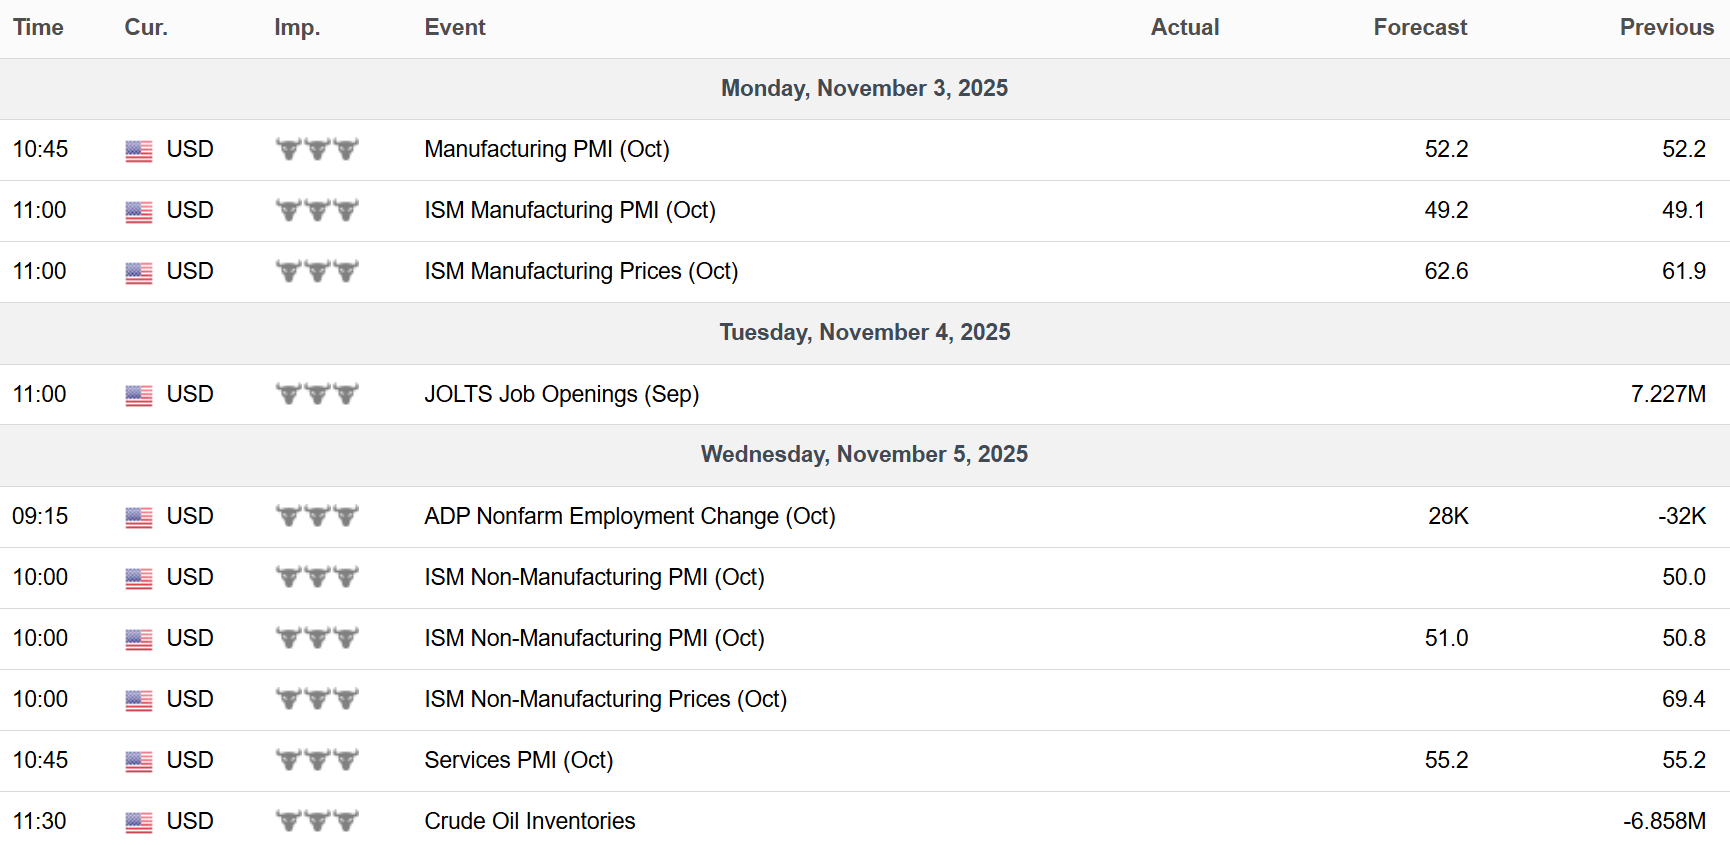
Key Upcoming Data
Economic Reports
Earnings Reports

I hope you’ve enjoyed The Market Mosaic, and please share this report with your family, friends, coworkers…or anyone that would benefit from an objective look at the stock market.
Become a member of the Traders Hub to unlock access to:
✅Model Portfolio
✅Members Only Chat
✅Trade Ideas & Live Alerts
✅Mosaic Vision Market Updates + More
Our model portfolio is built using a “core and explore” approach, including a Stock Trading Portfolio and ETF Investment Portfolio.
Come join us over at the Hub as we seek to capitalize on stocks and ETFs that are breaking out!
And if you have any questions or feedback, feel free to shoot me an email at mosaicassetco@gmail.com
Disclaimer: these are not recommendations and just my thoughts and opinions…do your own due diligence! I may hold a position in the securities mentioned in this report.