The Market Mosaic 11.12.23
Can mega-caps flip the S&P 500's trend?
Welcome back to The Market Mosaic, where I gauge the stock market’s next move by looking at macro, technicals, and market internals. I’ll also highlight trade ideas using this analysis.
If you find this content helpful please hit that “like” button, share this post, and become a subscriber to this always free report if you haven’t already done so!
And be sure to check out Mosaic Chart Alerts. It’s a midweek update covering chart setups among long and short trade ideas in the stock market, along with levels I’m watching.
Now for this week’s issue…
Happy Sunday! This weekend, I’m going to highlight a few of the most important charts I’m watching for the stock market today, and how they are impacting the near-term outlook.
Next, I have a quick summary and links to recent posts that remain impactful for monitoring the capital markets. And after that, you can find a few bonus trade ideas at the end.
Big Picture
The S&P 500 is taking out a key level with Friday’s price action. The index gained 1.5%, sending it to 4415. That’s above gap and price resistance at 4400 (shaded box area), and is solid sign that the S&P is in the process of flipping the trend by taking out that most recent lower high. Now watch for the S&P to keep rallying off the 50-day moving average (MA), with any pullback making a higher low above October’s 4110 level.
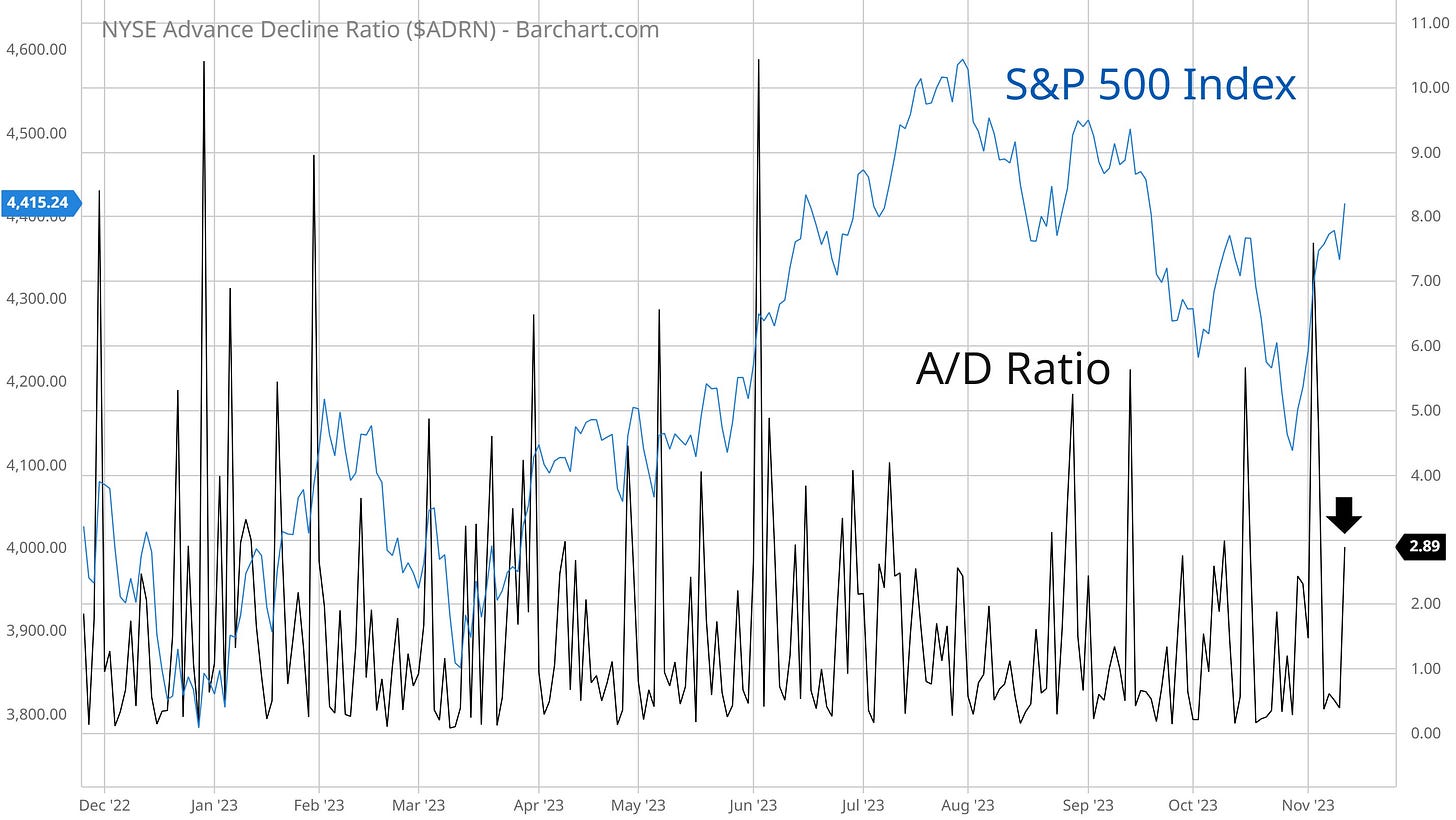
I talked last week about the importance of breath thrusts to confirm the uptrend. While much is being made of the Zweig Breadth Thrust that triggered recently, we haven’t seen similar confirmation in other breadth thrust signals. I monitor the ratio of advancing stocks to declining ones on the NYSE, or the volume ratio as well. Even Friday’s gain in the S&P 500 only saw a 2.9/1 A/D ratio (arrow). We need to see a surge soon, or at least a cluster of stronger figures for signs that institutions are buying this rally.
Another confirmation signal should come from small-cap stocks, but the action here is still cause for concern. During the "easy" trading environments (at least for growth-oriented breakout traders), IWO is in a clear uptrend. That includes years like 2013, 2017, 2020...right now small-cap growth is testing the lows stretching back to 2022’s bear market.
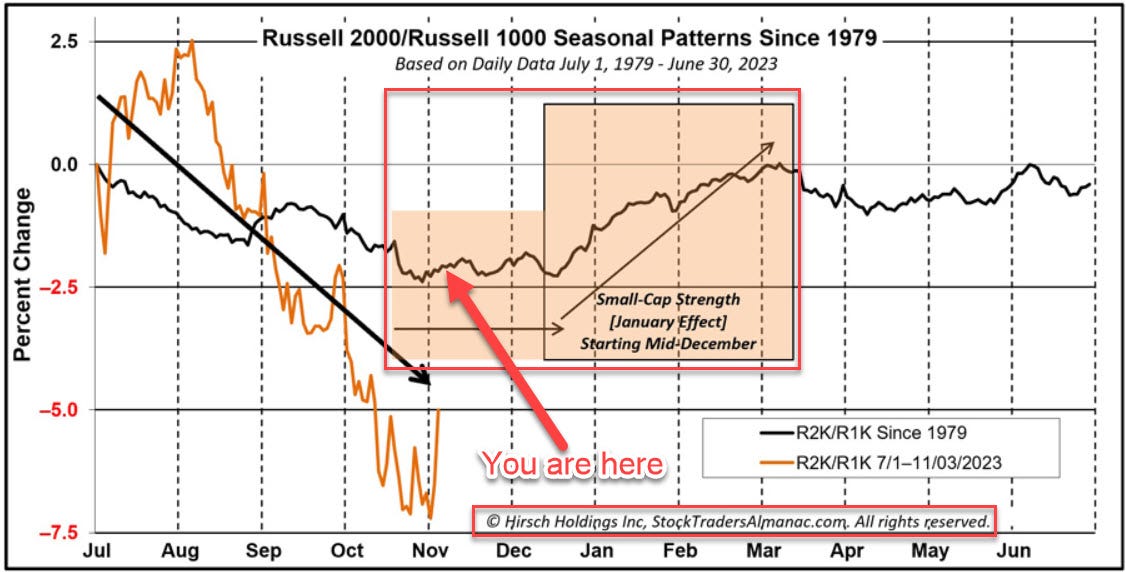
While testing a key level, there may be some precedent that small-caps could rally off support into the start of 2024. The chart below (h/t AlmanacTrader) shows the seasonal pattern of small-caps (Russell 2000) relative to large-caps (Russell 1000). If seasonal trends of the past 40 years hold, then small-caps should trade in line with large-caps into December then take the lead through the first quarter.
If there’s one speculative corner of the market signaling calm, it’s the high yield bond sector. High yield spreads (the compensation high yield investors demand over safer fixed income securities like U.S. Treasuries) have been in a broad downtrend since 2022’s peak in July. And just last week, fund flows into high yield bonds hit the highest in over three years (h/t Daily Chartbook).
Mega-cap stocks could be ready to resume the uptrend. Following the rally to start 2023, the trend in many mega-caps became extended with a mean-reverting move lower commencing. But there are signs that mean-reversion has run its course, and the rally can continue. The weekly Apple chart below shows the mean reverting move in price when the moving average convergence/divergence (MACD - bottom panel) became extended with the arrow. The decline since late July is resetting the MACD at the zero line, which is turning higher last week along with price breaking out from the downtrend resistance line.
Mosaic Tidbits
Here are a few of my recent posts that are still impactful and relevant to the stock market’s next move:
The 7% rally in the S&P 500 off the lows didn’t catch us by surprise. Here’s how I used positive breadth divergences to spot the upside potential before it happened.
If the stock market is going to rollover following the rally from late October, then this would be the spot. A combination of resistance levels and oscillators testing key levels could pressure the index.
No need to overcomplicate things when it comes to trend following. Here are the key price levels to watch for the S&P 500’s trend.
The stock market is hardly efficient, and prices move through stages. Here’s how to track the phase, and why mega-caps could be ready to resume the uptrend.
Chart Updates
As I wrap up my weekly scans, here are a few more trade ideas that I’m monitoring.
AGI
Gold prices are again testing the $2,000 per ounce resistance area for the fourth time since topping out at that level in 2020. If gold prices can breakout, AGI is the top miner on my list. Nice reset of the MACD at the zero line. Watching for a breakout over $13.50 confirmed by the relative strength (RS) line to new highs.
PDD
Building a base on a base after breaking out over the $100 area. Follows a series of higher low going back to May. Now watching for the uptrend to resume with a breakout over $110.
ITT
Industrial stock coming back to test the $100 area, which is resistance going back to late 2021. Watching for a breakout over that level on rising volume and the RS line at a new high. Ideally we see the MACD reset at the zero line before the attempt.
That’s all for now! When stock index futures open later tonight, we’ll see how traders are reacting to Moody’s downgrade of the U.S. credit outlook to “negative” after the close on Friday. The week will also feature the October CPI consumer inflation report, and a heavy lineup of speakers from the Federal Reserve. While there will be plenty of headline volatility, I’ll be watching breadth for clues the rally can continue.
I hope you’ve enjoyed The Market Mosaic, and please share this report with your family, friends, coworkers…or anyone that would benefit from an objective look at the stock market.
And make sure you never miss an edition by subscribing here:
For updated charts, market analysis, and other trade ideas, give me a follow on Twitter: @mosaicassetco
And if you have any questions or feedback, feel free to shoot me an email at mosaicassetco@gmail.com
Disclaimer: these are not recommendations and just my thoughts and opinions…do your own due diligence! I may hold a position in the securities mentioned in this report.


