
The Market Mosaic 10.13.24
The rate outlook won't derail the S&P 500.

Welcome back to The Market Mosaic, where I gauge the stock market’s next move by looking at macro, technicals, and market internals. I’ll also highlight trade ideas using this analysis.
If you find this content helpful please hit that “like” button, share this post, and become a subscriber if you haven’t already done so!
And be sure to check out Mosaic Chart Alerts. It’s a midweek update covering chart setups among long and short trade ideas in the stock market, along with levels I’m watching.
📢Before jumping into today’s report, I recently announced a new premium feature coming to my newsletter: Mosaic Traders Hub🔥
The Hub goes live on 10/28, and you can read all the details of what’s included in the Hub here (plus several new features).
The Hub is a massive expansion of what I cover in The Market Mosaic plus more trade ideas…be sure to reserve your spot before we go live!
Now for this week’s issue…
Recent economic reports spanning the Federal Reserve’s dual mandate is suddenly clouding the interest rate outlook.
Concerns over the strength of the labor market played a big role in the Fed’s pivot toward easing monetary policy and last month’s 0.50% rate cut. But then the September payrolls smashed estimates with a gain of 254,000 jobs during the month along with the unemployment rate falling slightly.
And just last week, reports on both consumer and producer price inflation came in higher than expected. The Consumer Price Index (CPI) gained 2.4% year-over-year for the month of September, while the core measure that strips out food and energy prices jumped by 3.3%.
Although the headline figure was the smallest gain in three years, it’s the core figure that stopped moving lower recently. The core measure accelerated compared to the prior month’s increase. The chart below also shows the breadth of core CPI category gains. About 38% of core categories saw annualized inflation over 4%, which is up from 34%.

A similar trend is emerging with the Producer Price Index (PPI). While the headline figure is trending lower over the last couple of months, the core measure stopped decelerating in July and has moved higher the last two months. The chart below shows the yearly change in core CPI (red line) and PPI (blue line).

A combination of strong labor market reports along with stubbornly high core inflation is calling the interest rate outlook into question. Atlanta Fed President Raphael Bostic even said he’s comfortable skipping a rate cut next month “if the data suggests that’s appropriate.”
Not only has market-implied odds for a larger half point cut at the Fed’s November meeting disappeared (which was 50/50 at one point), but odds are also pricing a small chance of no cut at all (chart below).
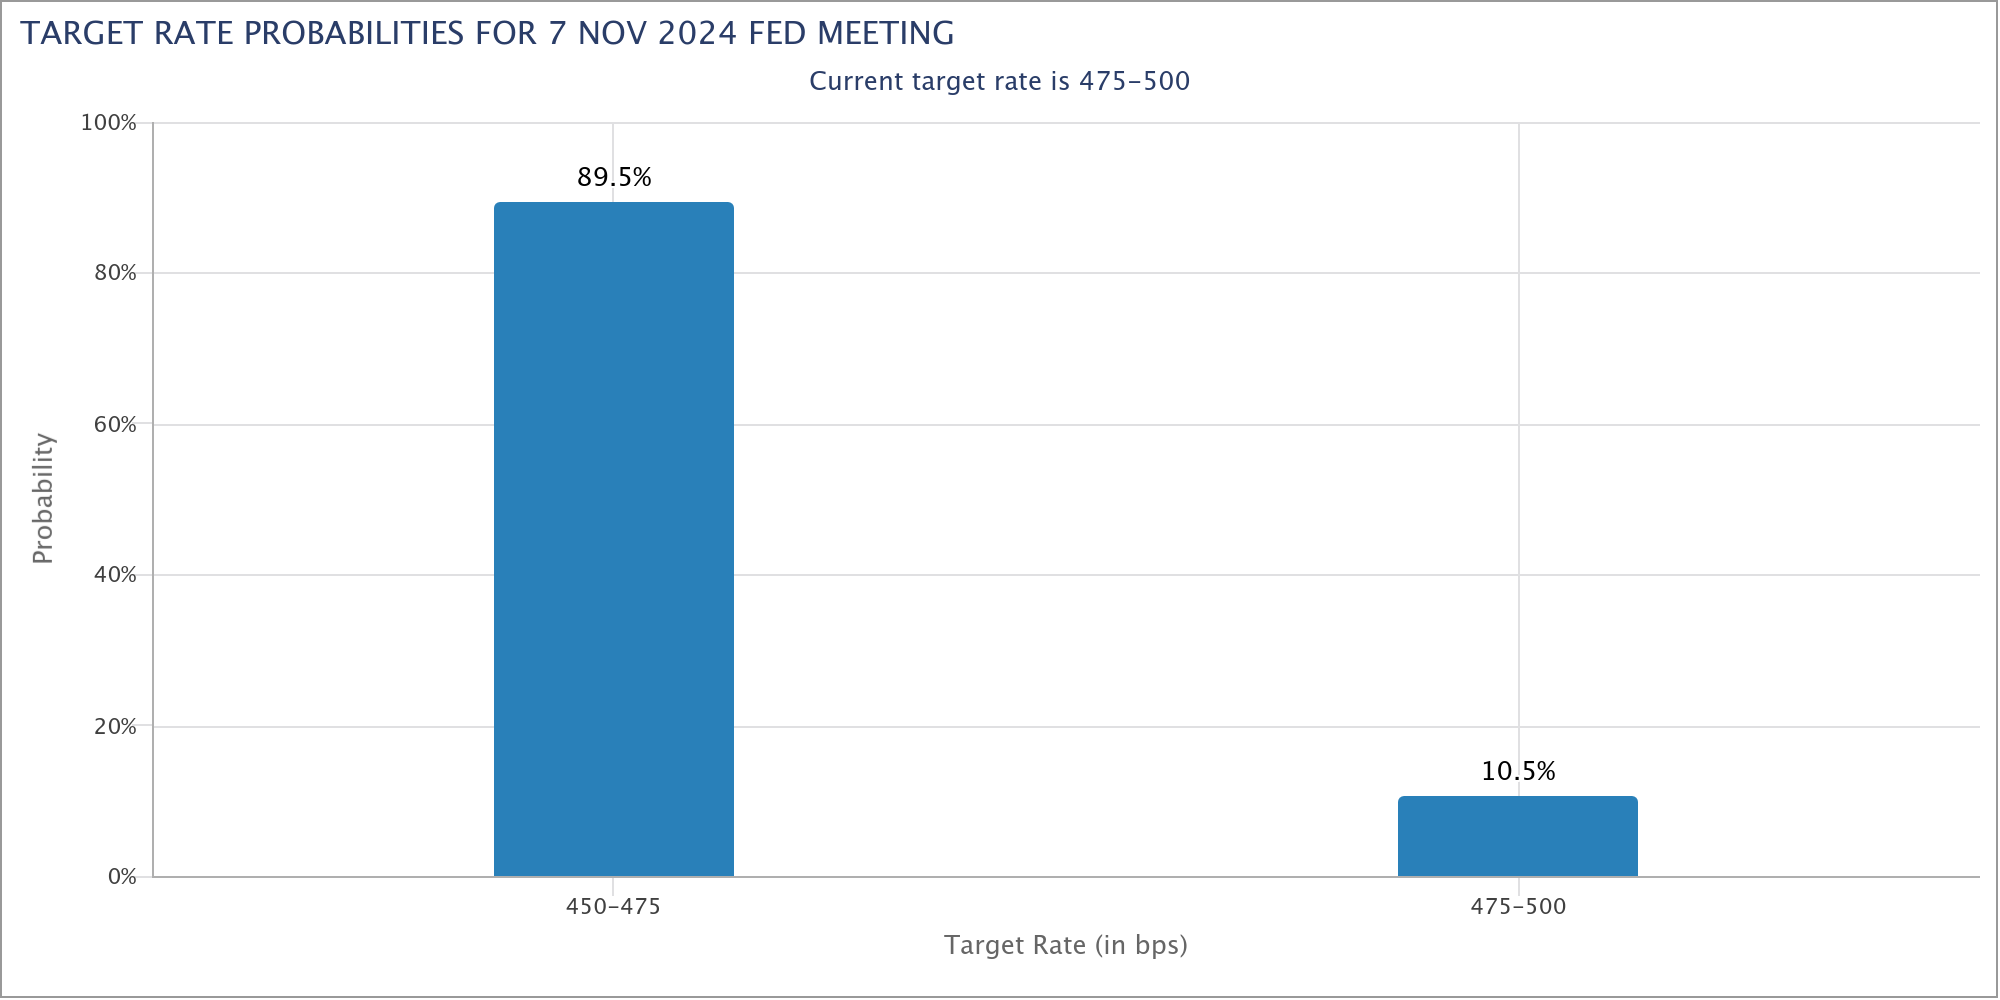
Growing investor optimism around interest rate cuts have a been big driver of the recent rally in the S&P 500. So the concern is that an uncertain outlook for monetary policy could derail the rally.
But the drivers behind the muddled rate outlook are masking key catalysts that can drive the bull market forward. Here are three reasons why the bull market can persist even if the Fed doesn’t reduce rates as much as initially expected.
Stocks Can Shrug Off Rate Concerns
With the Fed relying on data dependency to adjust monetary policy, recent economic data might dampen views on how much and how fast the Fed will cut rates.
But recall that once the Fed starts reducing interest rates, the path of the stock market ultimately comes down to the performance of the economy. That’s because stock prices follow earnings over the long-term.
The Fed has a history of acting too late on monetary policy, with the economy sometimes tipping into recession shortly after an easing cycle. A recessionary backdrop has a negative impact on the earnings picture.
But if the economy avoids recession, then the S&P 500 has responded favorably as you can see in the chart below. The purple line shows the average movement in the S&P 500 before and after rate cuts when the economy avoids a recession, while the orange line is the average when a recession hits.

If anything, recent data on payrolls supports the view that the economy is humming along just fine. That’s also evidenced from the nation’s largest bank. Late last week, an executive on JPMorgan Chases’ earnings call pointed to strength in consumer and corporate lending as being consistent with a “soft landing”.
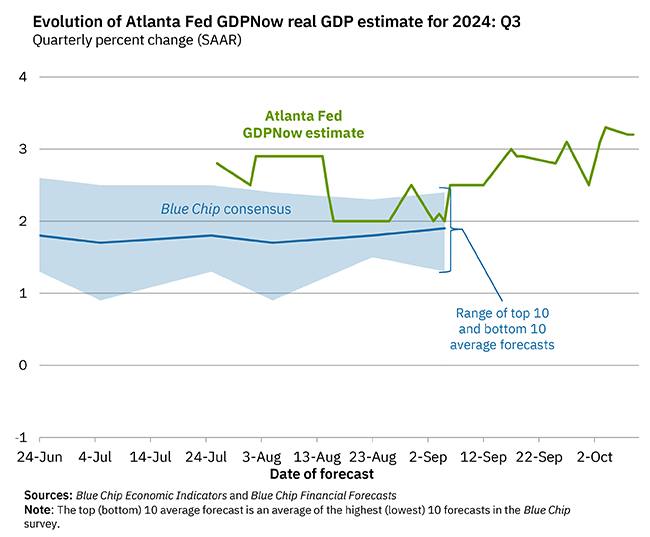
The Fed’s own GDPNow estimates current quarter GDP growth from incoming economic data. The annualized quarterly growth rate now stands at over 3% for the third quarter and is well ahead of estimates as you can see below.
It’s also important to point out that while the pace and magnitude of rate cuts may be called into question, a key leading indicator of monetary policy still suggests more cuts are on the way.
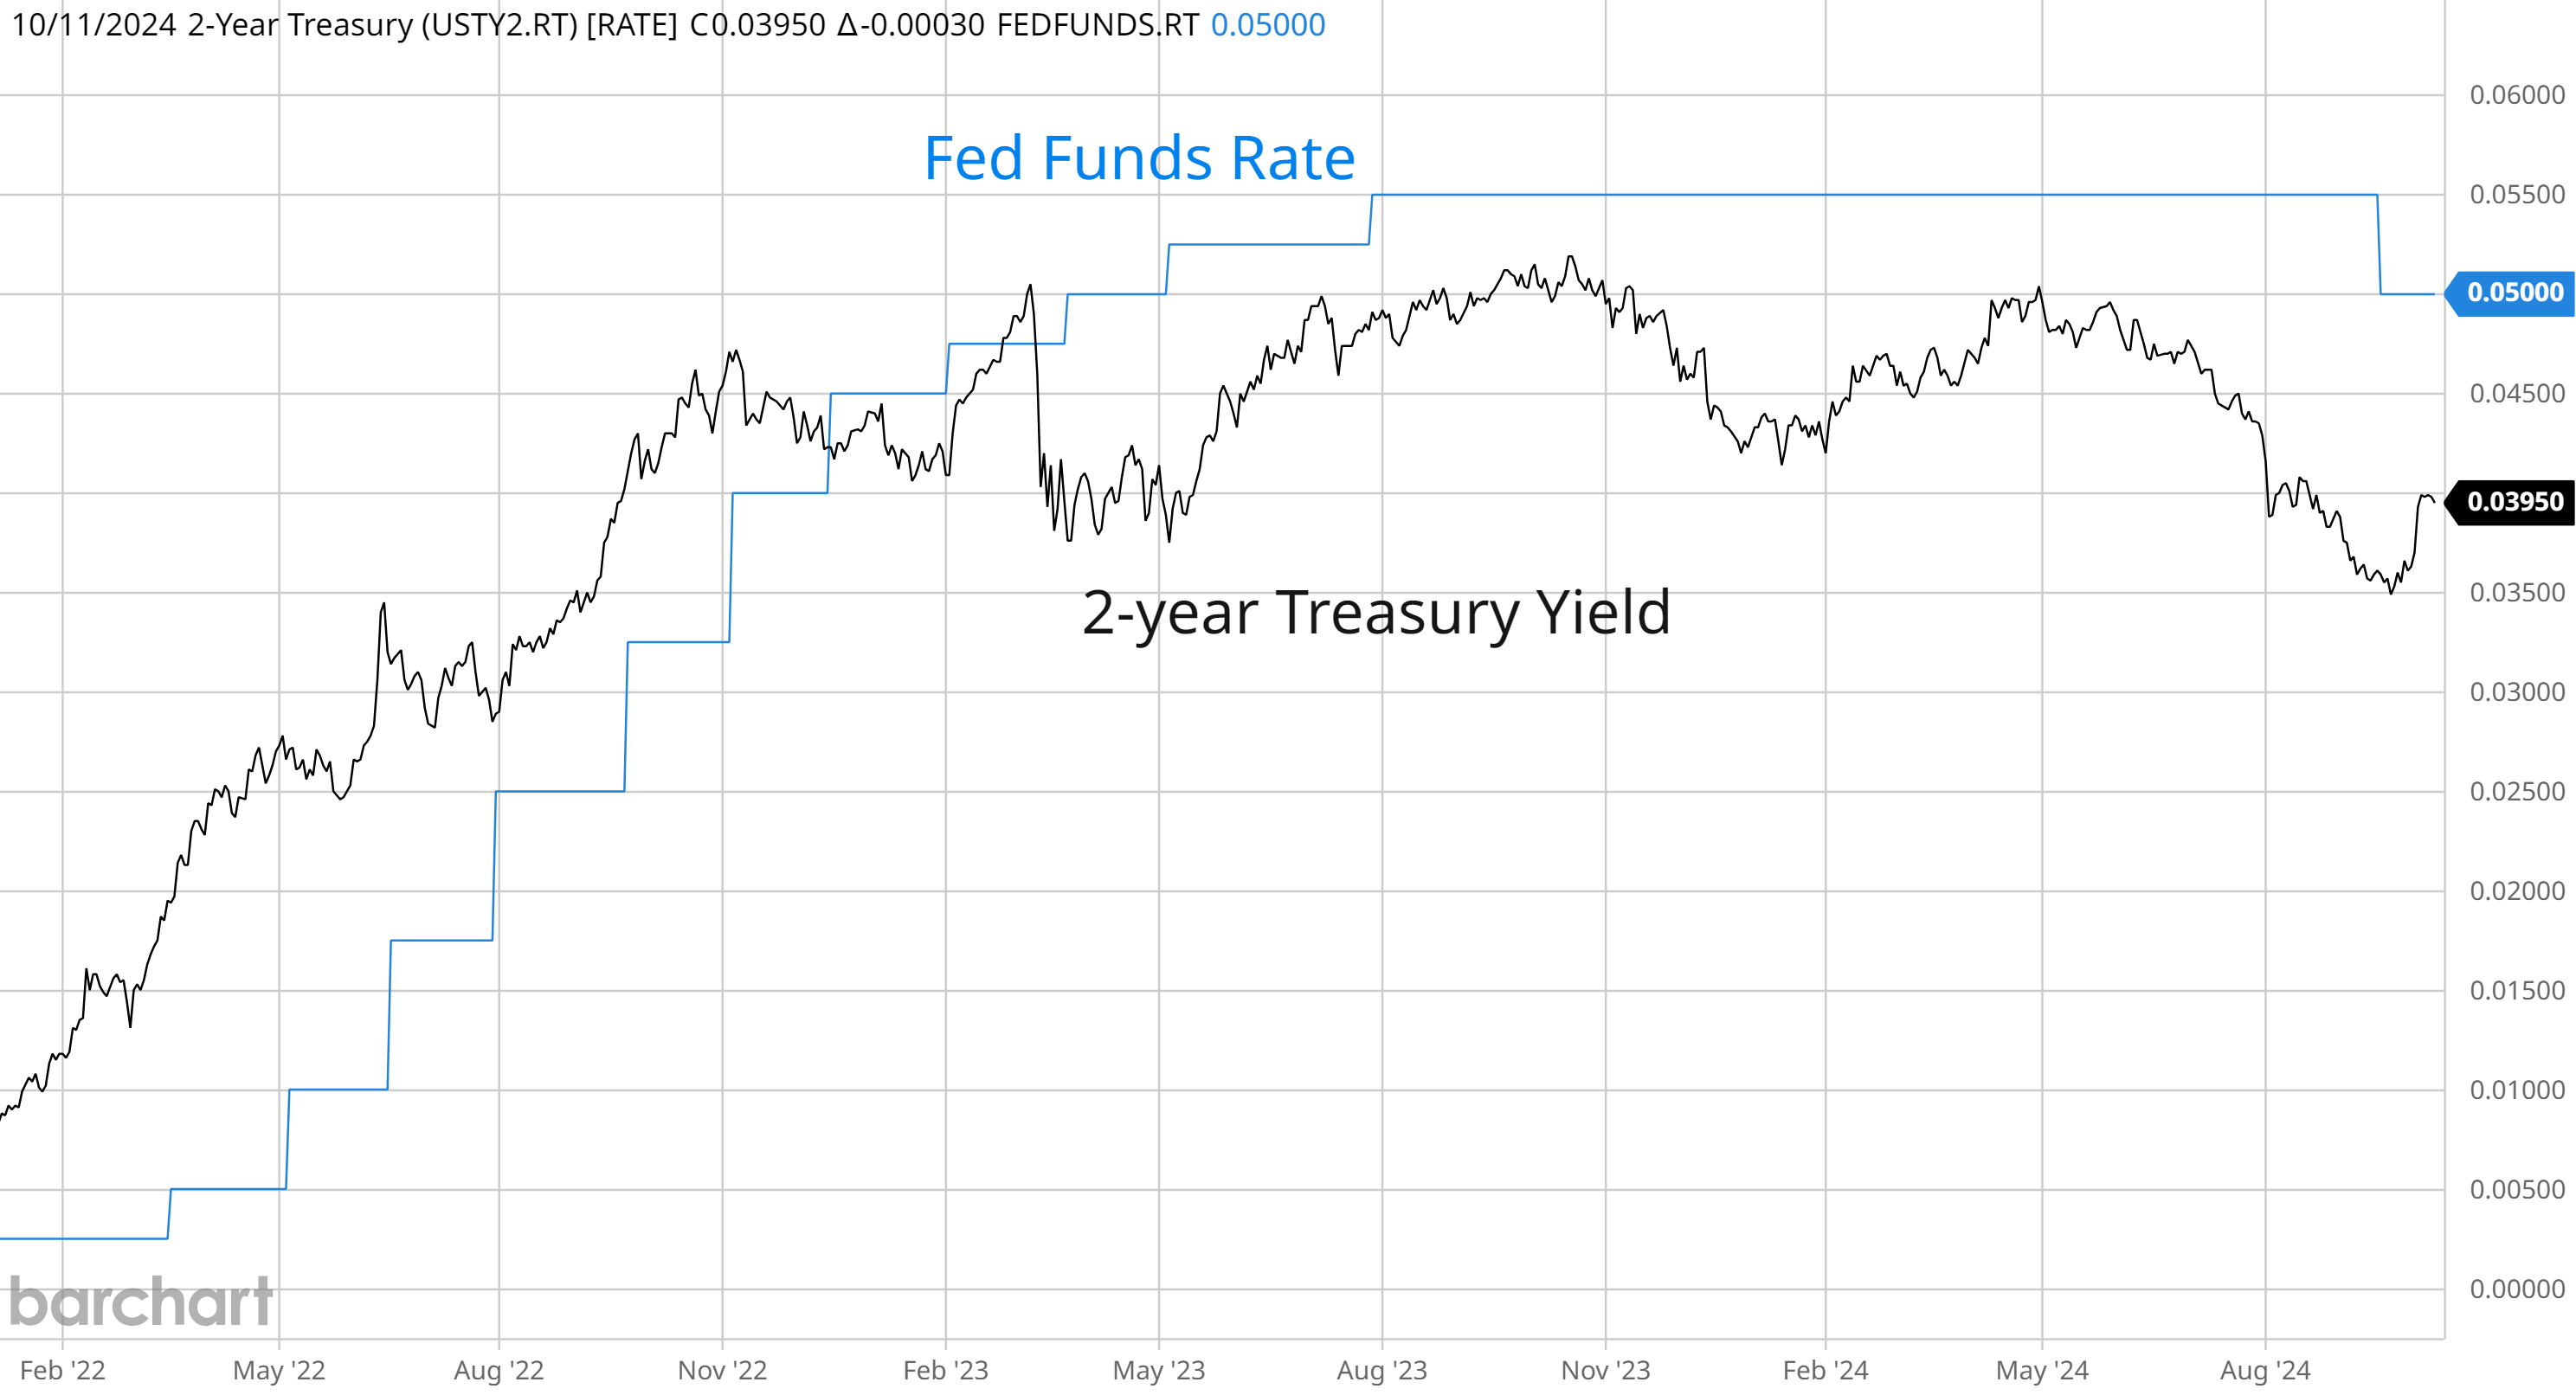
I recently reviewed how to use the 2-year Treasury yield as a leading indicator for where the fed funds rate could be heading. The 2-year started rising well ahead of fed funds in late 2021 as inflation picked up.
And the 2-year yield fell below fed funds back in early 2023, which signaled the pause in rate hikes. The 2-year then accelerated to the downside in July, which was two months ahead of the first rate cut. While the 2-year yield has rebounded following the latest round of labor and inflation data, it remains approximately 100 basis points below the current level of fed funds as you can see below.
Another positive feature of the overall backdrop for the stock market is linked to financial conditions. Financial conditions reflects the cost and availability of credit. Cheap and readily accessible credit is stimulative for both the economy and stock market.
The Chicago Fed maintains a measure of financial conditions that looks at metrics spanning equity and debt markets. Financial conditions are already loose as the Fed starts cutting interest rates as you can see below. The zero line represents the average, with a reading below zero pointing to looser than average conditions.

I would also point out that in each of the last seven recessions, financial conditions were tighter than average just before or during the recession. That’s not the case now, with conditions receiving another boost as the Fed pivots toward easing monetary policy.
So while the outlook for the speed and magnitude of further rate cuts might be uncertain, solid evidence that the economy will avoid recession coupled with already loose financial conditions should remain supportive of corporate earnings and the bull market.
Now What…
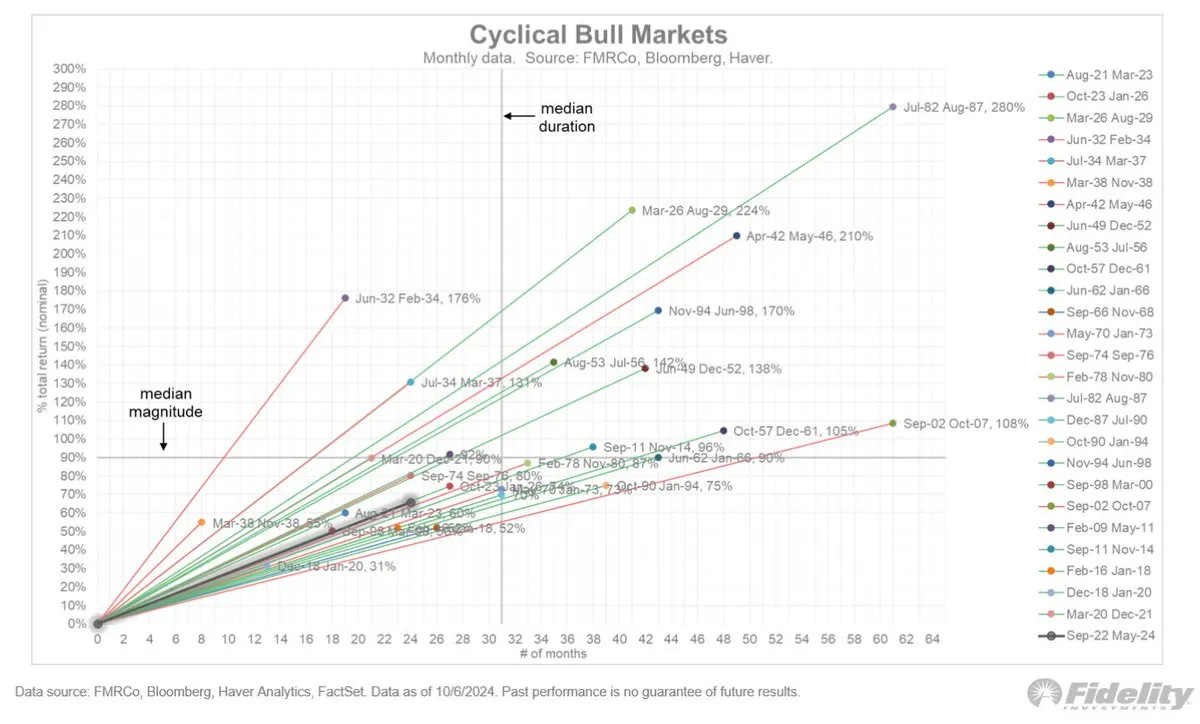
As the S&P 500 hits the 2 year anniversary of this cyclical bull market, historical precedent suggests that there is room to run. The chart below plots the past 27 cyclical bulls, along with the median gain and duration. Based on both measures, the current cyclical bull has more room to reach just the median.
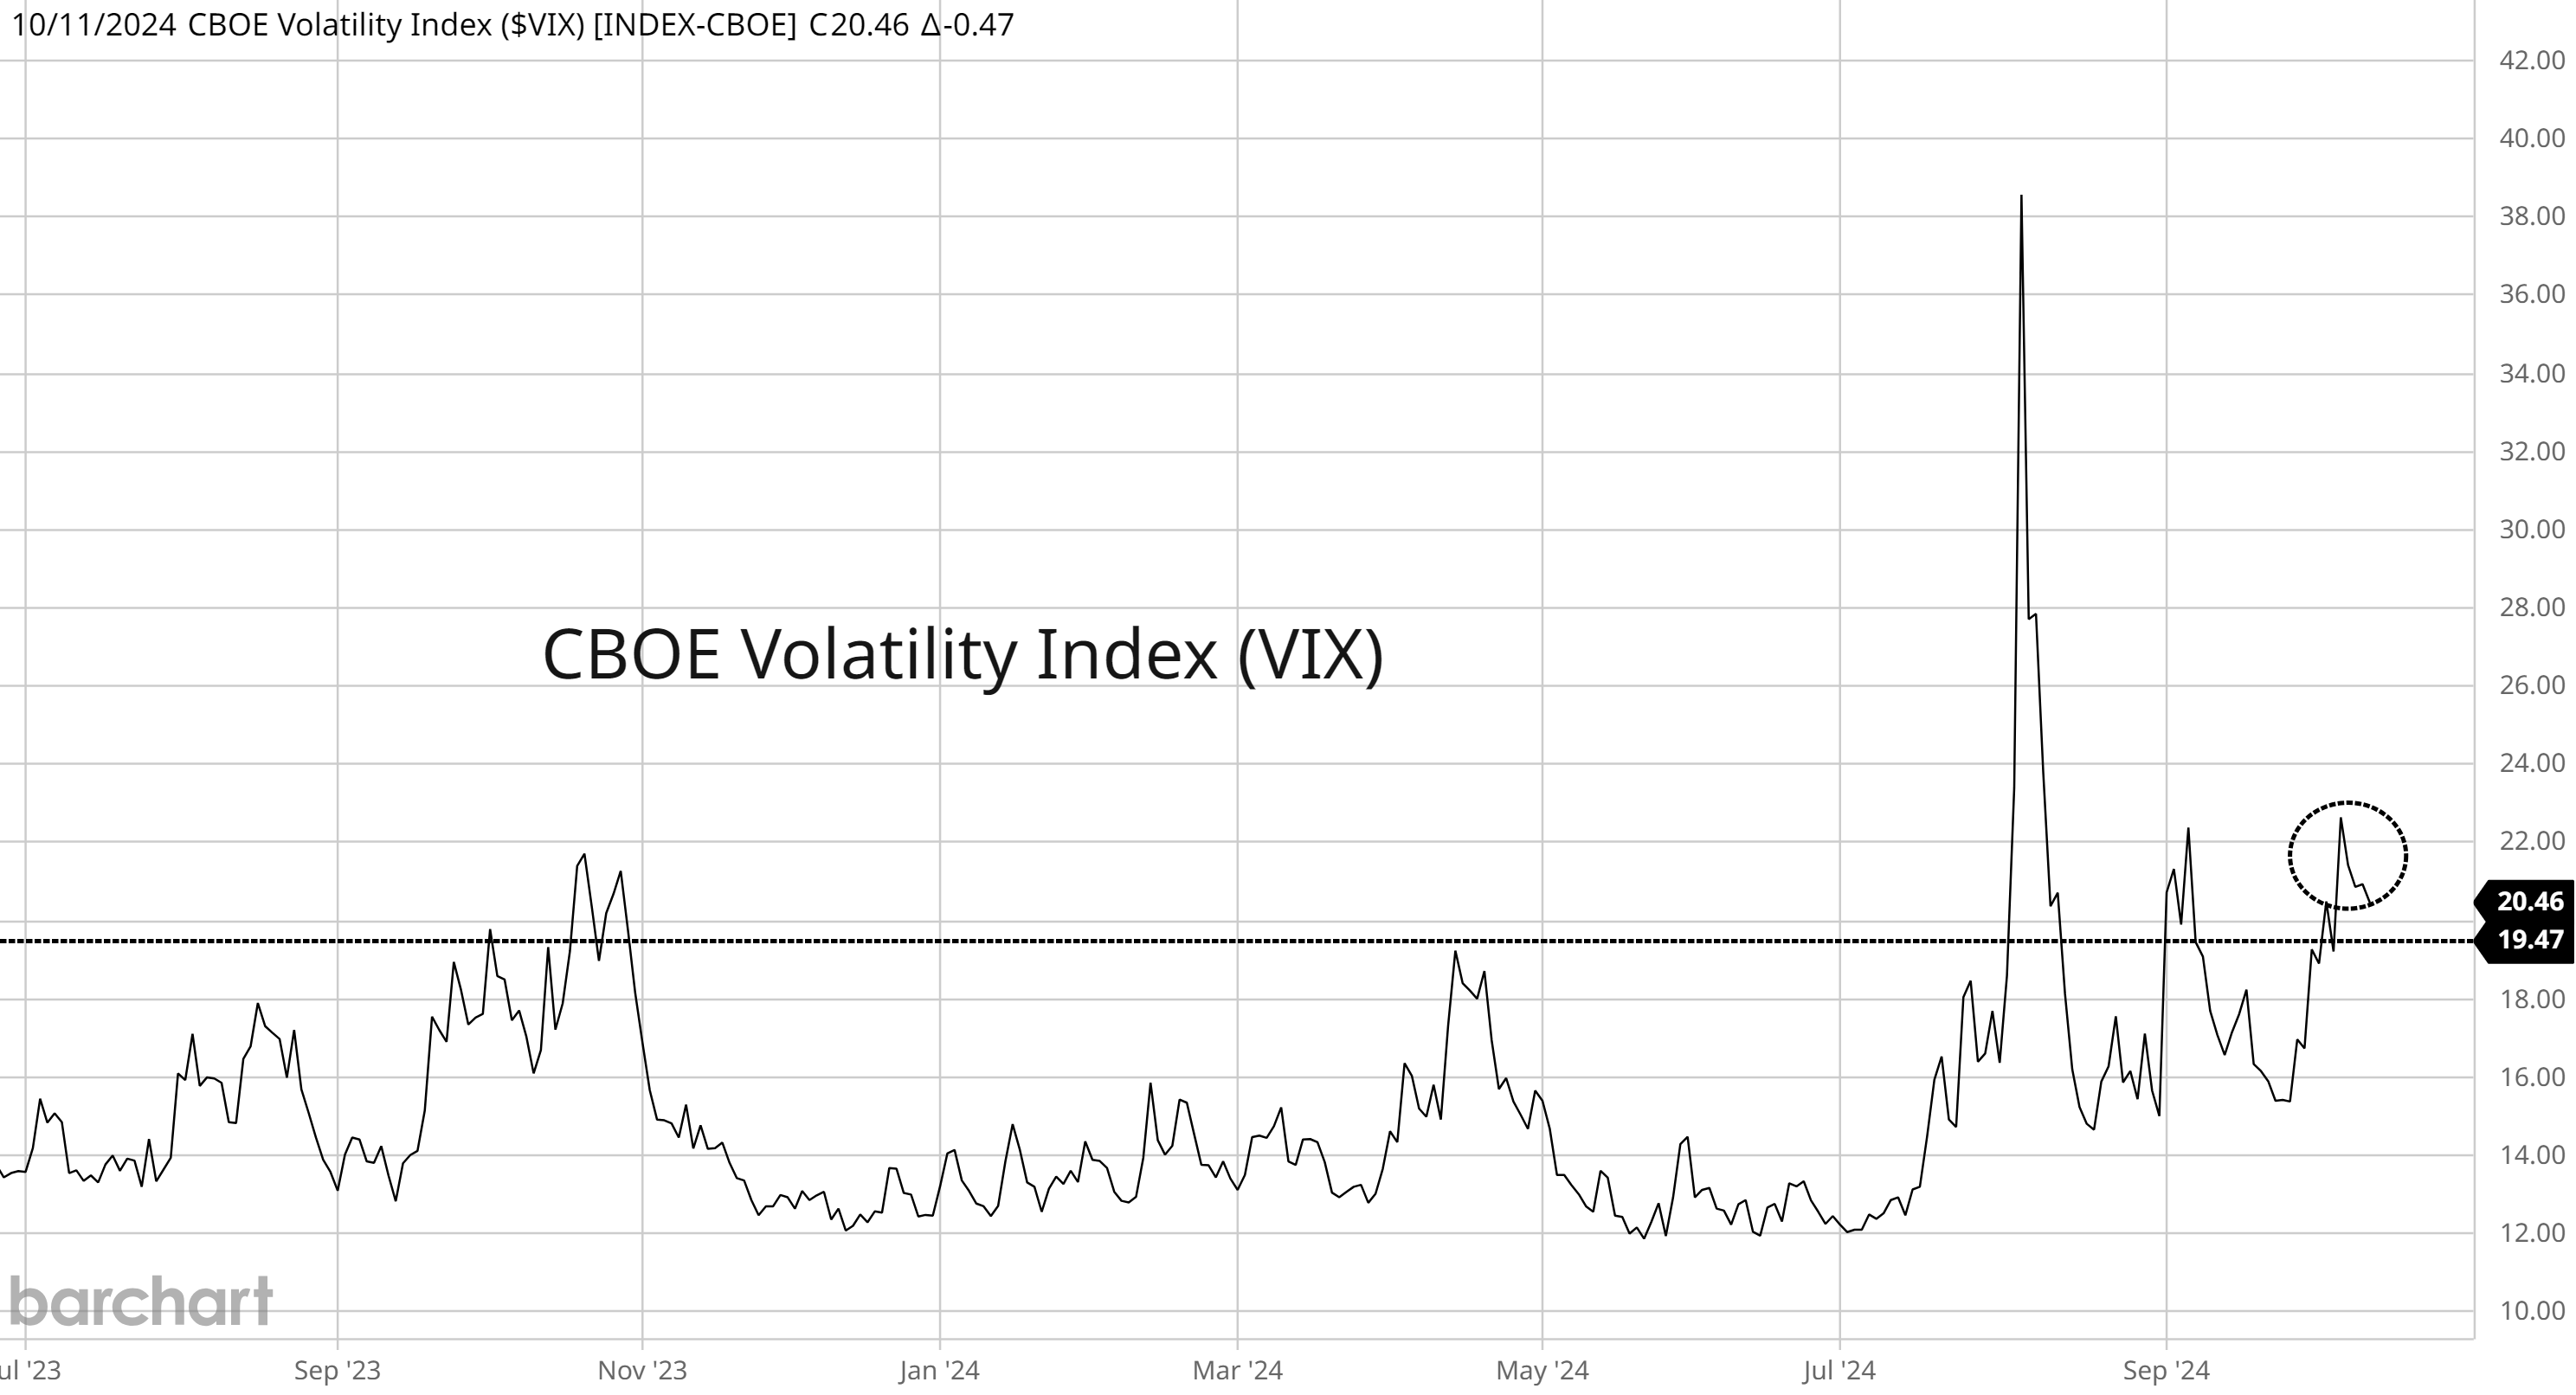
But there are a few reasons to be cautious in the near-term. I shared recently how volatility tends to spike within 30 days of the election. Despite the S&P 500 moving out to new all-time highs, the CBOE Volatility Index (VIX) is trading above its long-term average of around 19 that you can see in the chart below. A sustained move over the average could bring selling pressure from volatility-targeting and risk-parity funds trying to stay within their risk budget.
At the same time, near-term market breadth has been deteriorating recently. As the S&P 500 made new highs last week, at one point there were just 45% of stocks across the market trading above their 20-day moving average.
We can also track breadth with the McClellan Oscillator, which tracks advancing versus declining stocks on the NYSE over a trailing period. You can see in the chart below that the oscillator turned lower in mid-September and fell below zero. I would also note it’s starting to rebound from oversold territory.

Lagging breadth alone isn’t a reason to turn bearish on the market, but it’s a condition to monitor as we enter a historically volatile stretch for the S&P 500. But at this point, I continue to expect any pullback to be a pause in the broader market uptrend.
That’s especially the case as more cyclical stock market sectors are setting up favorable breakout patterns. That includes banks and mid-cap stocks. I posted a note in my chat about the trade setup in mid-caps that you can read here.
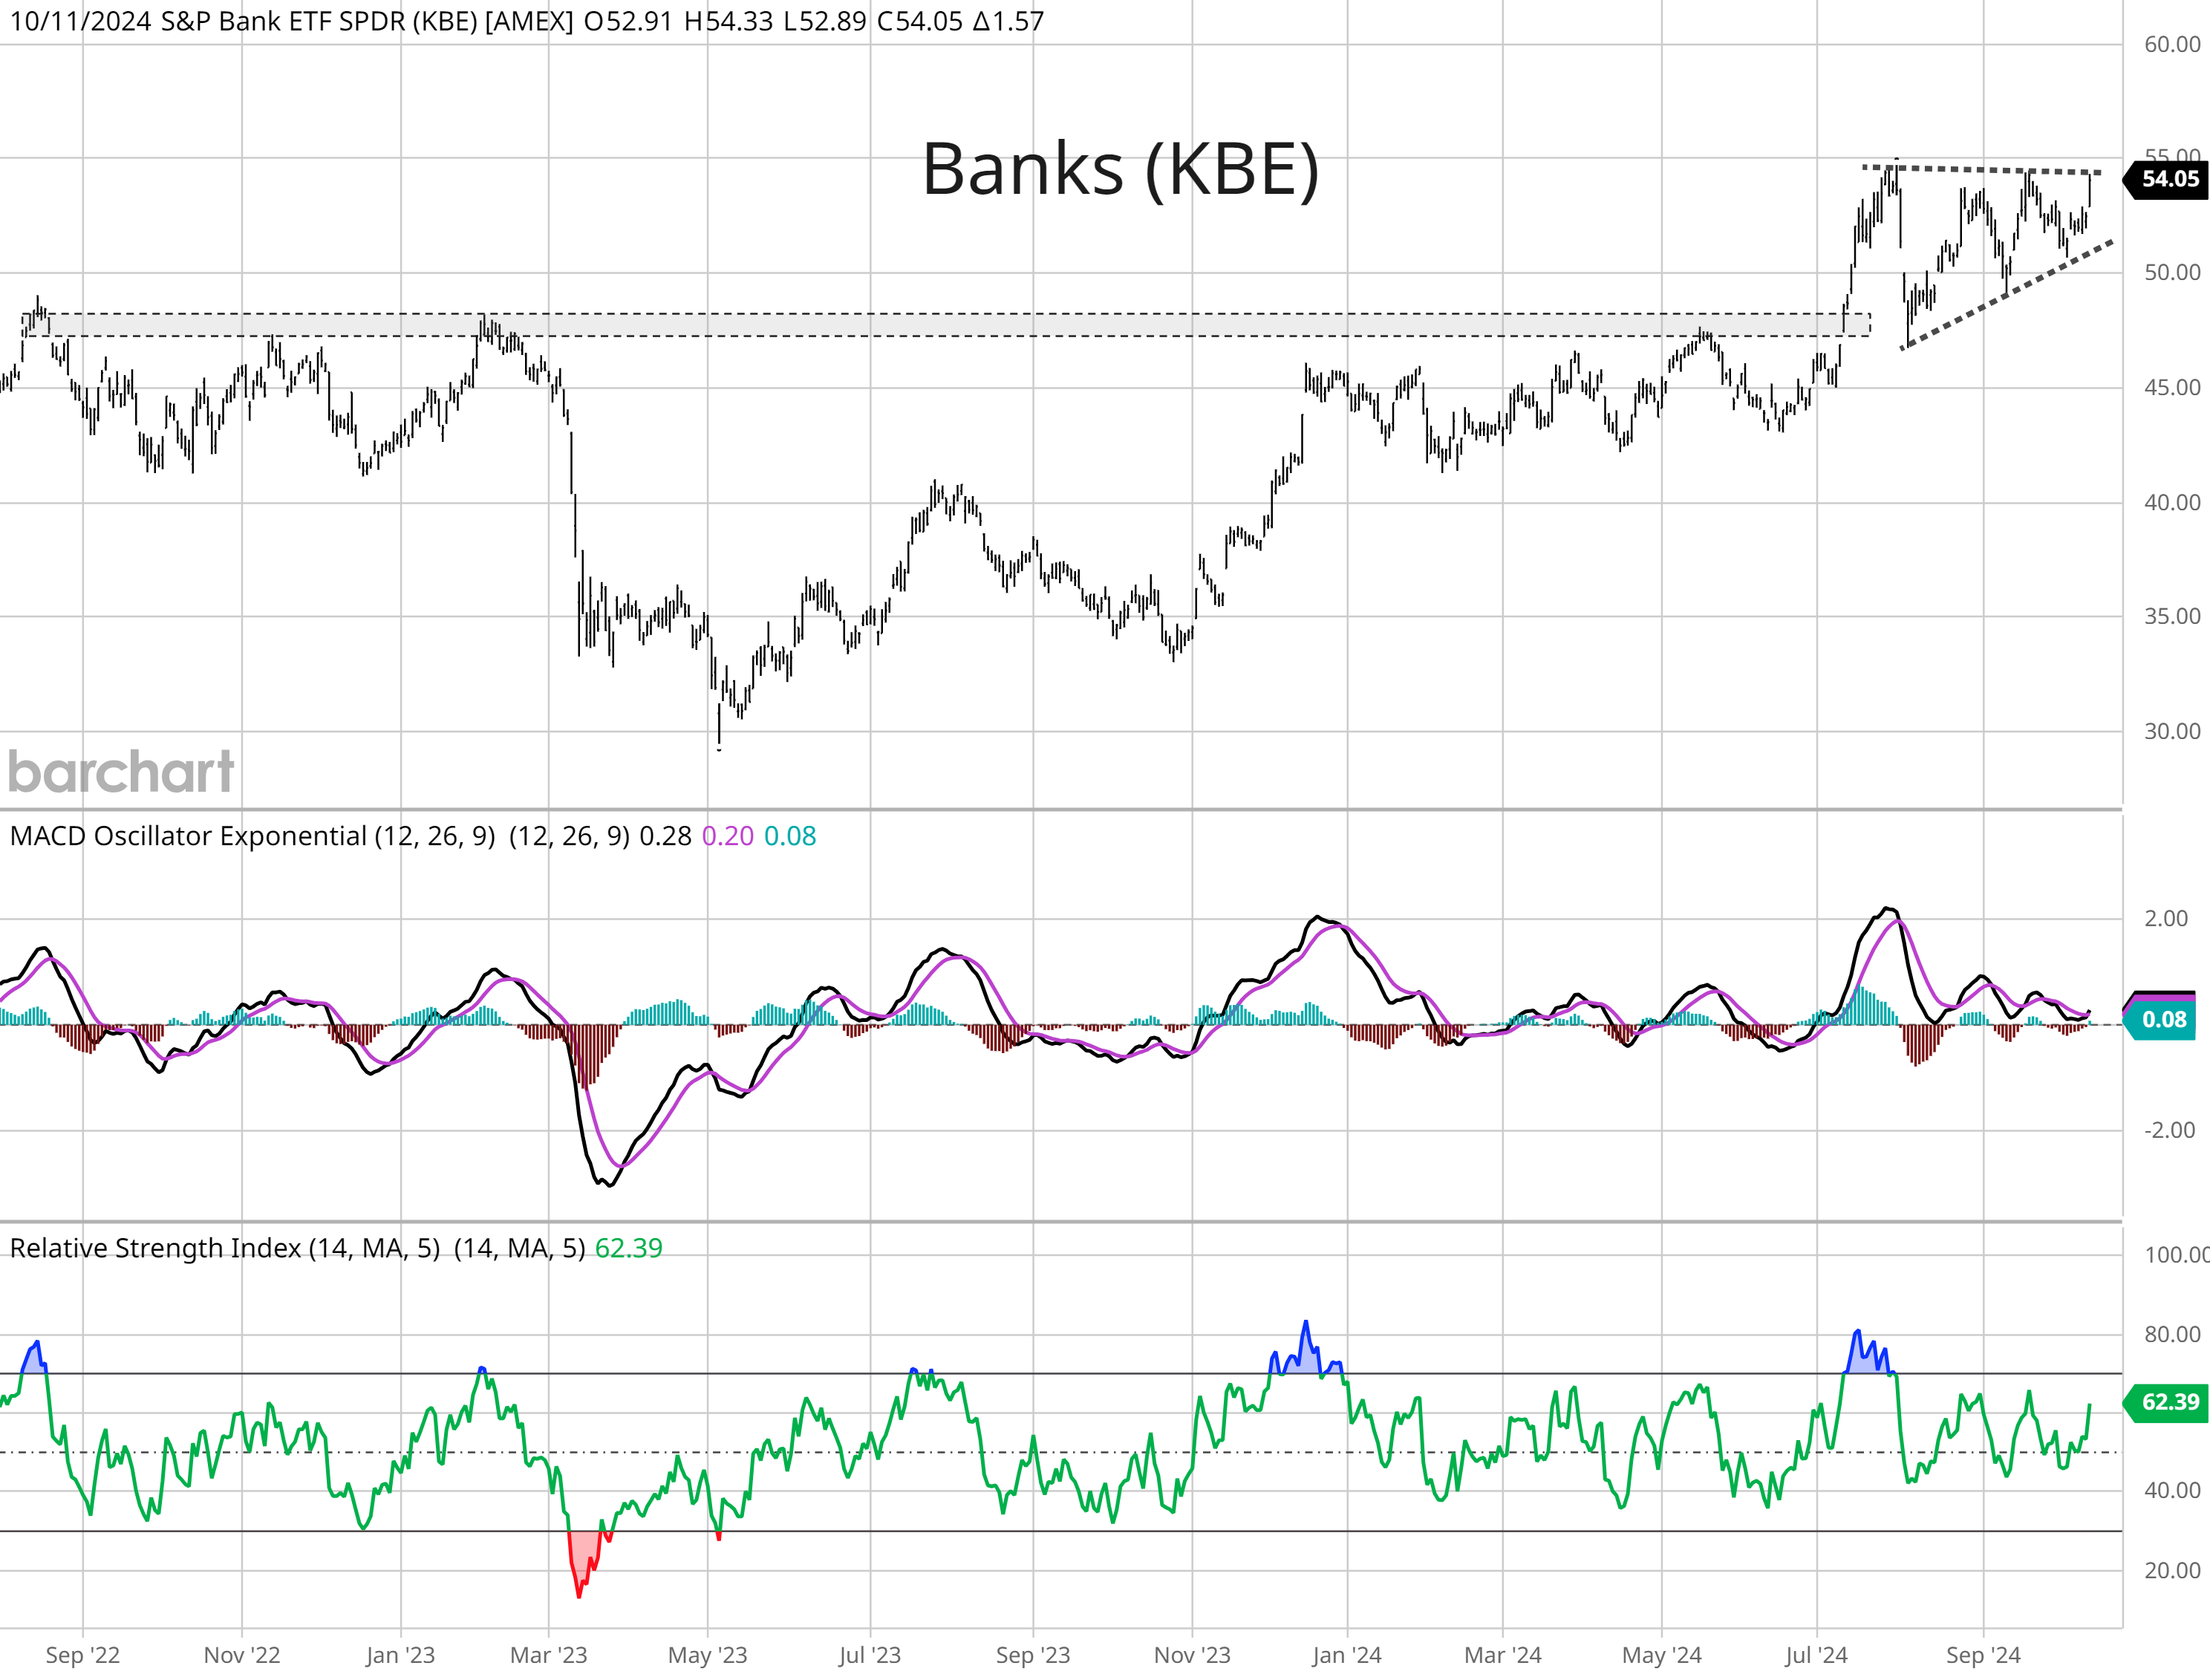
The chart below shows the SPDR S&P Bank ETF (KBE). You can see that KBE broke above a major resistance level at $48 back July. Price came back to test that level as support, and is now creating a new pattern to watch. KBE is now making an ascending triangle pattern, with resistance at the $55 level. Price is turning back toward that level just as the MACD turns higher from resetting at the zero line. I’m now now watching for a move over $55, which would also be a positive message from another cyclical sector on the economic outlook.
That’s all for this week. The coming week will be relatively quiet on economic data, but the pace of 3Q earnings reports will pick up. There are 43 companies in the S&P 500 reporting this week. But I’ll be watching volatility markets heading into the elections, and if cyclical sectors can keep breaking out.
I hope you’ve enjoyed The Market Mosaic, and please share this report with your family, friends, coworkers…or anyone that would benefit from an objective look at the stock market.
And make sure you never miss an edition by subscribing here:
For updated charts, market analysis, and other trade ideas, give me a follow on X: @mosaicassetco
And if you have any questions or feedback, feel free to shoot me an email at mosaicassetco@gmail.com
Disclaimer: these are not recommendations and just my thoughts and opinions…do your own due diligence! I may hold a position in the securities mentioned in this report.
Thank you for many topical discussions. While the S&P 500 on average continued to rise 18 months after the beginning of rate cuts in non-recessionary periods, the starting point this time is we are at a higher valuation than historically, so I still wonder how the upside may compare this time. The saviours are that real interest rate are falling quickly, earnings keep growing, while equity risk premium also is expanding as the Fed cuts interest rate and the high-performing sectors like tech have high defensible margins too let alone high ROE, so market as a whole has a higher multiple this time.