

In this post, I’ll focus on setups that I’m monitoring for both long and short positions. With a chart and short write-up, this is a quick way to scan and plan potential trades.
These ideas are the end result of my process to identify stocks offering the right combination of growth fundamentals along with a proper chart setup.
Stock Market Update
Updated inflation reports for the month of June are delivering a mixed picture. The Consumer Price Index (CPI) increased by 2.7% compared to last year, while the core figure that strips out food and energy prices gained by 2.9%. Both figures accelerated from May’s rate which was expected. There’s also evidence that tariffs are showing up in the data, like with household furnishings that rose 1.0% compared to the prior month. That was the largest increase since January 2022, while core goods excluding autos rose by 0.5% and is the biggest increase since mid-2022 (when headline CPI was running at 9.0%). The chart below shows the annual rate of change in the CPI’s core goods (blue line) and core services (orange line) measures.

But there was some relief on resurgent inflation fears with the Producer Price Index (PPI). The June PPI rose by 2.3% compared to last year while the core figure increased by 2.6%. While both figures represent a deceleration from May, much of the decline was attributed to weak demand for travel that drove a decline in services inflation while goods rose 0.3% month-over-month.
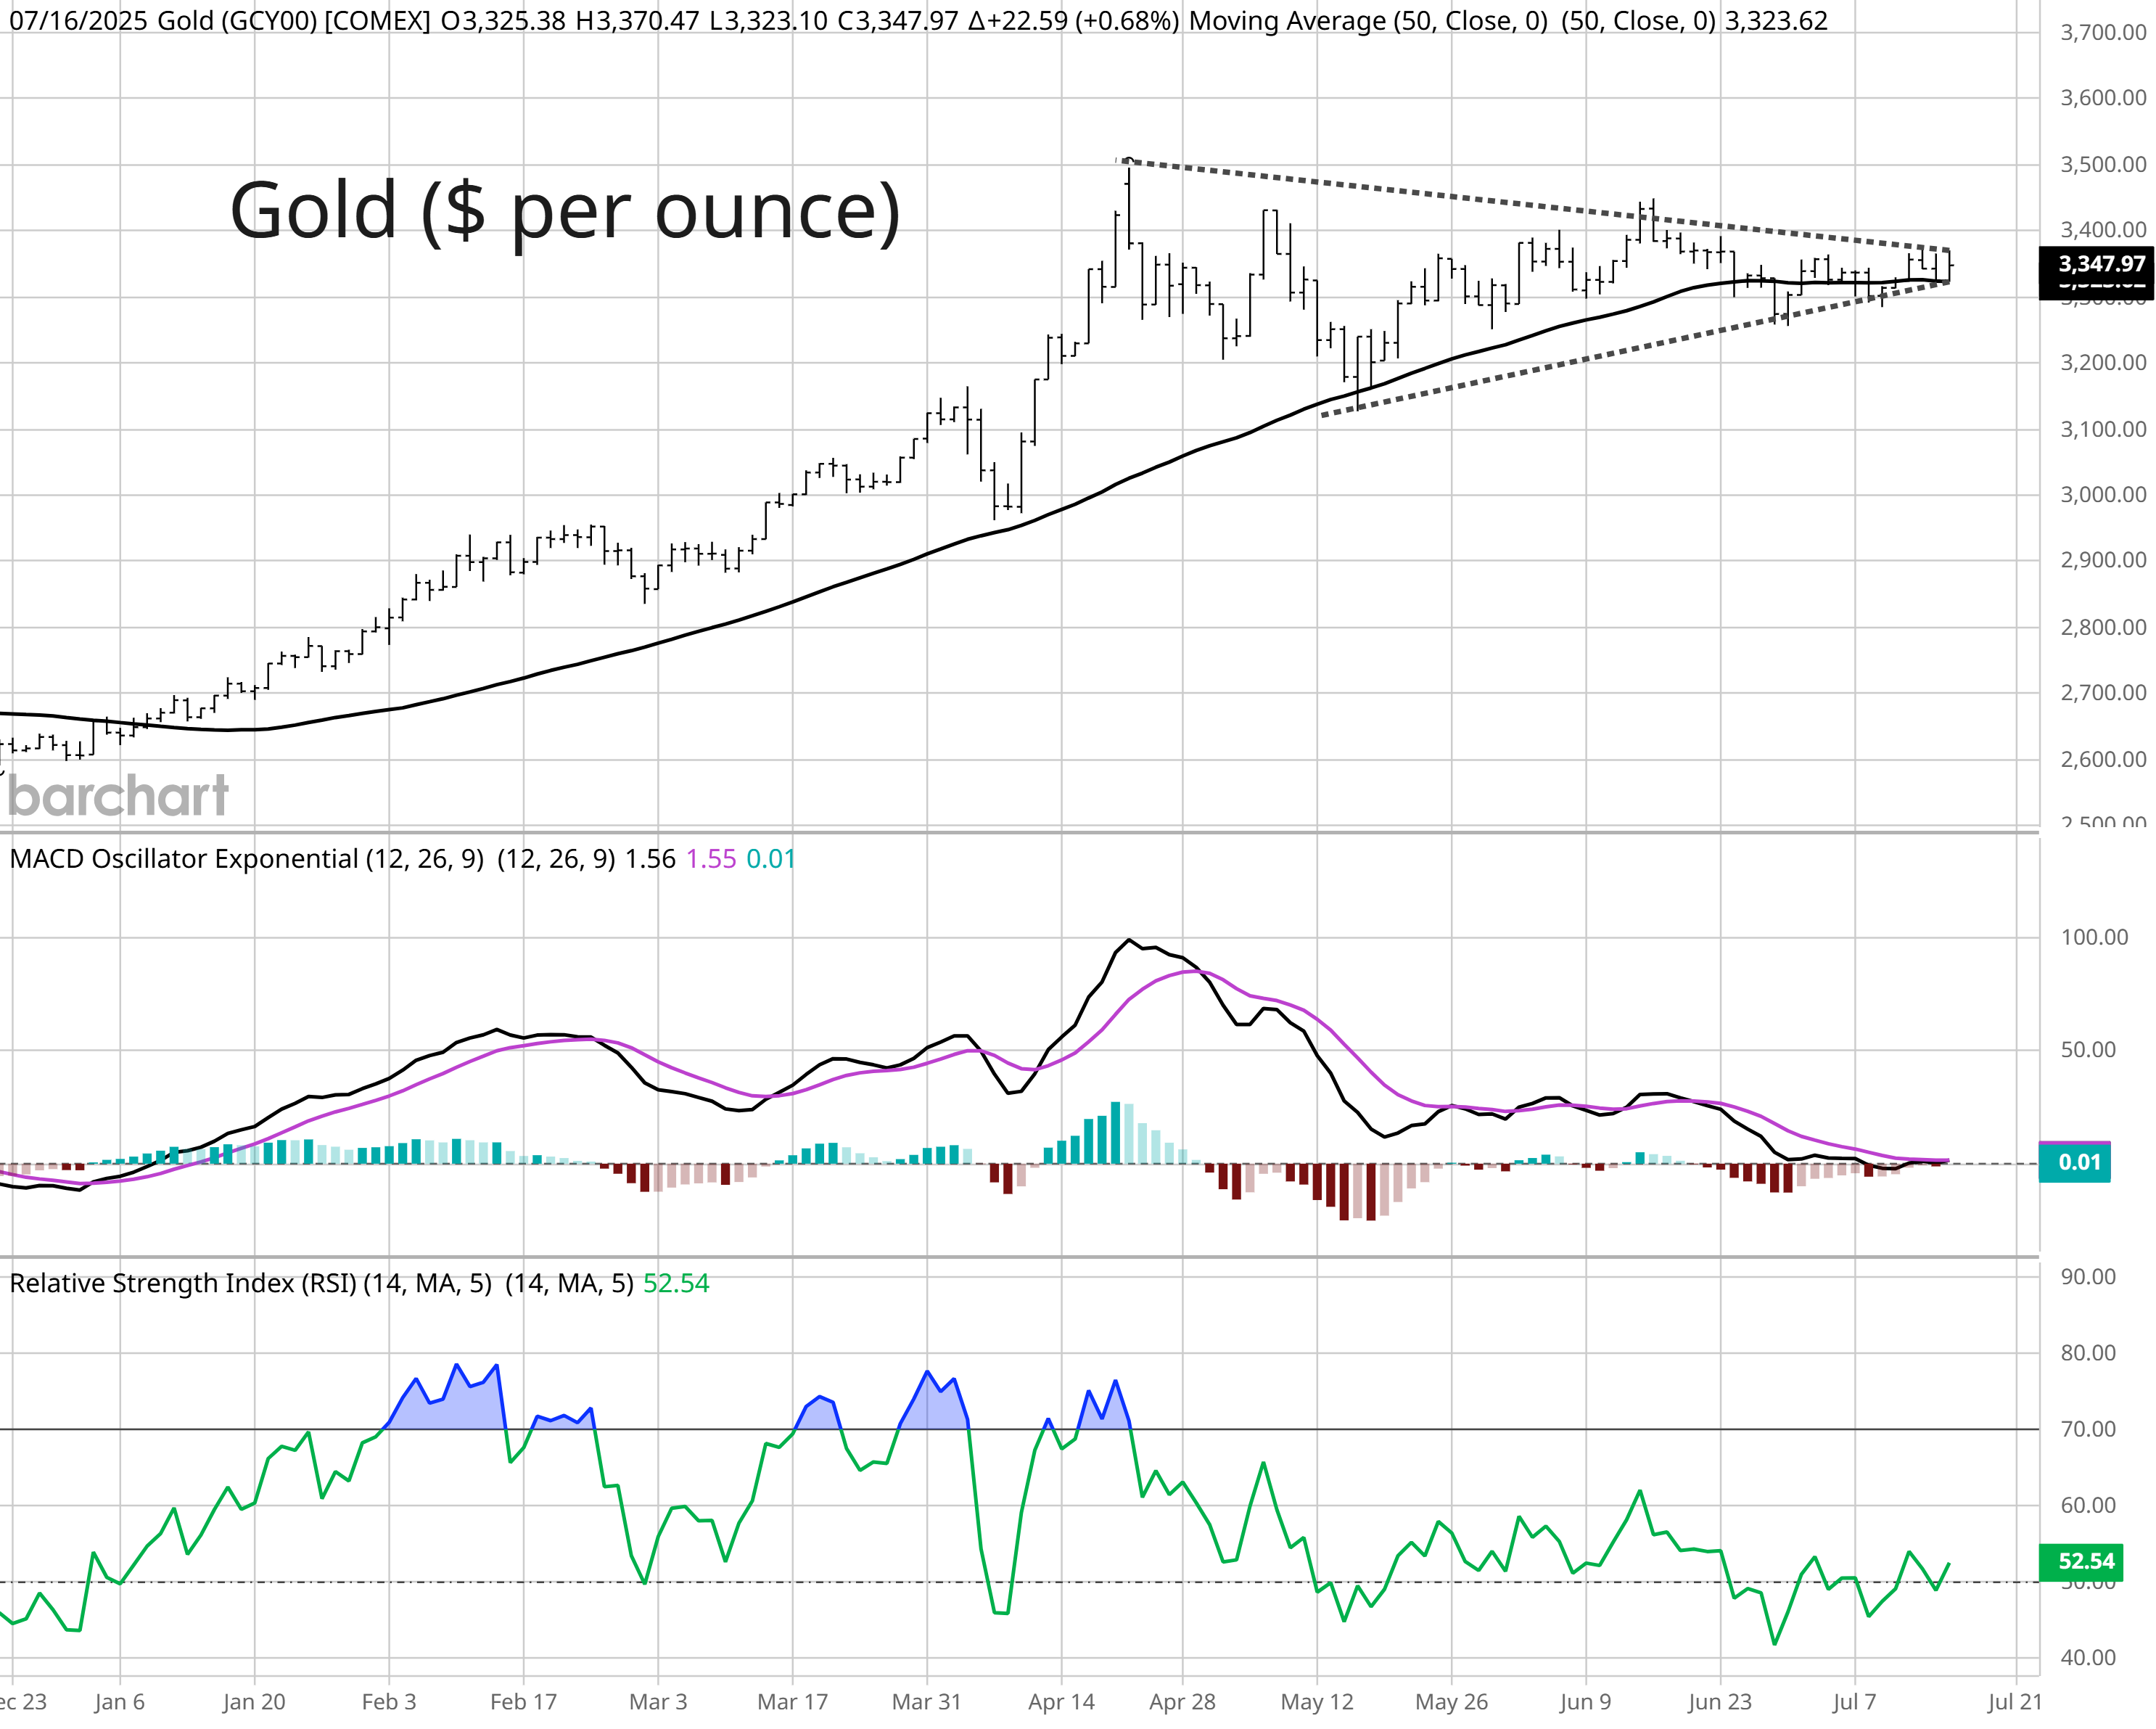
Following the reports, market action still suggests that inflation could inflect higher during the second half of the year. The Market Mosaic from this past weekend detailed breakouts in assets that tend to have a high inflation beta or are favored for their scarcity value, including Bitcoin, copper, and silver. Gold could be the next inflation-sensitive chart to watch, with gold nearing the apex of a symmetrical triangle pattern shown in the chart below. That tends to be a continuation pattern, where price resolves in the direction preceding the new structure. The MACD is also making a bullish reset above zero, while the RSI has held above 40 during the consolidation which tends to be an oversold level during an uptrend.
Despite the market signaling inflation concerns, major indexes are continuing to rally with the S&P 500 holding near record highs. Several of our open positions leveraged to nuclear, crypto, and precious metal themes continue progressing in their uptrends as well. Keep reading to see:
Open ETF positions.
Open stock positions.
Chart analysis for new trade ideas.
