
The Market Mosaic 7.13.25
Scarcity surge: Bitcoin, silver, and copper breaking out.

👋Welcome back to The Market Mosaic, where I gauge the stock market’s next move by looking at macro, technicals, and market internals. I’ll also highlight trade ideas using this analysis.
If you find this report helpful please hit that “like” button, share this post, and become a subscriber if you haven’t already done so!
🚨And be sure to check out Mosaic Traders Hub. It’s a members-only platform to alert trade ideas, track a model portfolio of open positions, and further analyze the message coming from the capital markets.
Now for this week’s issue…
The trade war looks set to enter a new phase, with President Trump releasing public letters announcing a round of new tariffs that will go into effect August 1.
Those new rates include 30% against the European Union and Mexico, and 35% against Canada. The effective tariff rate currently stands at 18%, which is the highest level since 1934 and looks set to go higher still.
As more tariff headlines hit, major moves in metals and cryptocurrencies during the week points to concerns around inflation. It started with a surge in copper prices, with a domestic benchmark jumping over $5 per pound to record highs.
Bitcoin and silver followed along. The world’s largest crypto by market value rose to a fresh record high at $119,000 while silver rose to $38 per ounce and is the highest level since 2011. Both breakouts followed bullish continuation chart patterns.
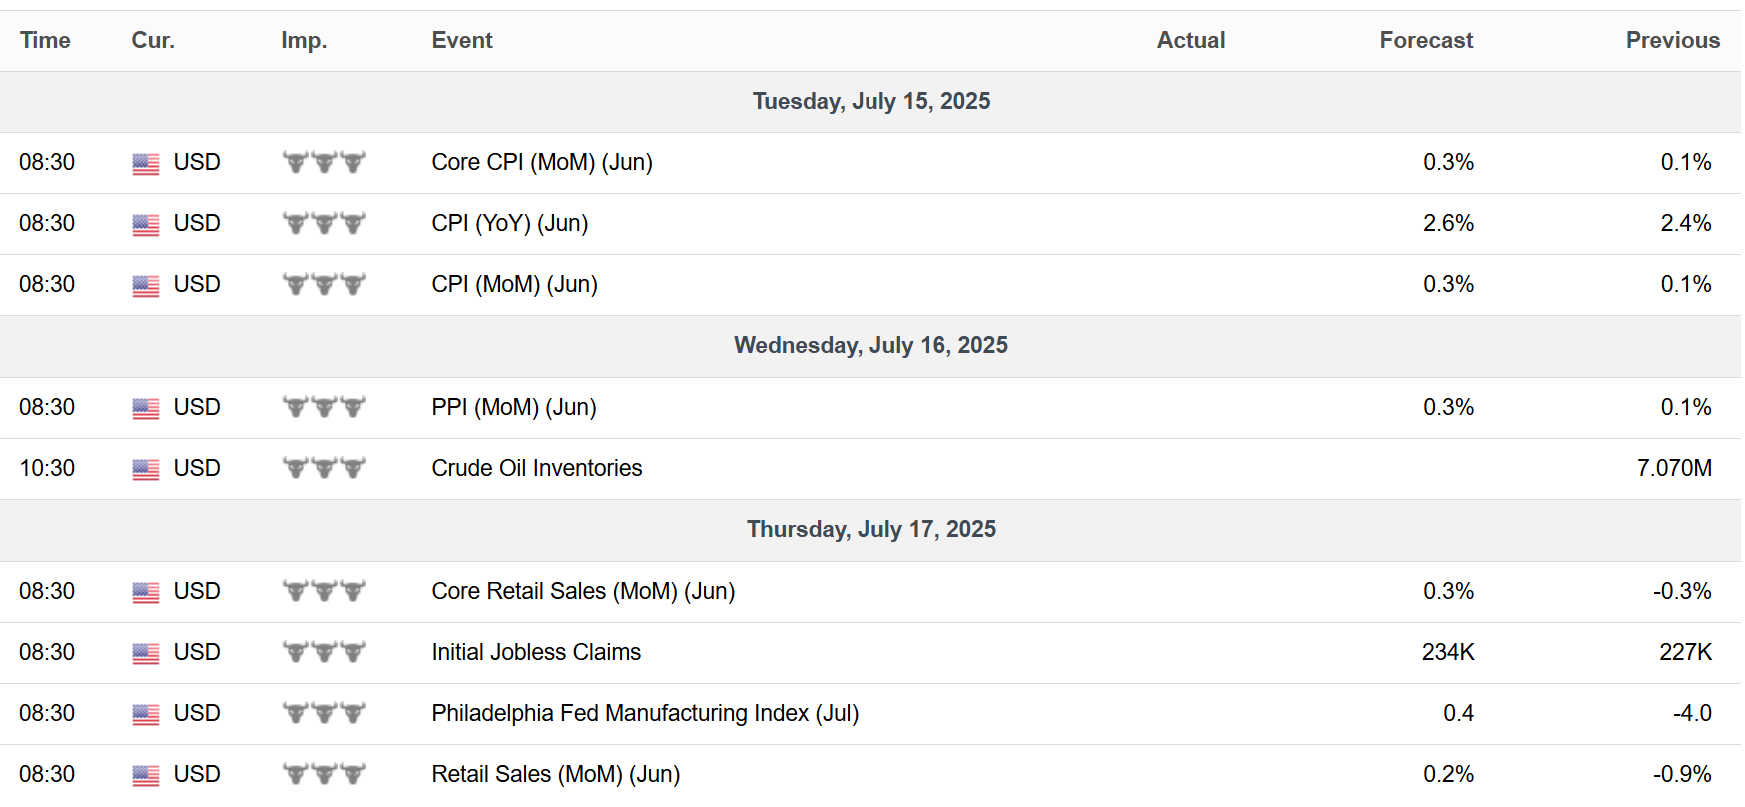
The timing of the breakouts is notable with the latest round of consumer and producer inflation reports due this week. Based on estimates from the Cleveland Fed’s Inflation Nowcast (table below), the headline Consumer Price Index (CPI) is expected to rise 2.64% for June while the core figure is projected to gain 2.95%.
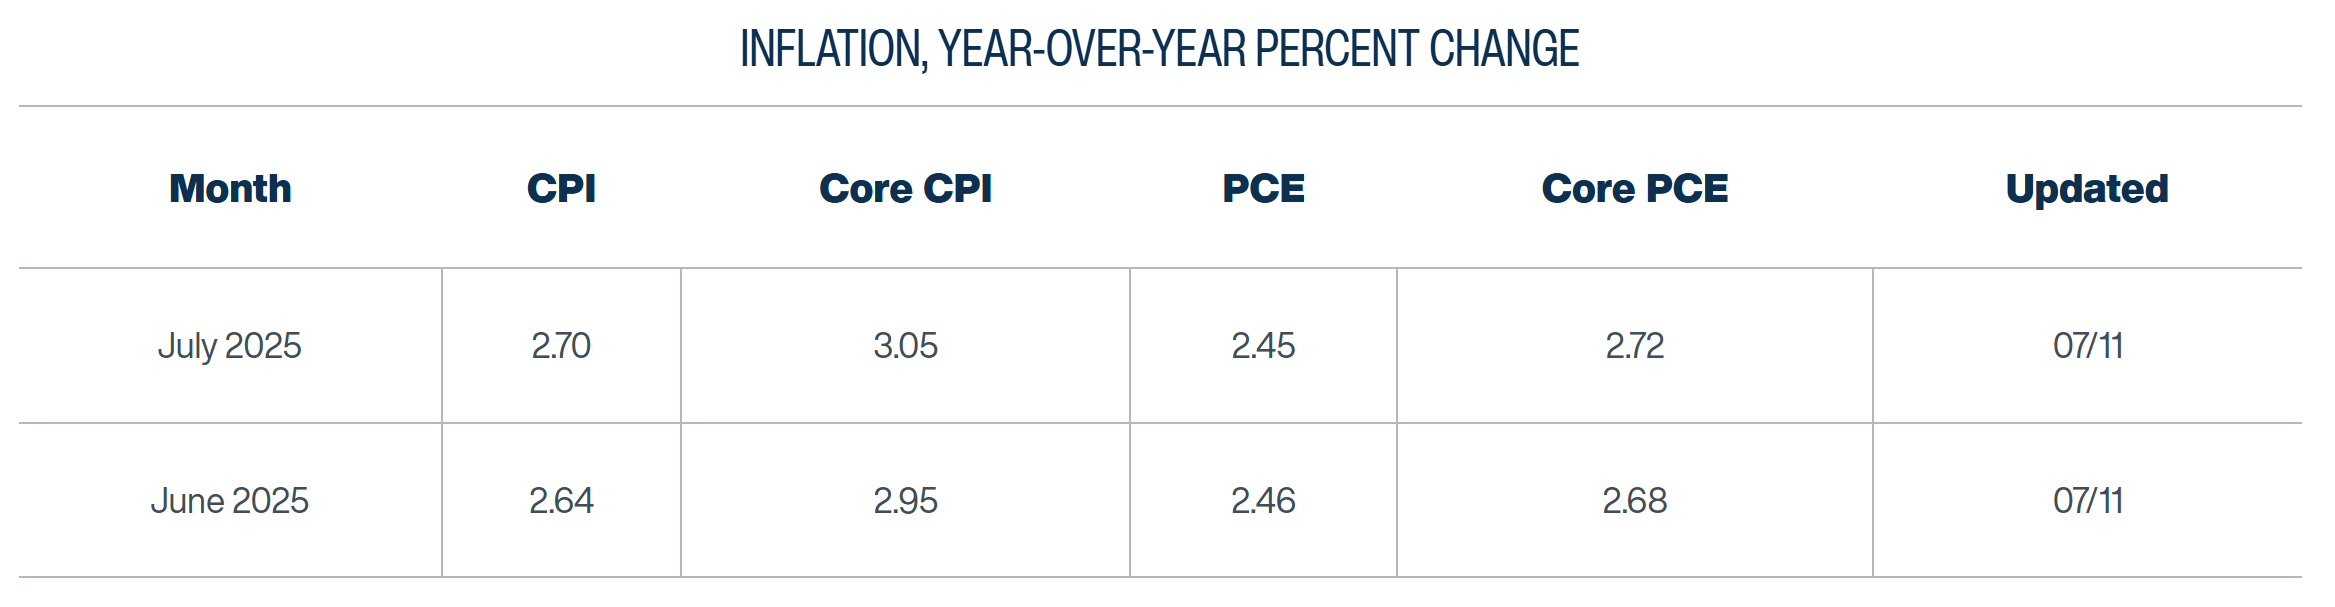
Both measures are an acceleration from last month’s level of 2.4% on headline and 2.8% on core, and points to inflation starting to inflect higher. You can also see in the table above that July figures are currently forecasted to accelerate modestly from June’s estimate.
This week, let’s look at the latest evidence surrounding why inflation could become a problem for investors in second half of 2025. We’ll also look at a factor behind the S&P 500’s rally to new highs and one big reason the Federal Reserve can keep interest rates steady despite Trump’s demand for rate cuts.
The Chart Report
Fresh headlines around the trade war are reigniting inflation fears. The disinflation trend in effect since mid-2022 could reverse in the second half of the year based on several leading indicators of inflation, with tariffs in the spotlight. But there are building price pressures beyond the impact from tariffs. Food prices could become a catalyst for higher inflation as well, with the chart below showing the annual gain in fertilizer prices (pushed six months forward) overlaid with the CPI’s food component. Changes in fertilizer prices tend to lead changes in food prices, and has been moving higher since late 2024.

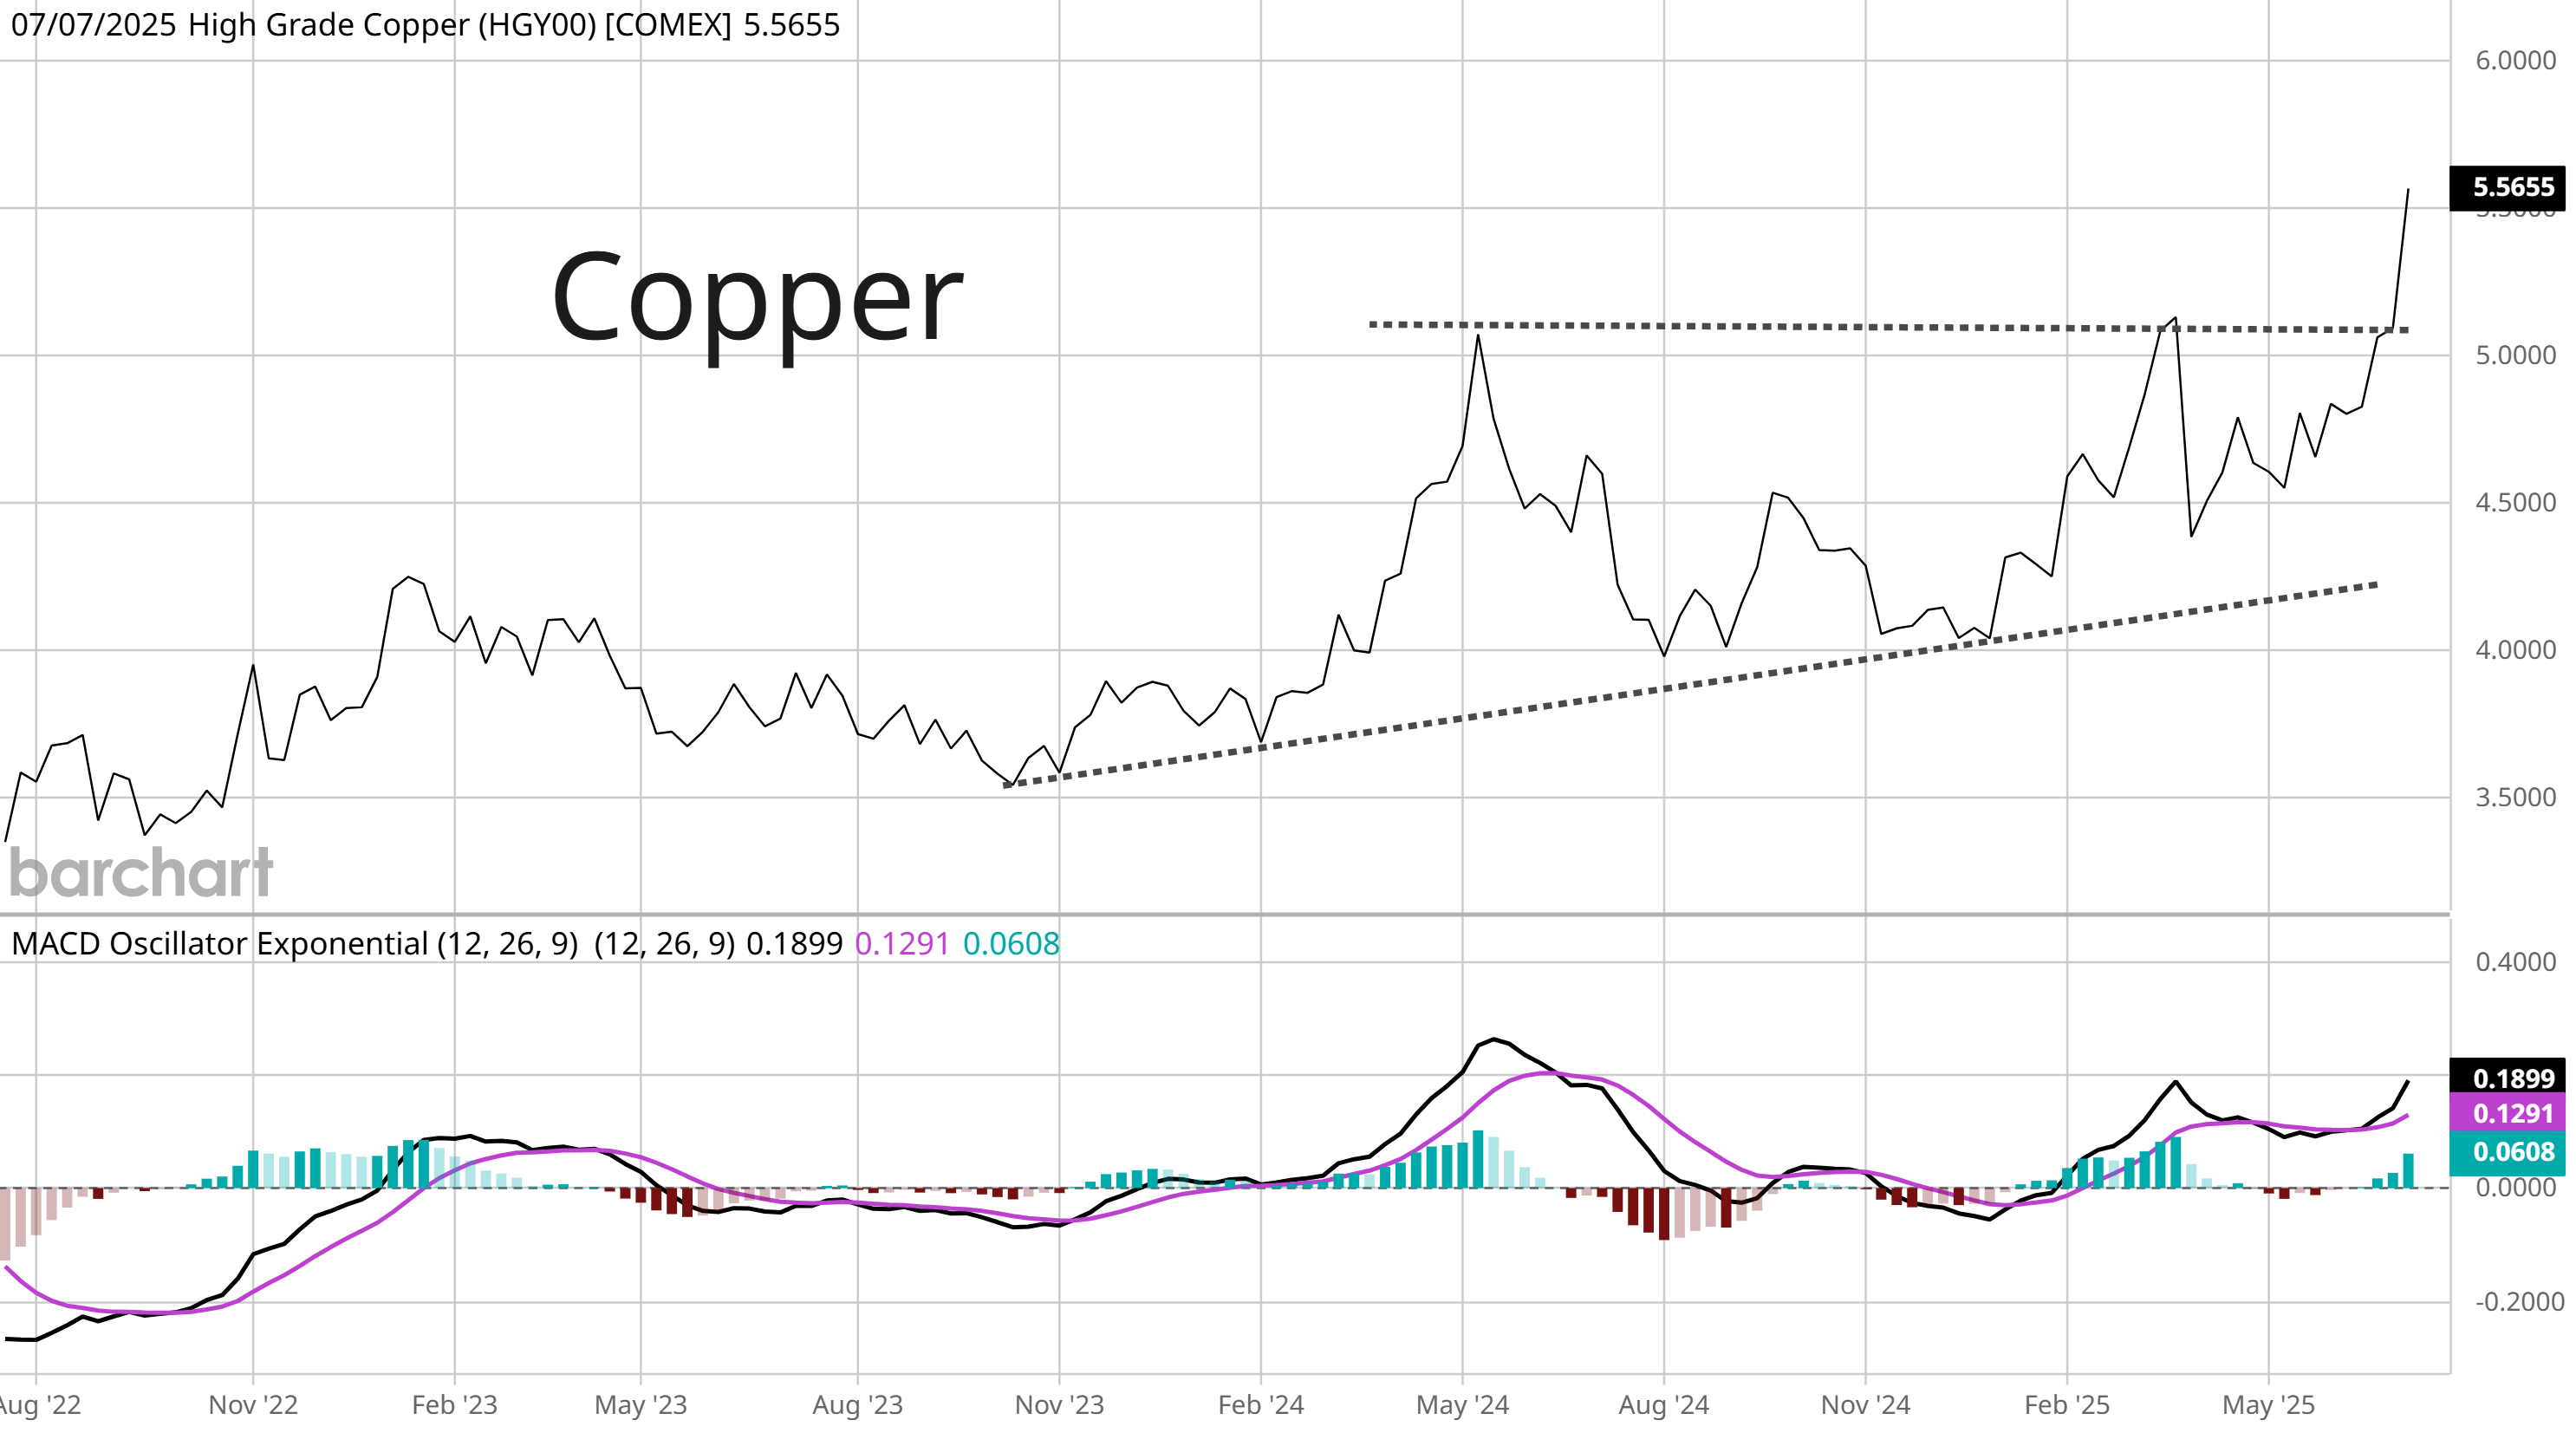
A planned 50% tariff on copper imports sent a domestic copper benchmark surging to new highs. President Trump announced the new tariff would begin on August 1 in order to encourage more domestic production. But the U.S. imports nearly half the copper it uses, which sent copper on a historic jump. Prices gained over 13% in a single session, which is the largest one-day rate of change ever. The tariffs might’ve been the catalyst, but bullish energy has been building in copper prices. The chart below shows the breakout from an ascending triangle pattern that has been forming for over a year.
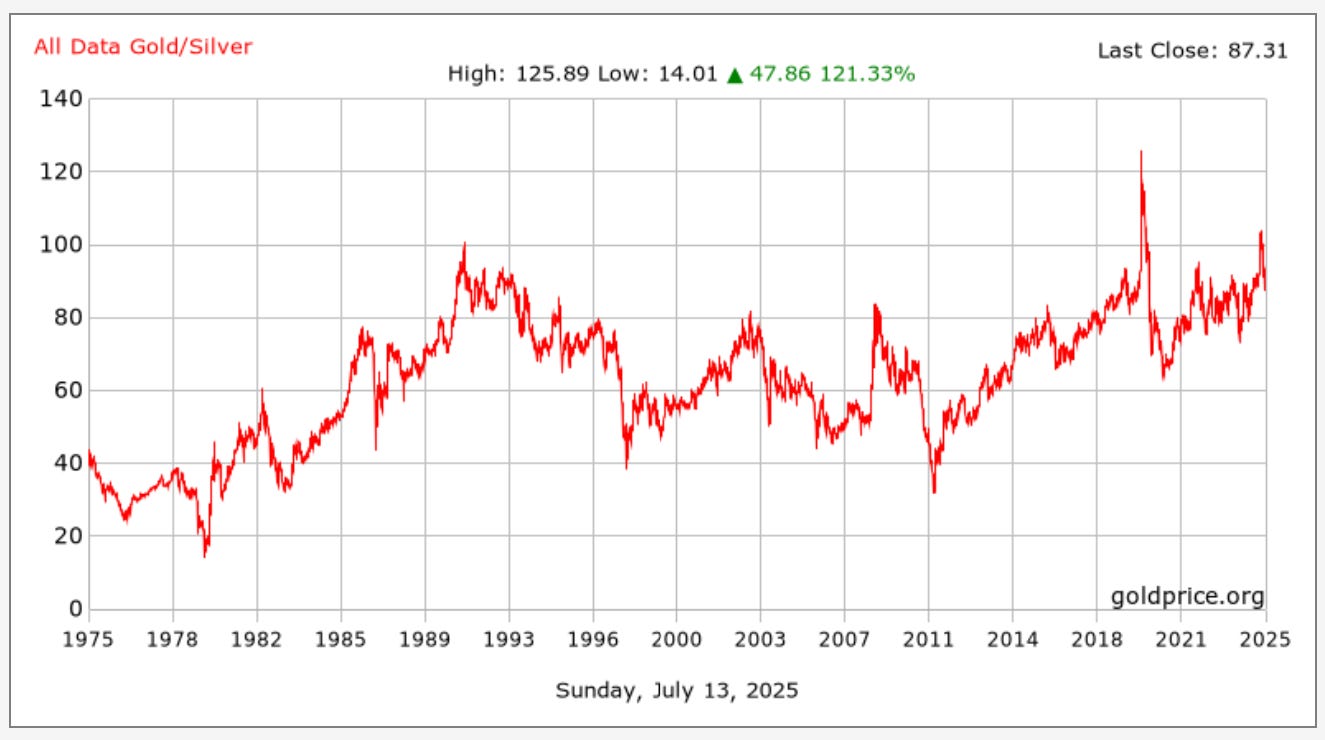
Just as Bitcoin and copper are breaking out from bullish continuation patterns, silver is doing the same. After breaking out over $35 per ounce, silver ran up to the $37 area and started forming a bullish pennant continuation pattern. Silver’s move out of that pattern put it at the highest level since 2011. But the upside could still be in the early stages based on the ratio of gold to silver prices. The chart below shows the ratio going back to 1975. The rising ratio into 2025 showed that silver has been lagging the breakout in gold prices that started at the end of 2023. But the ratio reached historically elevated levels, and points to a mean-reverting move lower in which silver prices could significantly outperform gold.
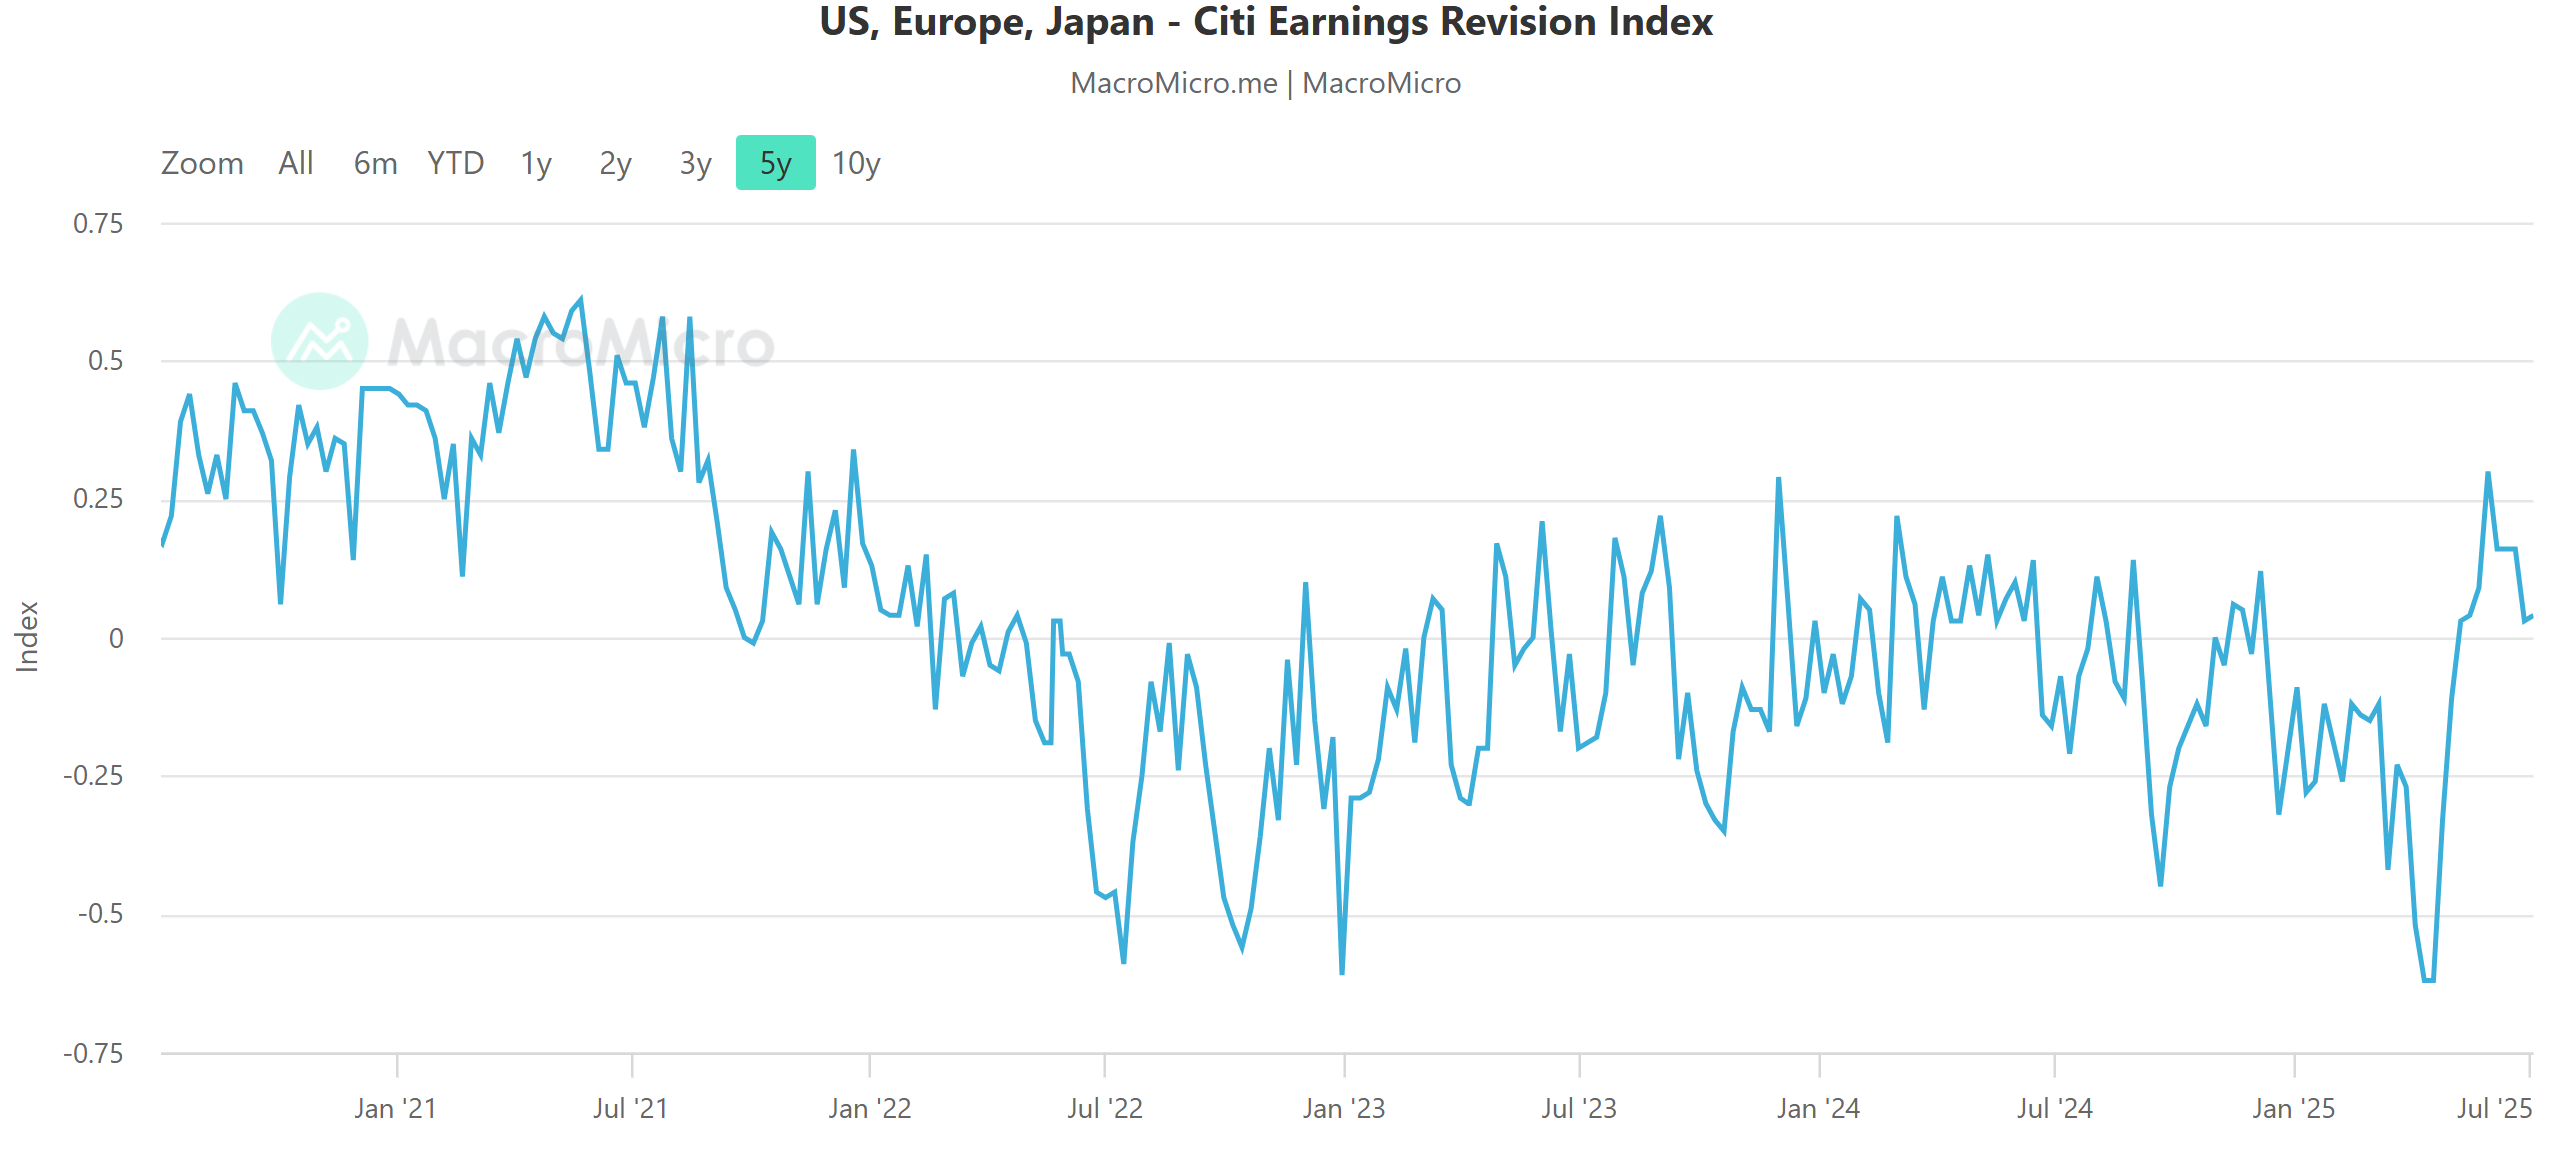
Despite the present (and recently rising) tensions around tariffs and the trade war, the S&P 500 has recovered completely from the selloff into early April and is once again making fresh record highs. Optimism around the earnings outlook is likely a key catalyst. The chart below shows the five-year history of an earning revisions index for the U.S., which looks at the proportion of companies seeing upward revisions to earnings relative to downward revisions. At the end of May, earnings revisions for U.S. companies jumped back into positive territory for the first time in 2025 and hit one of the highest levels going back to the start of 2022.
Despite the relatively high level of the fed funds rate, financial conditions are running near their loosest levels since this bull market started in late 2022. The chart below tracks a measure of financial conditions from the Chicago Fed district, where a reading below zero points to looser than average conditions. Indicators are measured across equity, debt, and money markets, with loose conditions highly correlated to economic growth. That suggests easy credit conditions overall despite high interest rates, and should be a tailwind for the economy and stock market.

Heard in the Hub
The Traders Hub features live trade alerts, market update videos, and other educational content for members.
Here’s a quick recap of recent alerts, market updates, and educational posts:
New positions and profit taking in the model portfolio.
Catalysts behind the U.S. dollar’s worst start since 1973.
The S&P 500’s record-setting recovery from bear market.
Why the dollar’s breakdown is bullish for risk-on sectors.
The textbook chart setup in Phibro Animal Health (PAHC).
You can follow everything we’re trading and tracking by becoming a member of the Traders Hub.
By becoming a member, you will unlock all market updates and trade alerts reserved exclusively for members.
👉You can click here to join now👈
Trade Idea
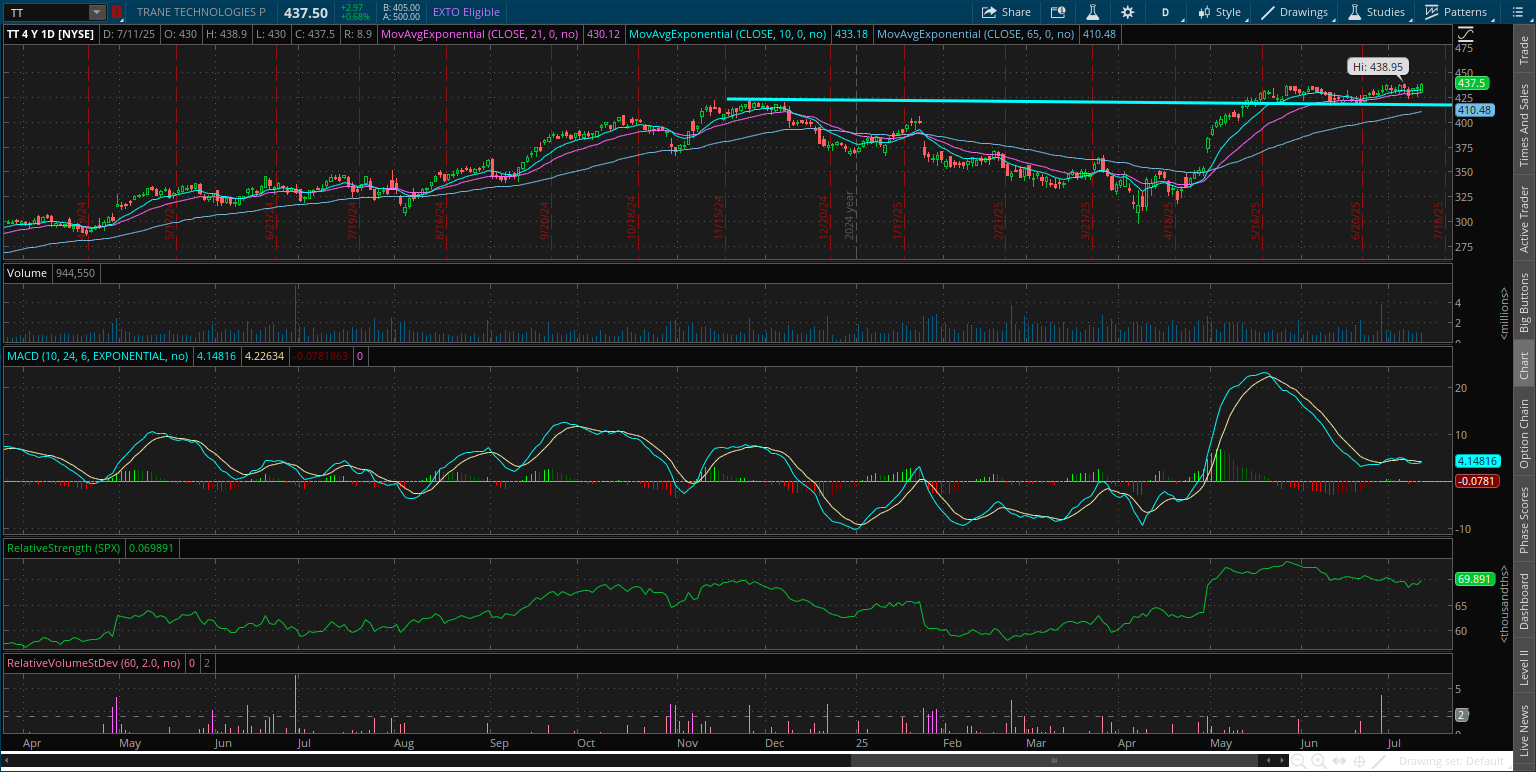
Trane Technologies (TT)
The stock recently jumped to a new high above the $420 level first hit back in November. The stock is trading in a tight range and consolidating the recent move higher, which is creating a base-on-base pattern. I’m now watching for a move over $440.
Key Upcoming Data
Economic Reports
Earnings Reports

I hope you’ve enjoyed The Market Mosaic, and please share this report with your family, friends, coworkers…or anyone that would benefit from an objective look at the stock market.
Become a member of the Traders Hub to unlock access to:
✅Model Portfolio
✅Members Only Chat
✅Trade Ideas & Live Alerts
✅Mosaic Vision Market Updates + More
Our model portfolio is built using a “core and explore” approach, including a Stock Trading Portfolio and ETF Investment Portfolio.
Come join us over at the Hub as we seek to capitalize on stocks and ETFs that are breaking out!
And if you have any questions or feedback, feel free to shoot me an email at mosaicassetco@gmail.com
Disclaimer: these are not recommendations and just my thoughts and opinions…do your own due diligence! I may hold a position in the securities mentioned in this report.