In this post, I’ll focus on setups that I’m monitoring for both long and short positions. With a chart and short write-up, this is a quick way to scan and plan potential trades.
These ideas are the end result of my process to identify stocks offering the right combination of growth fundamentals along with a proper chart setup.
Here are my notes from a focus list of setups I’m monitoring.
📢Before jumping into today’s chart report, I recently announced a new premium feature coming to my newsletter:
Mosaic Traders Hub
The Hub goes live on 10/28, and you can read all the details of what’s included here (plus several new features).
Bottom line: if you like my chart reports, then you’re going to love Mosaic Traders Hub!
Stock Market Update
While minutes from the Federal Reserve’s September meeting showed that central bank officials were aligned on the need to cut interest rates, agreement on the size of the cut was not universal. The Fed ultimately reduced rates by an outsized 0.50% last month, but several officials would have preferred a 0.25% reduction. One Fed governor even voted against the larger reduction, which was the first dissent on a rate vote from a governor since 2005. The disagreement shows that the pace and magnitude of further rate cuts will be uncertain, and will ultimately come down to incoming data on the labor market and inflation.
The most recent payrolls report, which showed the addition of 254,000 jobs in September, points to a strong labor market for now. So investor attention will turn toward updated inflation reports to finish out the week. The Consumer Price Index (CPI) is expected to come in at 2.3% year-over-year in September compared to 2.5% in the prior month. The core CPI measure that strips out food and energy prices is expected to hold steady at an increase of 3.2%. The chart below shows how headline CPI and its components have trended since 2022, along with estimates from the Cleveland Fed and inflation swaps for September’s figure.

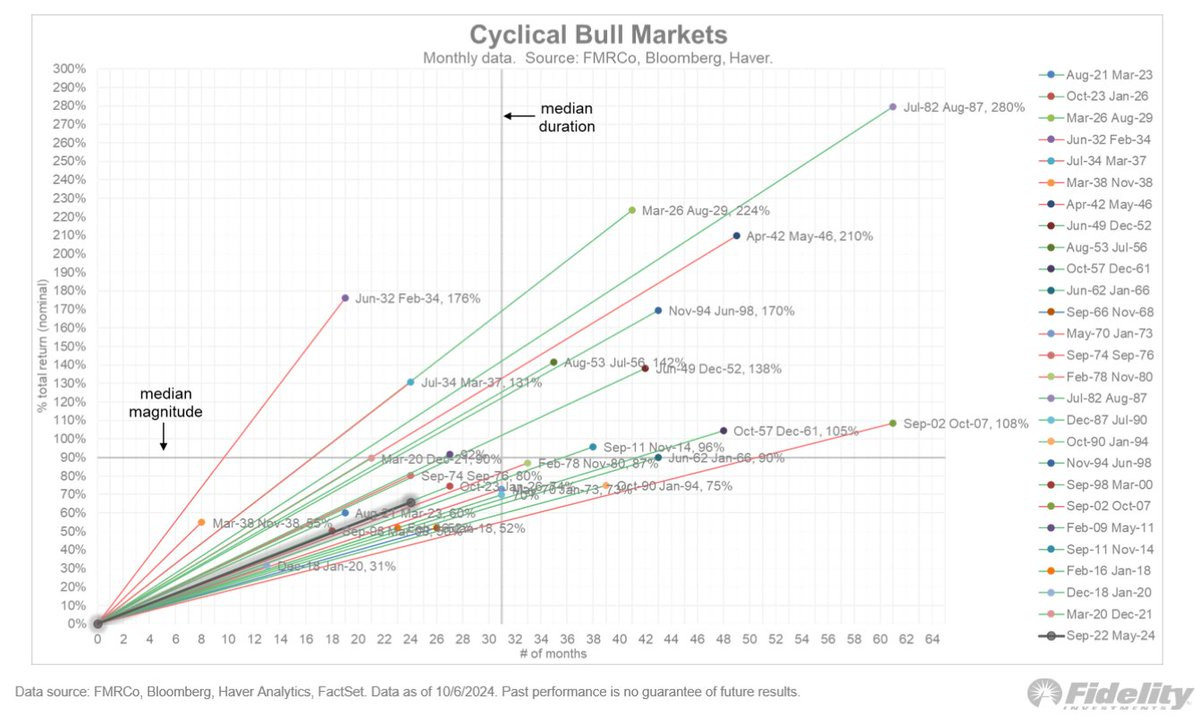
In this week’s Market Mosaic, I highlighted further comparisons to the current economic backdrop and the Fed’s easing path in 1995. The central bank ultimately had to limit rate cuts as the job market remained strong and progress on lowering inflation stalled out. Back then, a strong economy delivering corporate earnings growth drove the S&P 500 higher even though the Fed cut rates by less than 1.0%. Evidence that the economy is performing just fine this time around could keep pushing the S&P higher still. It’s also worth noting that the S&P 500 is coming up on the two year anniversary of the cyclical bull market that began in October 2022. As you can see in the chart below, there’s room for the S&P 500 to run based on the magnitude and duration of past cyclical bull markets.

Another positive sign on the current environment is that breakout setups are expanding and following through. We’ve seen several watchlist setups holding their breakout, which is a way of receiving feedback from the watchlist on the persistence of trend and momentum. Please note I’m also highlighting additional chart setups as they develop in the chat, which you can join following the link below. The chat will grow as an important source of additional trade ideas and market analysis once the Traders Hub is live later this month. We’re following the breakout action in HOOD in the chat, while I’m also removing NFLX from this watchlist as the stock holds the break out to complete its pattern.
Keep reading below for all the updates…
Long Trade Setups
TSM
Consolidating prior uptrend since peaking in July around $190. Making a series of smaller pullbacks as price is now testing resistance again at $190. Recent MACD reset at the zero line while the relative strength (RS) line remains near the high. Watching for a breakout over $190.
OSCR
IPO from 2021 that’s recently testing resistance around the $23 level. Making a smaller pullback so far off that level which is resetting the MACD at the zero line. The RS line is holding near the high. Watching for a move over $24.
TPH
After rallying to the $47 level in July, the stock has been consolidating gains. Recent series of smaller pullbacks off the $47 resistance level, while the RS line is holding near the high. I’m watching for a breakout over $47 on higher volume with confirmation by the RS line.
SHAK
Peaked at the $110 level back March, and creating a new basing pattern since then. Starting to make a series of higher lows following the pullback into July, with a recent MACD reset at zero just below price resistance. Watching for a move over $110.
WING
Peaked around $430 back in June, and now retesting that level again. Would like to see one more smaller pullback that creates a MACD hook before trying to breakout. Looking for confirmation by the RS line on a move over $430.
CCS
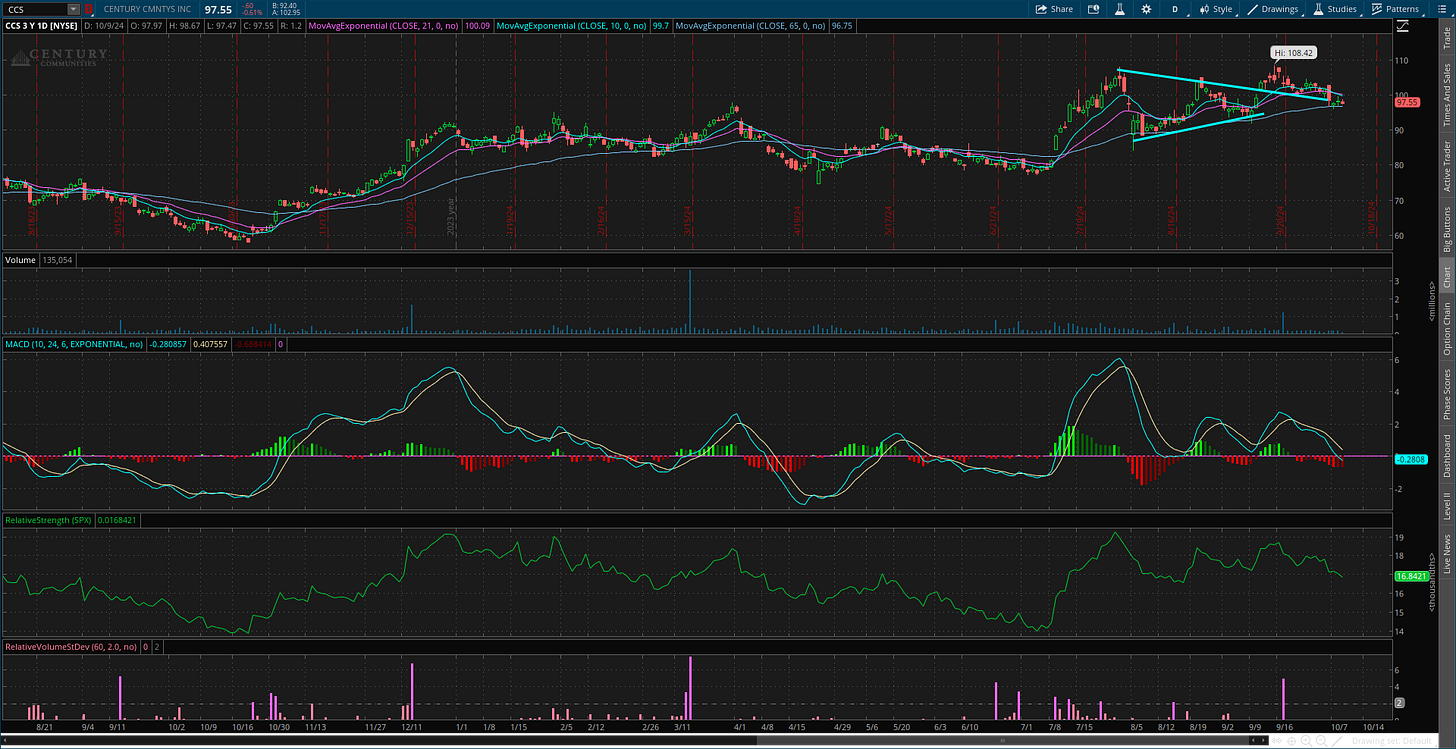
After moving over the $90 level, the stock back tested that area as support while creating a bullish pennant pattern. Moved out from the pennant, but was not confirmed by the RS line. Now back testing the pennant trendline as support.
CYBR
Trading sideways since February while testing resistance at the $280 level on three occasions. Price tried to move above the $280 level, but was not confirmed by the RS line and pulled back into the base. Will keep on watch as long as the most recent higher low at $260 holds.
FG
Broke out of a base back in November and rallied to the $48 area. Consolidating gains since the start of the year and recently rallying back toward $48. Want to see price hold support at the $35 level on any pullback.
Short Trade Setups
F
Rallying off a test of support at the $10 level. That reset the MACD below the zero line, while the RS line has stayed near the lows. Price now making a bearish flag pattern, with support at the $10.30 area. Watching for a break below the flag with confirmation by the RS line at new lows.
Rules of the Game
I trade chart breakouts based on the daily chart for long positions. And for price triggers on long setups, I tend to wait until the last half hour of trading to add a position. I find that emotional money trades the open, and smart money trades the close. If it looks like a stock is breaking out, I don’t want a “head fake” in the morning followed by a pullback later in the day.
I also use the RS line as a breakout filter. I find this improves the quality of the price signal and helps prevent false breakouts. So if price is moving out of a chart pattern, I want to see the RS line (the green line in the bottom panel of my charts) at new 52-week highs. Conversely, I prefer an RS line making new 52-week lows for short setups.
Also for long positions, I use the 21-day exponential moving average (EMA) as a stop. If in the last half hour of trading it looks like a position will close under the 21-day EMA, I’m usually selling whether it’s to take a loss or book a profit.
For short (or put) positions, I trade off a four-hour chart instead of a daily. Why? There’s a saying that stocks go up on an escalator and down on an elevator. Once a profitable trade starts to become oversold on the four-hour MACD, I start to take gains. Nothing like a short-covering rally to see your gains evaporate quickly, so I’m more proactive taking profits on short positions. I also use a 21-period EMA on the four-hour chart as a stop. If there is a close above the 21-period EMA, I tend to cover my short.
For updated charts, market analysis, and other trade ideas, give me a follow on X: @mosaicassetco
Disclaimer: these are not recommendations and just my thoughts and opinions…do your own due diligence! I may hold a position in the securities mentioned in this post.


That CYBR looks good.