In this post, I’ll focus on setups that I’m monitoring for both long and short positions. With a chart and short write-up, this is a quick way to scan and plan potential trades.
These ideas are the end result of my process to identify stocks offering the right combination of growth fundamentals along with a proper chart setup.
I’m showing members of the Traders Hub why I believe the next major bull market phase is underway. We’re taking advantage with high growth stocks, a play on Bitcoin, and other cyclical sectors breaking out.
You can sign up for a 7-day free trial here and unlock the trade ideas in this report as we ride the bull trend.
Stock Market Update
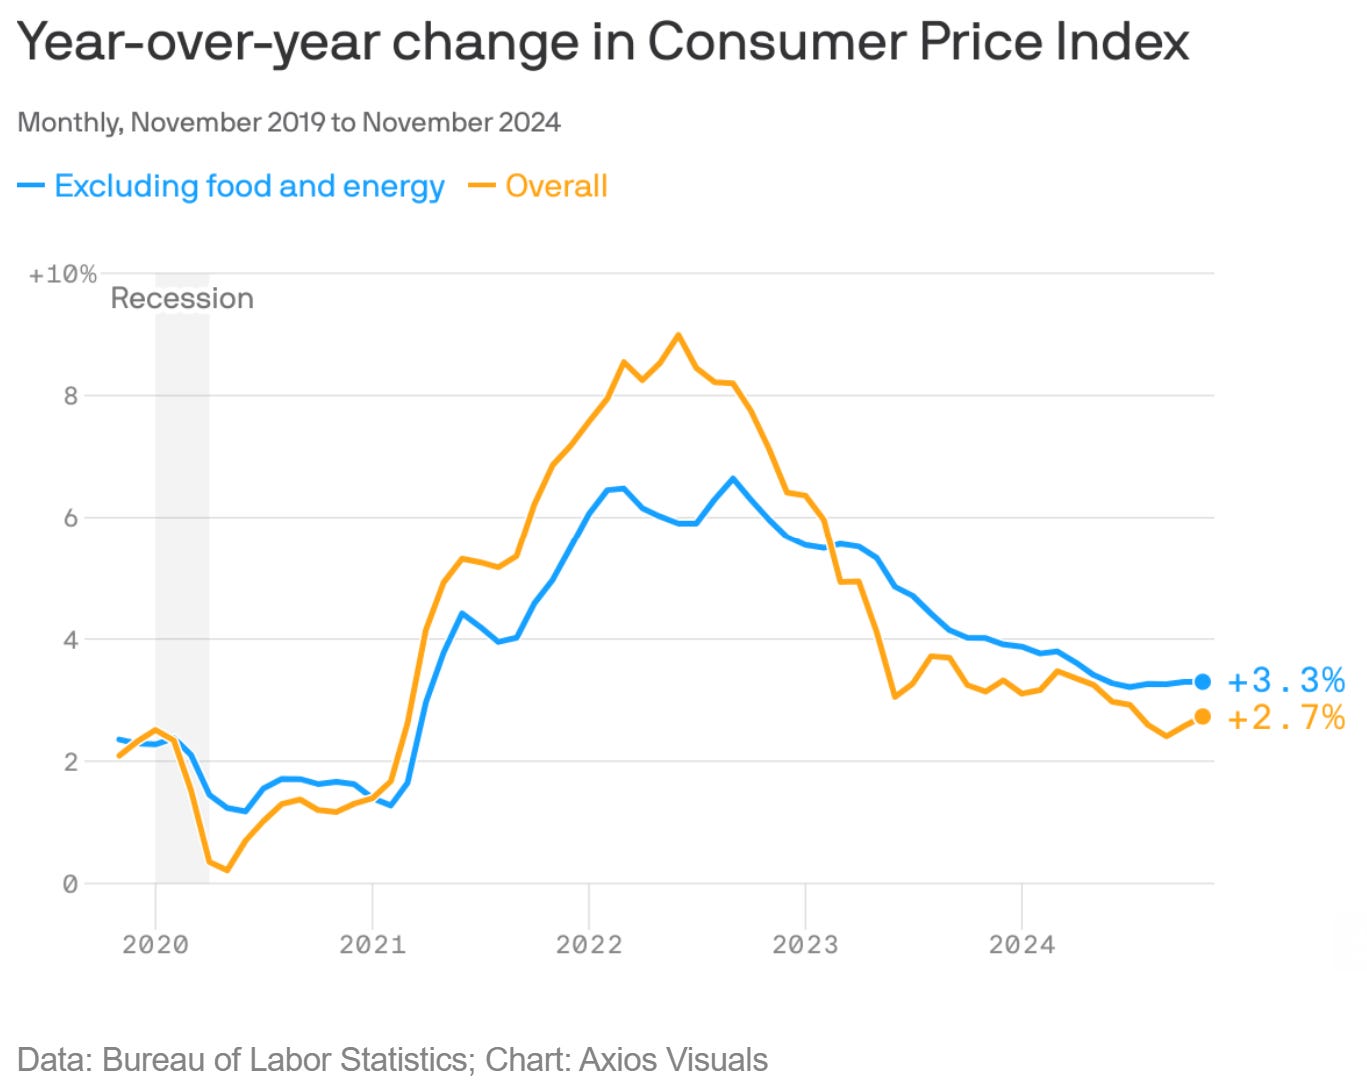
An updated report on consumer inflation has investors breathing a sigh of relief. The Consumer Price Index (CPI) rose by 2.7% during the month of November compared to last year (chart below). The core figure that strips out food and energy prices gained by 3.3%. Both figures were in line with economist estimates, while the core CPI increase matched the prior month. Inflation figures across various gauges have seen their yearly rate of change gain recently, so a lack of further acceleration in November’s core figure was cheered by investors.
Signs that consumer inflation pressures are trending sideways is a welcome development from central bank officials as well, and keeps further rate cuts by the Federal Reserve on the table. Odds are now locked in for another 0.25% cut by the Fed next week, while markets are predicting two more cuts to the fed funds rate based on the 2-year Treasury yield. The combination of an ongoing easing cycle, evidence of strong economic growth, and loose financial conditions continue to create a favorable backdrop for the bull market.
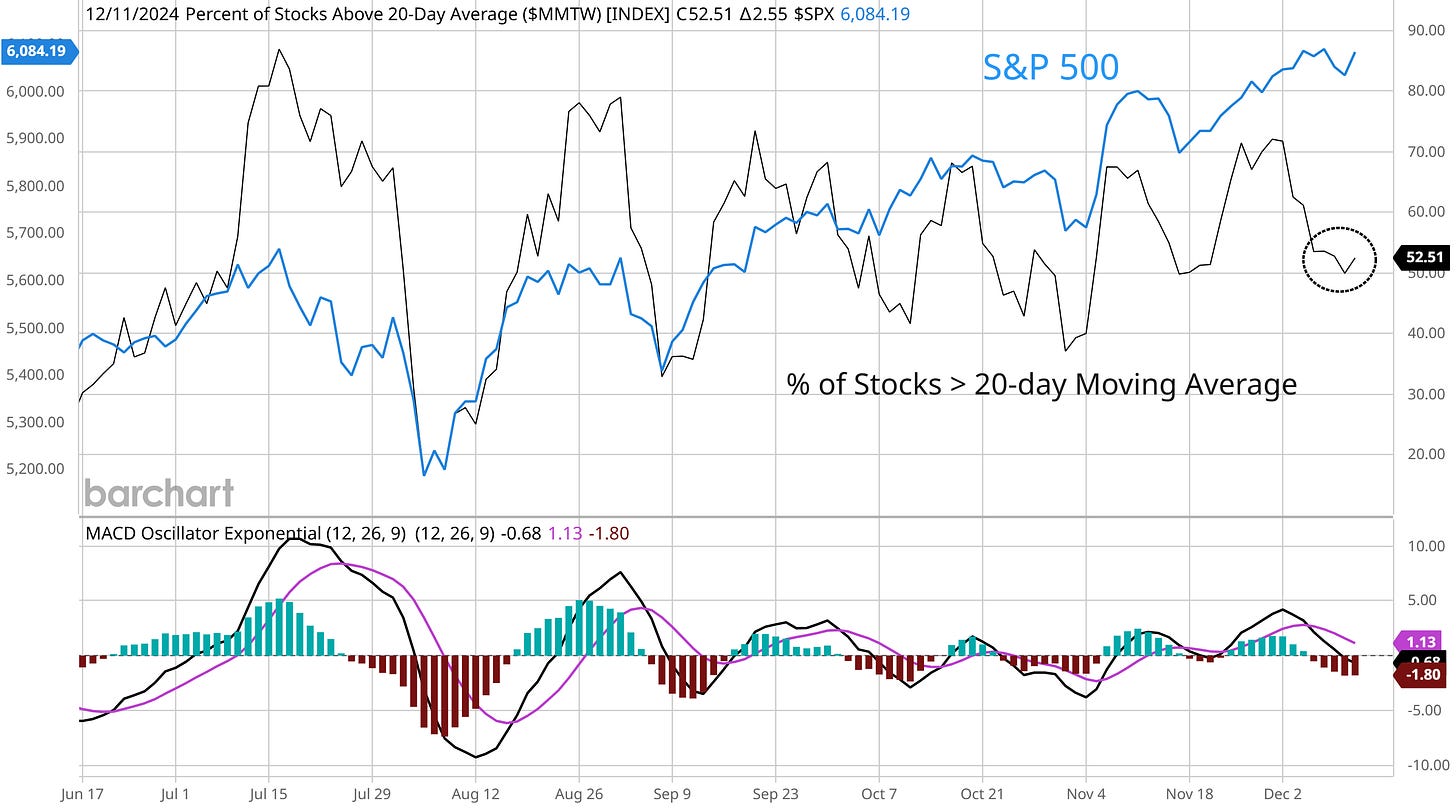
We’re also approaching the period marking the Santa Claus rally that runs from the final five trading days of the year through the first two days of the New Year. Historically, the period has delivered an average 1.4% return for the S&P 500 with a 79% win rate. But there are some signs that stocks could see a period of choppiness before the uptrend resumes. I shared with Hub members this week that the S&P 500 experiences mid-month volatility in December before finishing the year strong. You’re already seeing that with the average stock. The chart below shows the percent of stocks across major exchanges trading above their 20-day moving average (MA). Even as the S&P 500 is hovering near the highs, there has been a sharp pullback in the number of stocks trading in short-term uptrends and currently stands at just 52% (chart below).
At this point, I would continue to expect any short-term weakness to represent a pause in the larger uptrend. The factors mentioned above can keep driving the bull market well into next year, and is particularly bullish for small-caps as I covered in this week’s Market Mosaic. More positive signs of animal spirits could be generated in crypto markets, where I’m adding a new crypto trade idea to our watchlist of long setups.
Keep reading below to see:
Open ETF positions.
Open stock positions.
Chart analysis for new trade ideas.


