
Mosaic Chart Alerts
A warning signal for the S&P 500 means it's time to be cautious.

Welcome back to Mosaic Chart Alerts!
In this newsletter, I’ll focus on the best setups that I’m monitoring for both long and short positions. With a chart and short write-up, this is a quick way to scan and plan potential trades.
These ideas are the end result of my process to identify stocks offering the right combination of fundamentals along with a proper chart setup.
Here are my notes from a shortlist of setups I’m monitoring.
Stock Market Update
The past week has featured an onslaught of news driving plenty of volatility in the stock market. January payrolls, an FOMC rate-setting meeting, and now this week we have a slew of Federal Reserve speakers commenting on the path of further rate hikes. But I showed you last week how to tune out the noise and follow the message being told by the stock market. The hot start to 2023 by important cyclical sectors is a key driver behind the ongoing rally despite the headlines offering plenty of excuses to sell.
But for the first time this year, a look at stock market internals is giving reasons to be cautious. I noted in last week’s Market Mosaic that investor sentiment was becoming too bullish, which is a contrarian signal when there is too much greed in the stock market. On its own, I don’t get too concerned about excessive bullishness among investors. But I do place a greater weight on that signal when it’s accompanied by deteriorating breadth conditions…which is now developing.
The chart below shows the percent of stocks trading above their 20-day moving average, which is a way to gauge how many stocks are trading in short-term uptrends. Notice how fewer stocks (black line) are supporting the S&P 500’s rally (blue line) since around mid-January. The last time we saw a similar signal was the start of December, when the S&P went on to fall by 6%.

Last year, this type of signal made me extremely cautious on implementing new trades and quick to exit open positions. But as I mentioned above, this year has seen a bullish character change in the stock market thus far. I still won’t hold a position that closes below the 21-day EMA, but I am giving recent breakouts room to consolidate instead of being quick to sell. And we’ve seen plenty of breakouts over the past week. I’m removing MCHP, HUBG, TRNS, and SNA from our long watchlist as their chart setups completed. The same goes for EQT on the short watchlist as support levels give way. That means there are several new additions to the watchlist this week.
Keep reading below for all the updates…
Long Trade Setups
BE
Renewable energy stock that peaked two years ago and has tested trendline resistance on three instances. On this recent test, MACD is resetting at the zero line while RS is near the 52-week high. Watching for a move over the $26-$27 area.

SEDG
Trading in a wide range since early 2021. A pause in the rally since mid-October is creating a bullish pennant continuation pattern. Watching for a breakout over the $335 area, while longer-term momentum could also support a move to new highs.

APH
Sitting just below trendline resistance around the $82 level. Recent MACD reset while the RS line is holding near the highs. I expect a breakout would first test the prior high just under $88.

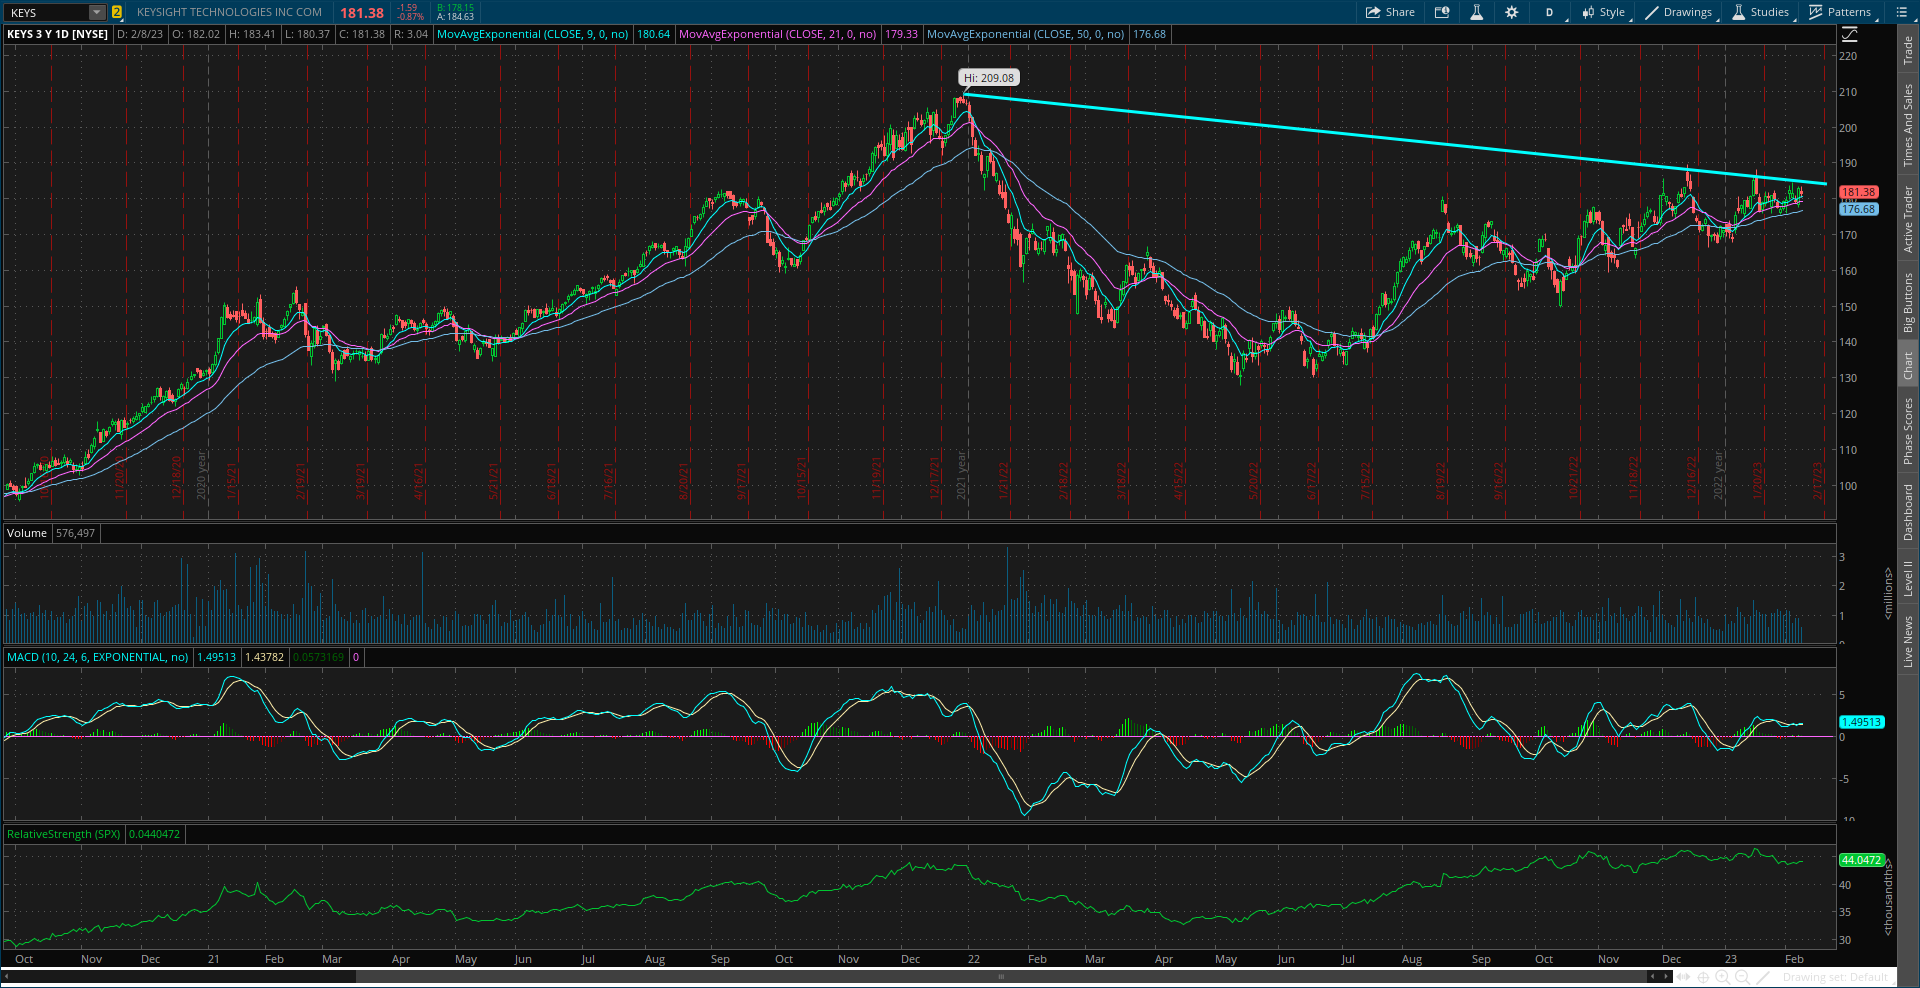
KEYS
Semiconductor stock that’s near trendline resistance at the $185 level. The MACD is resetting at the zero line, while a breakout could set up a test of the prior highs around $210.
ETD
Got the breakout over $30 on a jump in volume. Price is currently backtesting the breakout level, where I do not want to see this stock fall back into the pattern.

RNGR
Price finally moving over the $11.50 resistance level. Last two days are testing the breakout level. Similar to ETD, don’t wan to see price fall back inside the pattern which would indicate a failed breakout.

Short Trade Setups
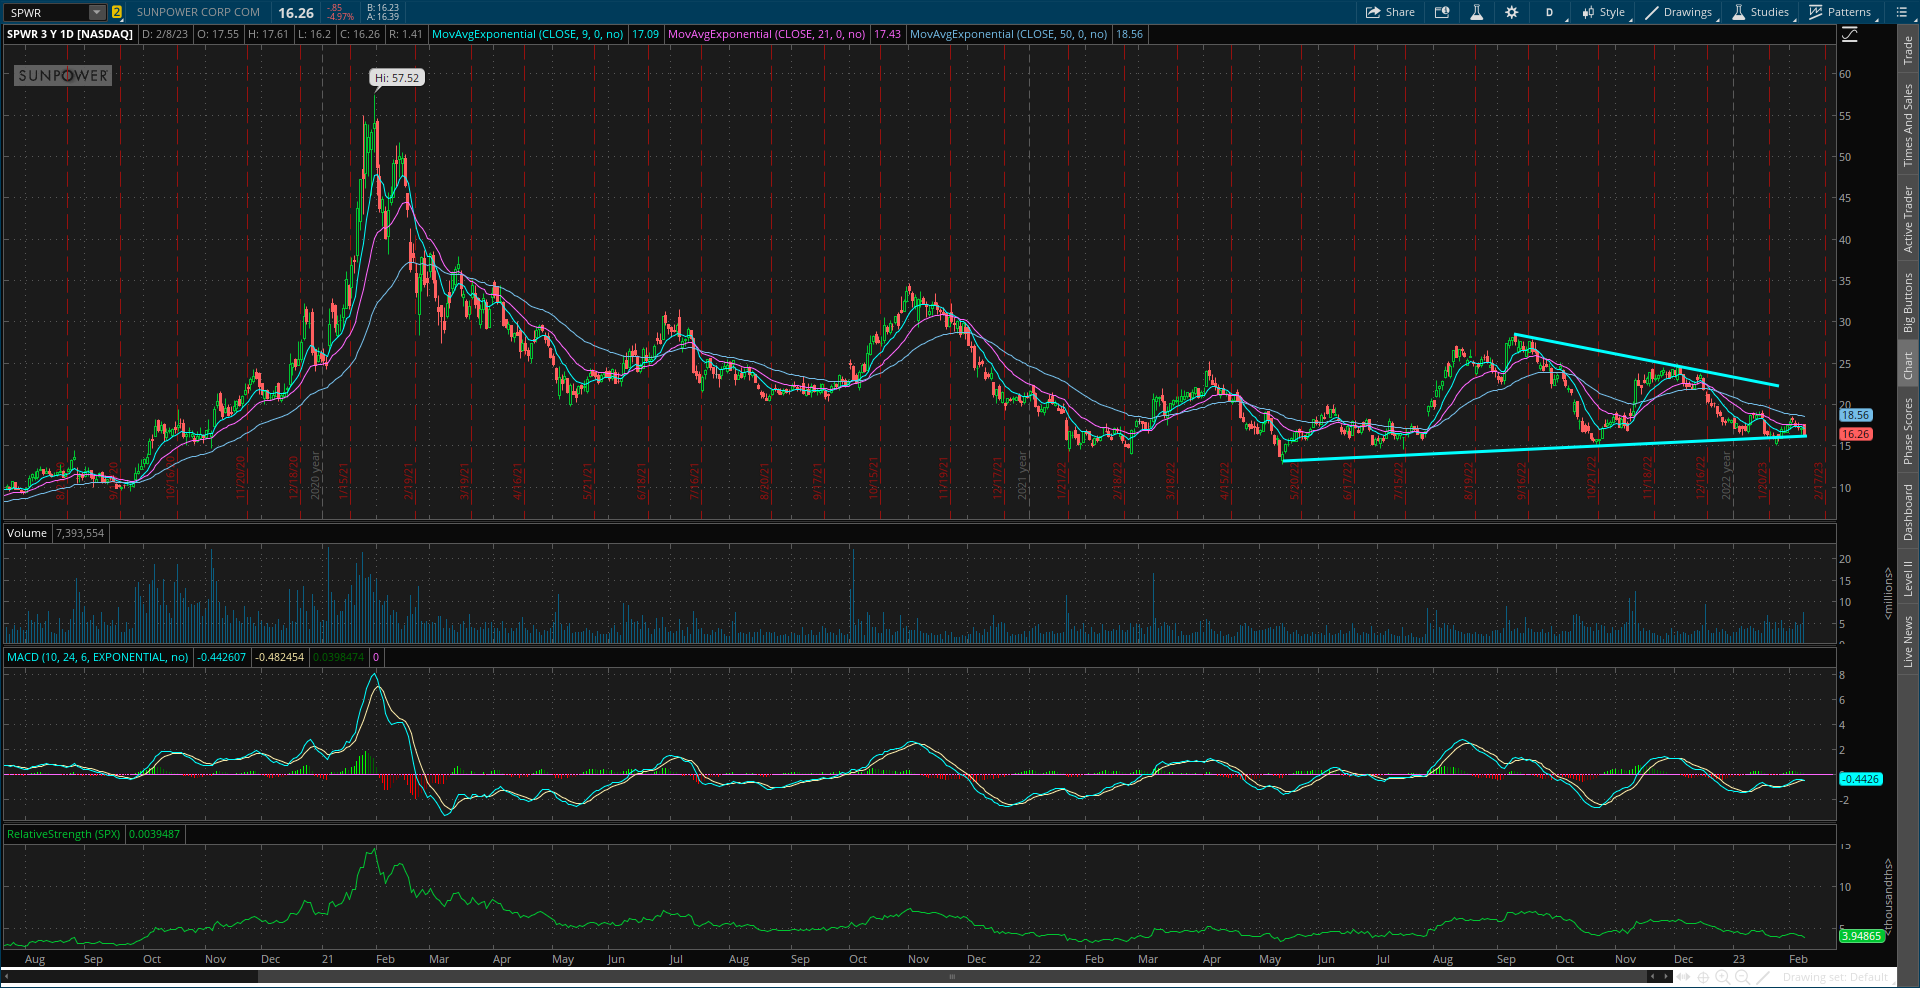
SPWR
Testing trendline support around the $16 level following a MACD reset just below the zero line. At the same time, RS line is close to making new lows.
SBOW
Creating a support level around $24 that’s being tested again. Recent reset of the MACD below the zero line and move lower in the relative strength line could see support give way this time.

RUN
Creating a bearish triangle continuation pattern. Watching for a close below trendline support around the $24 level.

MOS
Will keep on watch for another week. Want to see price move back below moving averages and MACD turn back lower to test support around the $43 level.

Rules of the Game
If you haven’t noticed yet, I trade breakouts! I trade based on the daily chart for long positions. And for price triggers on long setups, I tend to wait until the last half hour of trading to add a position. I find that emotional money trades the open, and smart money trades the close. If it looks like a stock is breaking out, I don’t want a “head fake” in the morning followed by a pullback later in the day.
Also for long positions, I use the 21-day exponential moving average (EMA) as a stop. If in the last half hour of trading it looks like a position will close under the 21-day EMA, I’m usually selling whether it’s to take a loss or book a profit.
For short (or put) positions, I trade off a four-hour chart instead of a daily. Why? There’s a saying that stocks go up on an escalator and down on an elevator. Once a profitable trade starts to become oversold on the four-hour MACD, I start to take gains. Nothing like a short-covering rally to see your gains evaporate quickly, so I’m more proactive taking profits on short positions. I also use a 21-period EMA on the four-hour chart as a stop. If there is a close above the 21-period EMA, I tend to cover my short.
For updated charts, market analysis, and other trade ideas, give me a follow on twitter: @mosaicassetco
Disclaimer: these are not recommendations and just my thoughts and opinions…do your own due diligence! I may hold a position in the securities mentioned in this newsletter.