

Welcome back to Mosaic Chart Alerts!
In this post, I’ll focus on setups that I’m monitoring for both long and short positions. With a chart and short write-up, this is a quick way to scan and plan potential trades.
These ideas are the end result of my process to identify stocks offering the right combination of fundamentals along with a proper chart setup.
Here are my notes from a focus list of setups I’m monitoring.
Stock Market Update
Over the past week, I’ve been highlighting the growing presence of negative divergences across the stock market. That includes breadth as fewer stocks are participating in the rally, and momentum as technical indicators built on price like the S&P 500’s RSI are showing lower highs at key resistance levels. It’s also worth noting that we’re entering a historically weak stretch for the S&P 500 based on seasonal trends of the past 20 years. You can see that in the chart below that after a positive start in January, the second half of the month tends to see a pullback before resuming the rally in February.

While the larger cap indexes like the S&P 500 and Nasdaq Composite are starting to weaken further today, small-caps as measured by the Russell 2000 Index are now down 8% from the late-December peak. That’s more representative of what’s happening with the average stock across the market, and now there are signs of oversold conditions emerging. Take another look at the percent of stocks trading above their 20-day moving average (MA) across the market in the chart below. This was one of my primary breadth indicators flashing a negative divergence even as the S&P 500 was testing the highs last week (circled area). But this indicator is now down to 24% and quickly approaching oversold levels, while the MACD in the bottom panel is extended to the downside as well. Ideally, a positive divergence develops to hint that the average stock is ready to resume the uptrend.

As I discussed in this week’s Market Mosaic, while there have been growing signs that the S&P 500 could pullback, I’m still viewing any decline as a pause in the overall uptrend. Overbought conditions gave way negative breadth divergences while excessive bullish sentiment also built up. Now it’s time to monitor for conditions that can support a rally, while also focusing on a watchlist of chart setups showing relative strength and carving out sound basing patterns. That next round of breakout setups is fertile ground for new trading opportunities when the market starts rallying again. For this week, I’m removing TNK as the stock holds above chart resistance that I’ve been tracking. There’s a new addition and several updates to the watchlist charts.
Keep reading below for all the updates…
Long Trade Setups
SPOT
After breaking out from a larger basing pattern over the $185 level, price recently back tested that level as support. That created a new base while resetting the MACD, with the relative strength (RS) line near a two year high. Watching for the uptrend to resume with a move over $200.

HUBS
Testing the $580-585 area several times since peaking at that level in July. Recent MACD reset at the zero line, while the RS line is holding up well. A breakout over $585 could potentially target the prior highs from 2021 around $850.

MELI
Recently bouncing off support at the 50-day MA to set up another test of the $1,640 level. Would prefer to see more basing action before trying to take out that level. A breakout can target the prior highs near the $1,950 area.

SMCI
Consolidating since August, while making a series of higher lows since September with the first resistance level at around $320. That level was taken out last week and being tested today. Now watching for a move to new highs over $350.

APP
Trading in a range since September with resistance at the $44 level. Notice the MACD making higher lows on each pullback in that range. Would prefer the see the RS line strengthen before attempting to breakout.

ARCH
Creating a resistance level near $175 since September. Recent MACD reset at the zero line with price still holding near the highs. Currently struggling with the $175 level while the RS line is not confirming.

MDB
Basing since July while creating a resistance level around $435. Part of a larger pattern going back to 2022 with a similar resistance level. Recent MACD drop below the zero line not ideal, but can recover. A breakout can target the prior highs around $590.

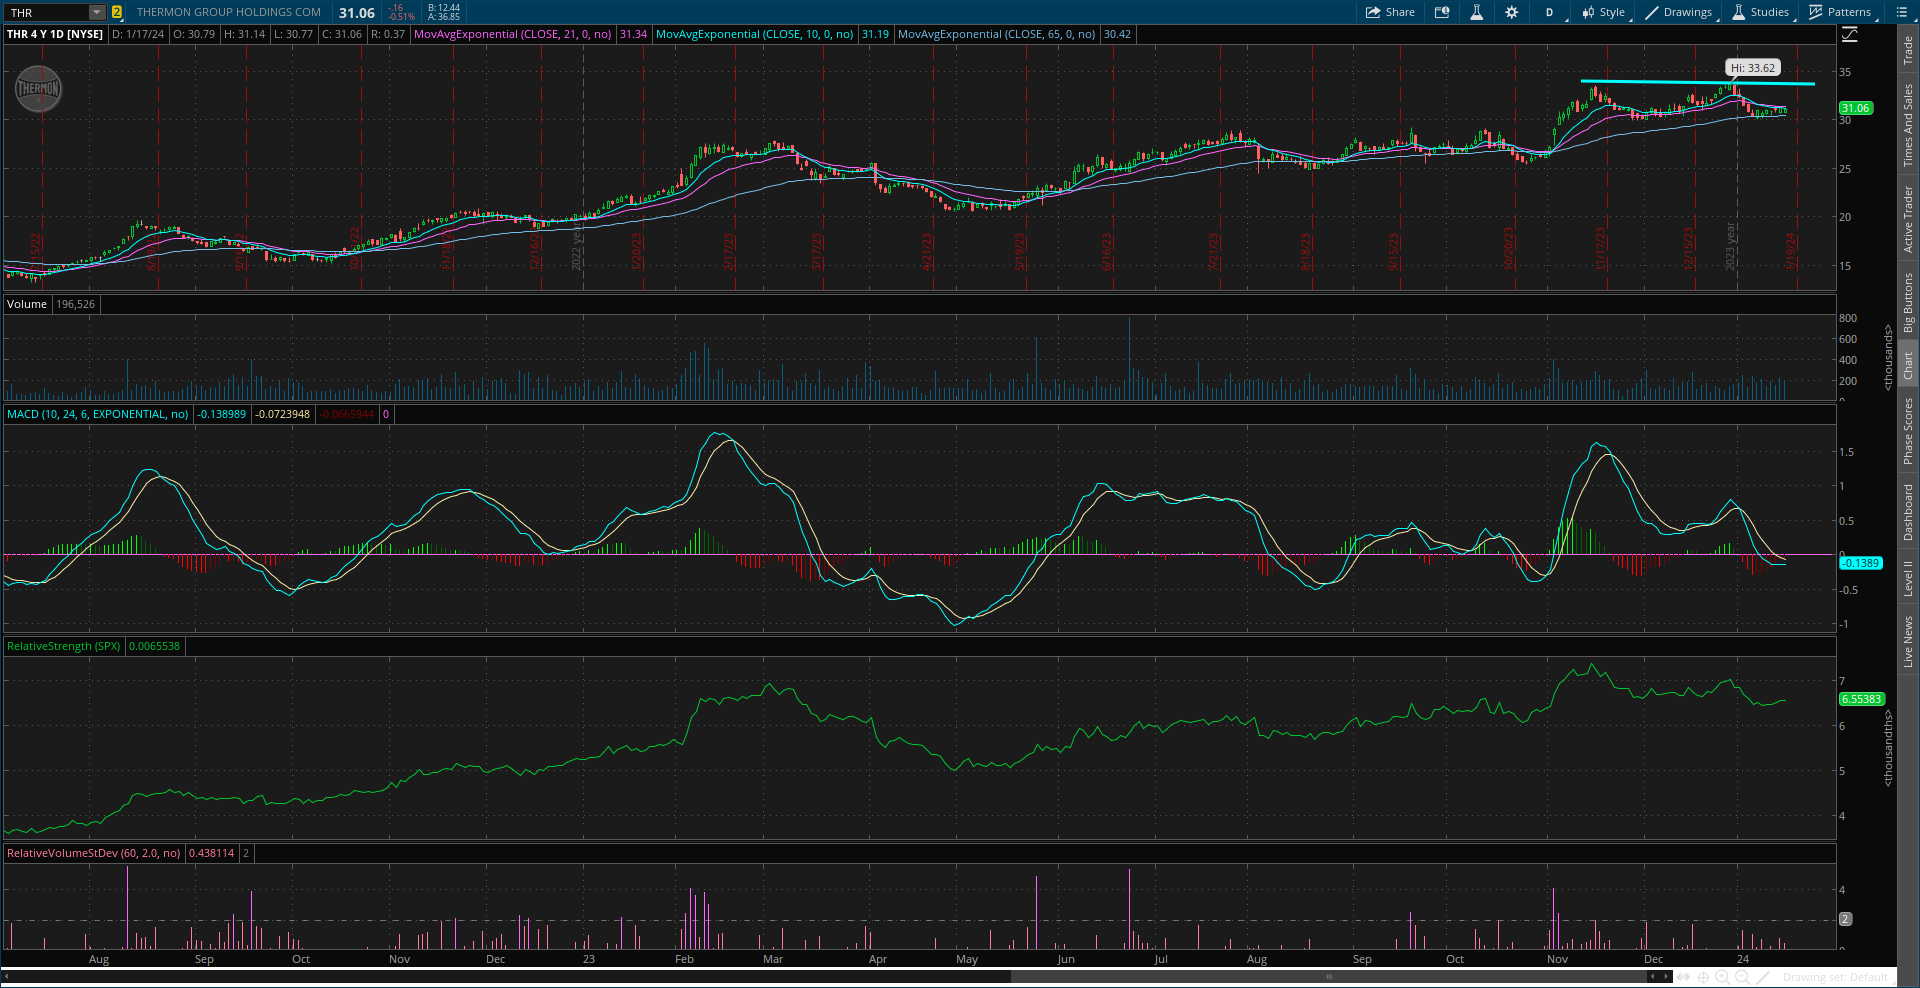
THR
Broke out over $29 from an ascending triangle at the start of November. Now basing above that pattern and back testing support. Watching for the uptrend to resume with a move above $33.
RMBS
Recently testing resistance at the prior high around $70. MACD extended on that test, now a small retracement of the rally since October. That's resetting the MACD back at the zero line. Now watching for a breakout over $70 with the RS line at new highs.

GES
Pulled back after reporting earnings. Will keep on the watchlist for now as long as support at $20 holds. Still watching resistance at $24, which is a level tested several times going back to 2021. Series of higher lows since last October’s bottom. A breakout could target the prior high near $29.

Short Trade Setups
None this week!
Rules of the Game
I trade chart breakouts based on the daily chart for long positions. And for price triggers on long setups, I tend to wait until the last half hour of trading to add a position. I find that emotional money trades the open, and smart money trades the close. If it looks like a stock is breaking out, I don’t want a “head fake” in the morning followed by a pullback later in the day.
I also use the RS line as a breakout filter. I find this improves the quality of the price signal and helps prevent false breakouts. So if price is moving out of a chart pattern, I want to see the RS line (the green line in the bottom panel of my charts) at new 52-week highs. Conversely, I prefer an RS line making new 52-week lows for short setups.
Also for long positions, I use the 21-day exponential moving average (EMA) as a stop. If in the last half hour of trading it looks like a position will close under the 21-day EMA, I’m usually selling whether it’s to take a loss or book a profit.
For short (or put) positions, I trade off a four-hour chart instead of a daily. Why? There’s a saying that stocks go up on an escalator and down on an elevator. Once a profitable trade starts to become oversold on the four-hour MACD, I start to take gains. Nothing like a short-covering rally to see your gains evaporate quickly, so I’m more proactive taking profits on short positions. I also use a 21-period EMA on the four-hour chart as a stop. If there is a close above the 21-period EMA, I tend to cover my short.
For updated charts, market analysis, and other trade ideas, give me a follow on X: @mosaicassetco
Disclaimer: these are not recommendations and just my thoughts and opinions…do your own due diligence! I may hold a position in the securities mentioned in this post.
Great article as always - I am taking the other side of the trade on this as I see the NAS 100 as still very rich on many metrics - for a short term set up I would agree things maybe a bit oversold but for the quarter ( depending on earnings of course ) I can’t see the NAS going too much higher than a few % at best from here - I like your analysis but I’m going to argue that the fundamentals have gotten ahead of themselves
And technically I think we are a bit due for a pullback
With that said - I rarely make a trade without looking at your posts
Great stuff - I need to read up on the McClellan O
I usually look at the MACD and Stoc and ADX
Along w the 8/13 EMAs for day trades