

In this post, I’ll focus on setups that I’m monitoring for both long and short positions. With a chart and short write-up, this is a quick way to scan and plan potential trades.
These ideas are the end result of my process to identify stocks offering the right combination of growth fundamentals along with a proper chart setup.
You can sign up for a 7-day free trial here to unlock the model portfolio and trade ideas in this report.
Stock Market Update
A hotter than expected report on the Consumer Price Index (CPI) is delivering the latest sign of accelerating inflation. For the month of January, the headline CPI increased by 3.0% compared to last year while the core measure that strips out food and energy prices increased by 3.3% (chart below that also shows the three- and six-month annualized rates). Both measures were higher than expected, while the 0.5% monthly increase was the largest since August 2023. Following the report, Federal Reserve Chair Jerome Powell stated that “we want to keep policy restrictive for now” in remarks to Congress. Market-implied odds now point to just one rate cut happening later this year.

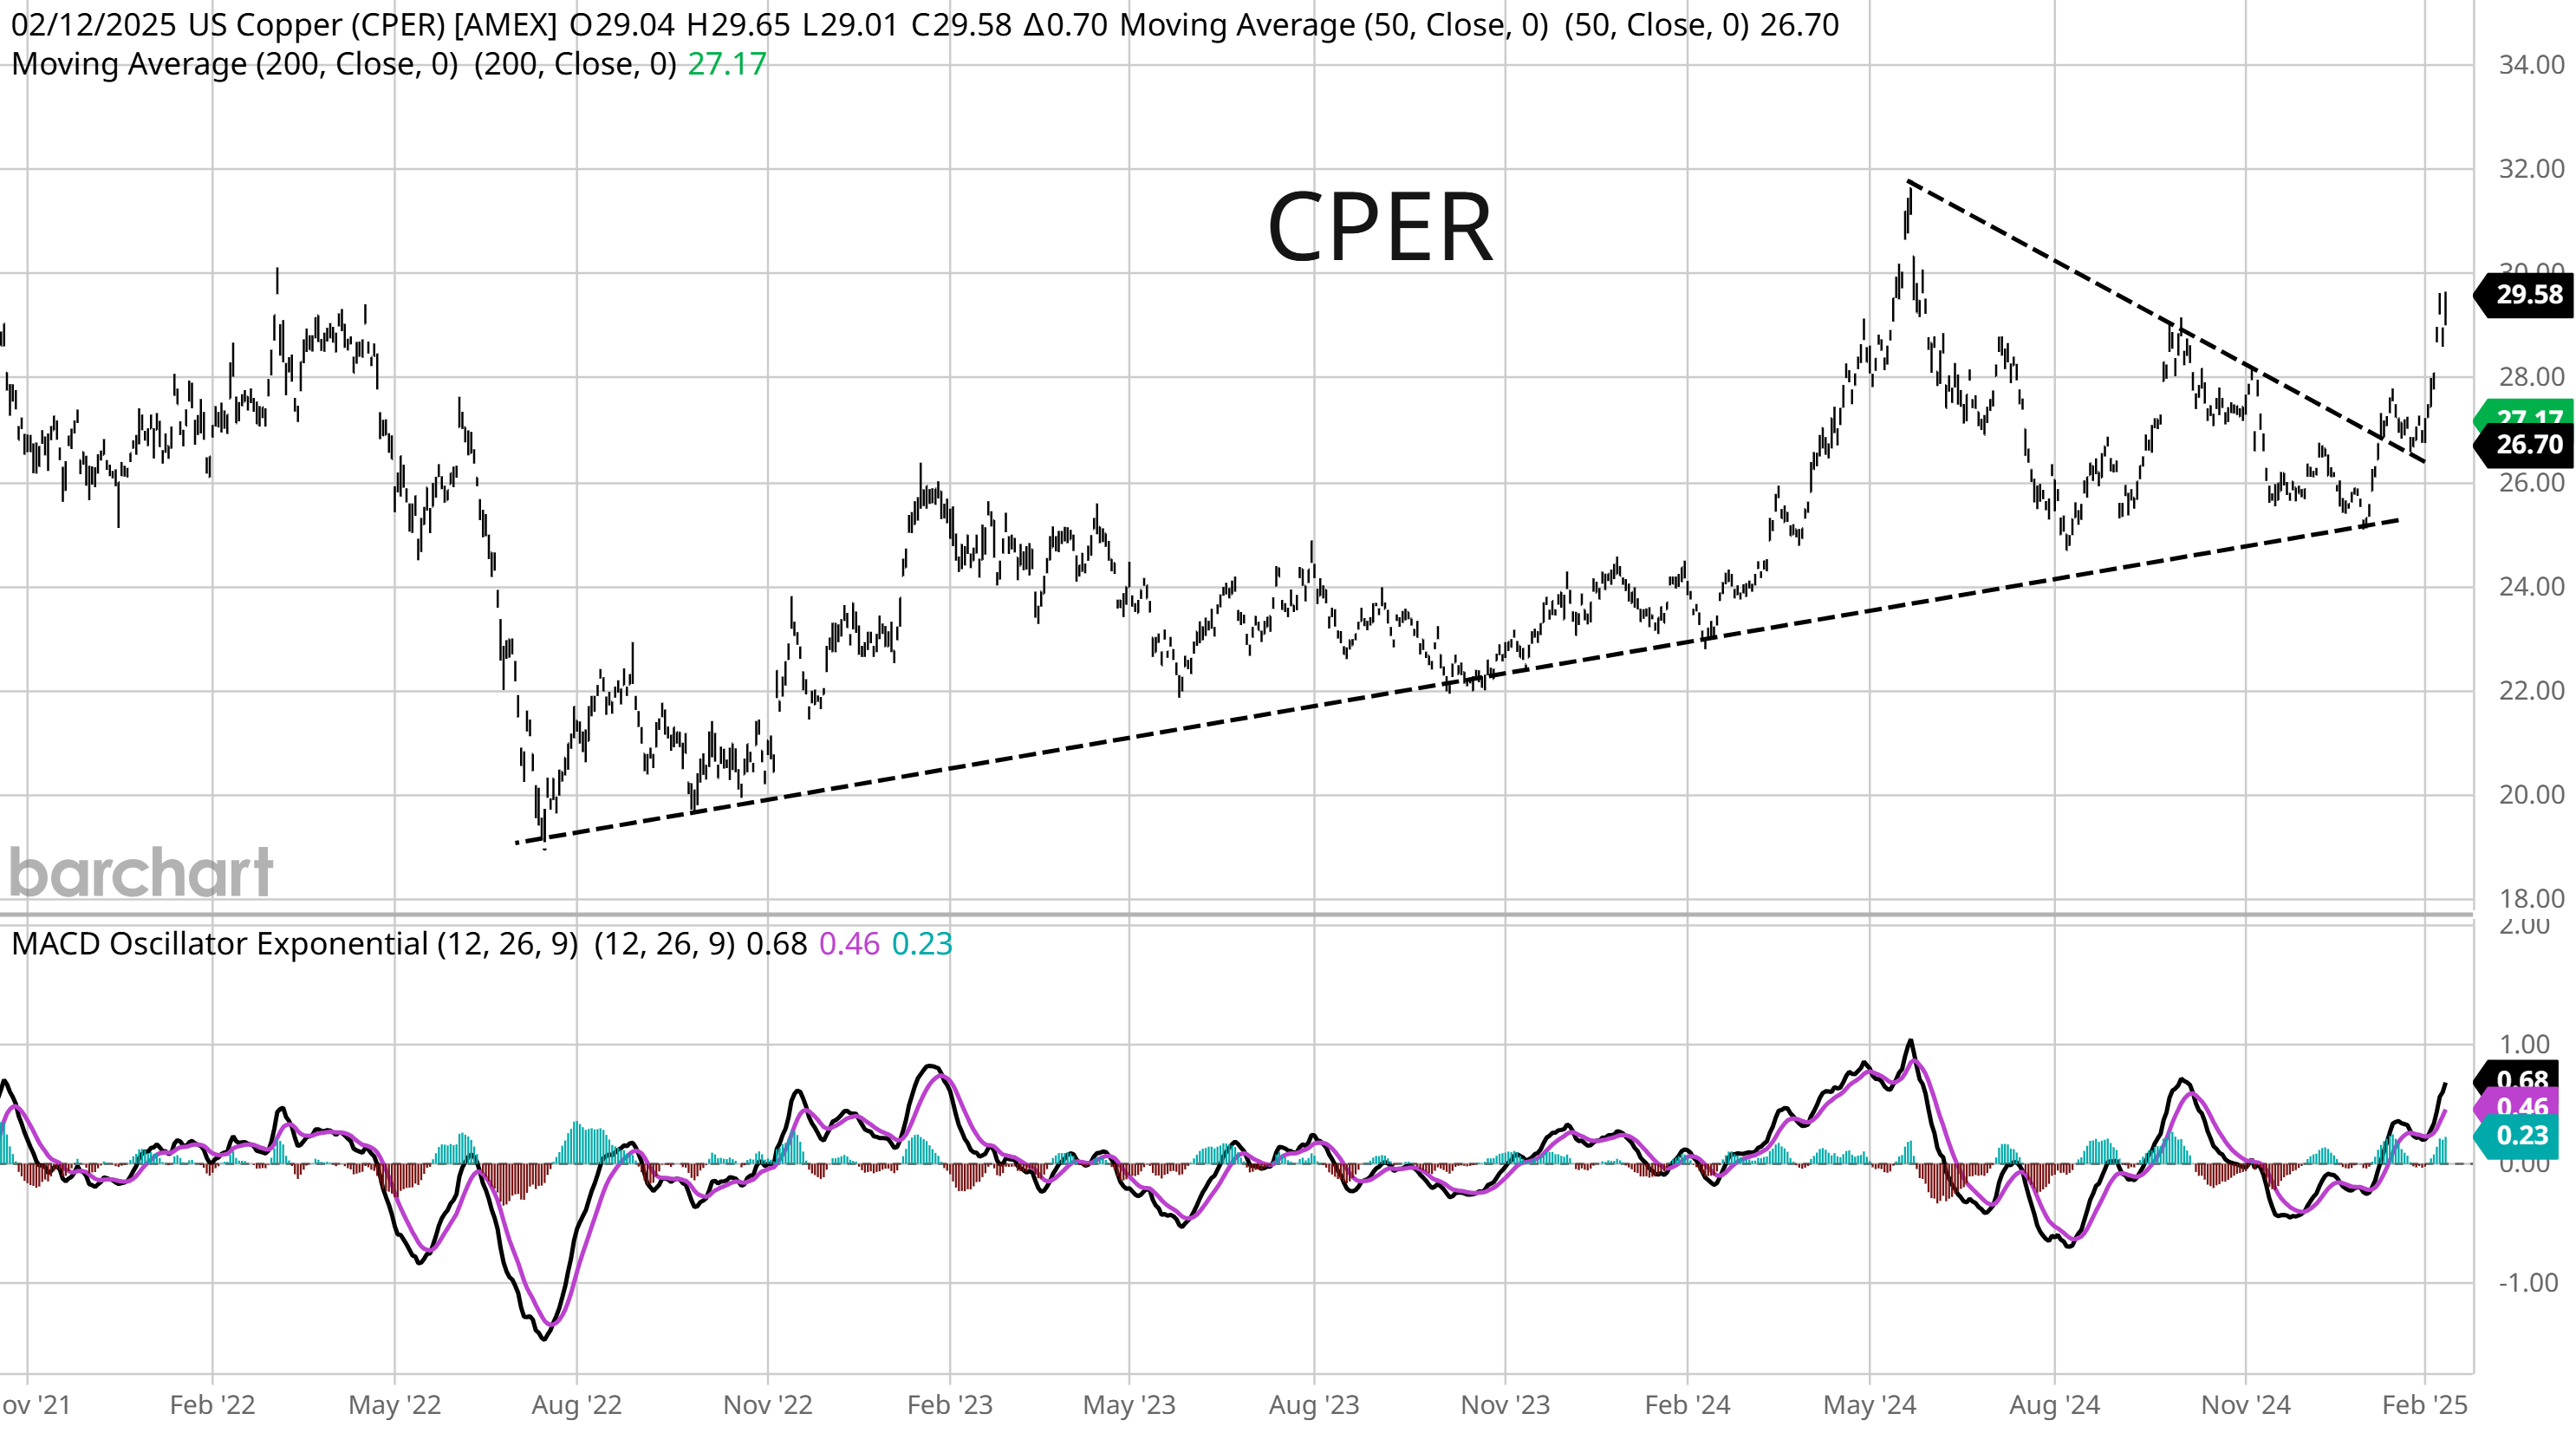
That marks the fourth consecutive month that headline CPI has moved higher since the disinflation trend bottomed out last September. Leading indicators of inflation have already been pointing the way higher as I’ve covered in recent reports. That includes the Producer Price Index (PPI), where the yearly rate of change bottomed back in June 2023. The updated PPI will also be released this week which will hold important clues for the inflation outlook. At the same time, commodities highly correlated to inflation are breaking out or setting up to do so. That includes copper prices with the United States Copper Index Fund (CPER) chart below. After breaking out from a triangle continuation pattern, CPER back tested the breakout then resumed the rally. As noted in my weekend report, copper prices are highly correlated with inflation breakeven rates.
The knee-jerk stock market reaction to the CPI report was for stocks to sell off. That’s due to the implications for the interest rate outlook, with a Fed forced to stay on hold. But looking past the daily gyrations and noise, the stock market can keep building on its gains so long as the earnings picture stays intact. In my video update for Hub members this week, I reviewed one indicator pointing to increased economic activity in the months ahead which also bodes well for S&P 500 forward returns.
Keep reading below to see:
Open ETF positions.
Open stock positions.
Chart analysis for 9 trade ideas.
