

In this post, I’ll focus on setups that I’m monitoring for both long and short positions. With a chart and short write-up, this is a quick way to scan and plan potential trades.
These ideas are the end result of my process to identify stocks offering the right combination of growth fundamentals along with a proper chart setup. Live alerts are sent to Traders Hub members only.
Stock Market Update
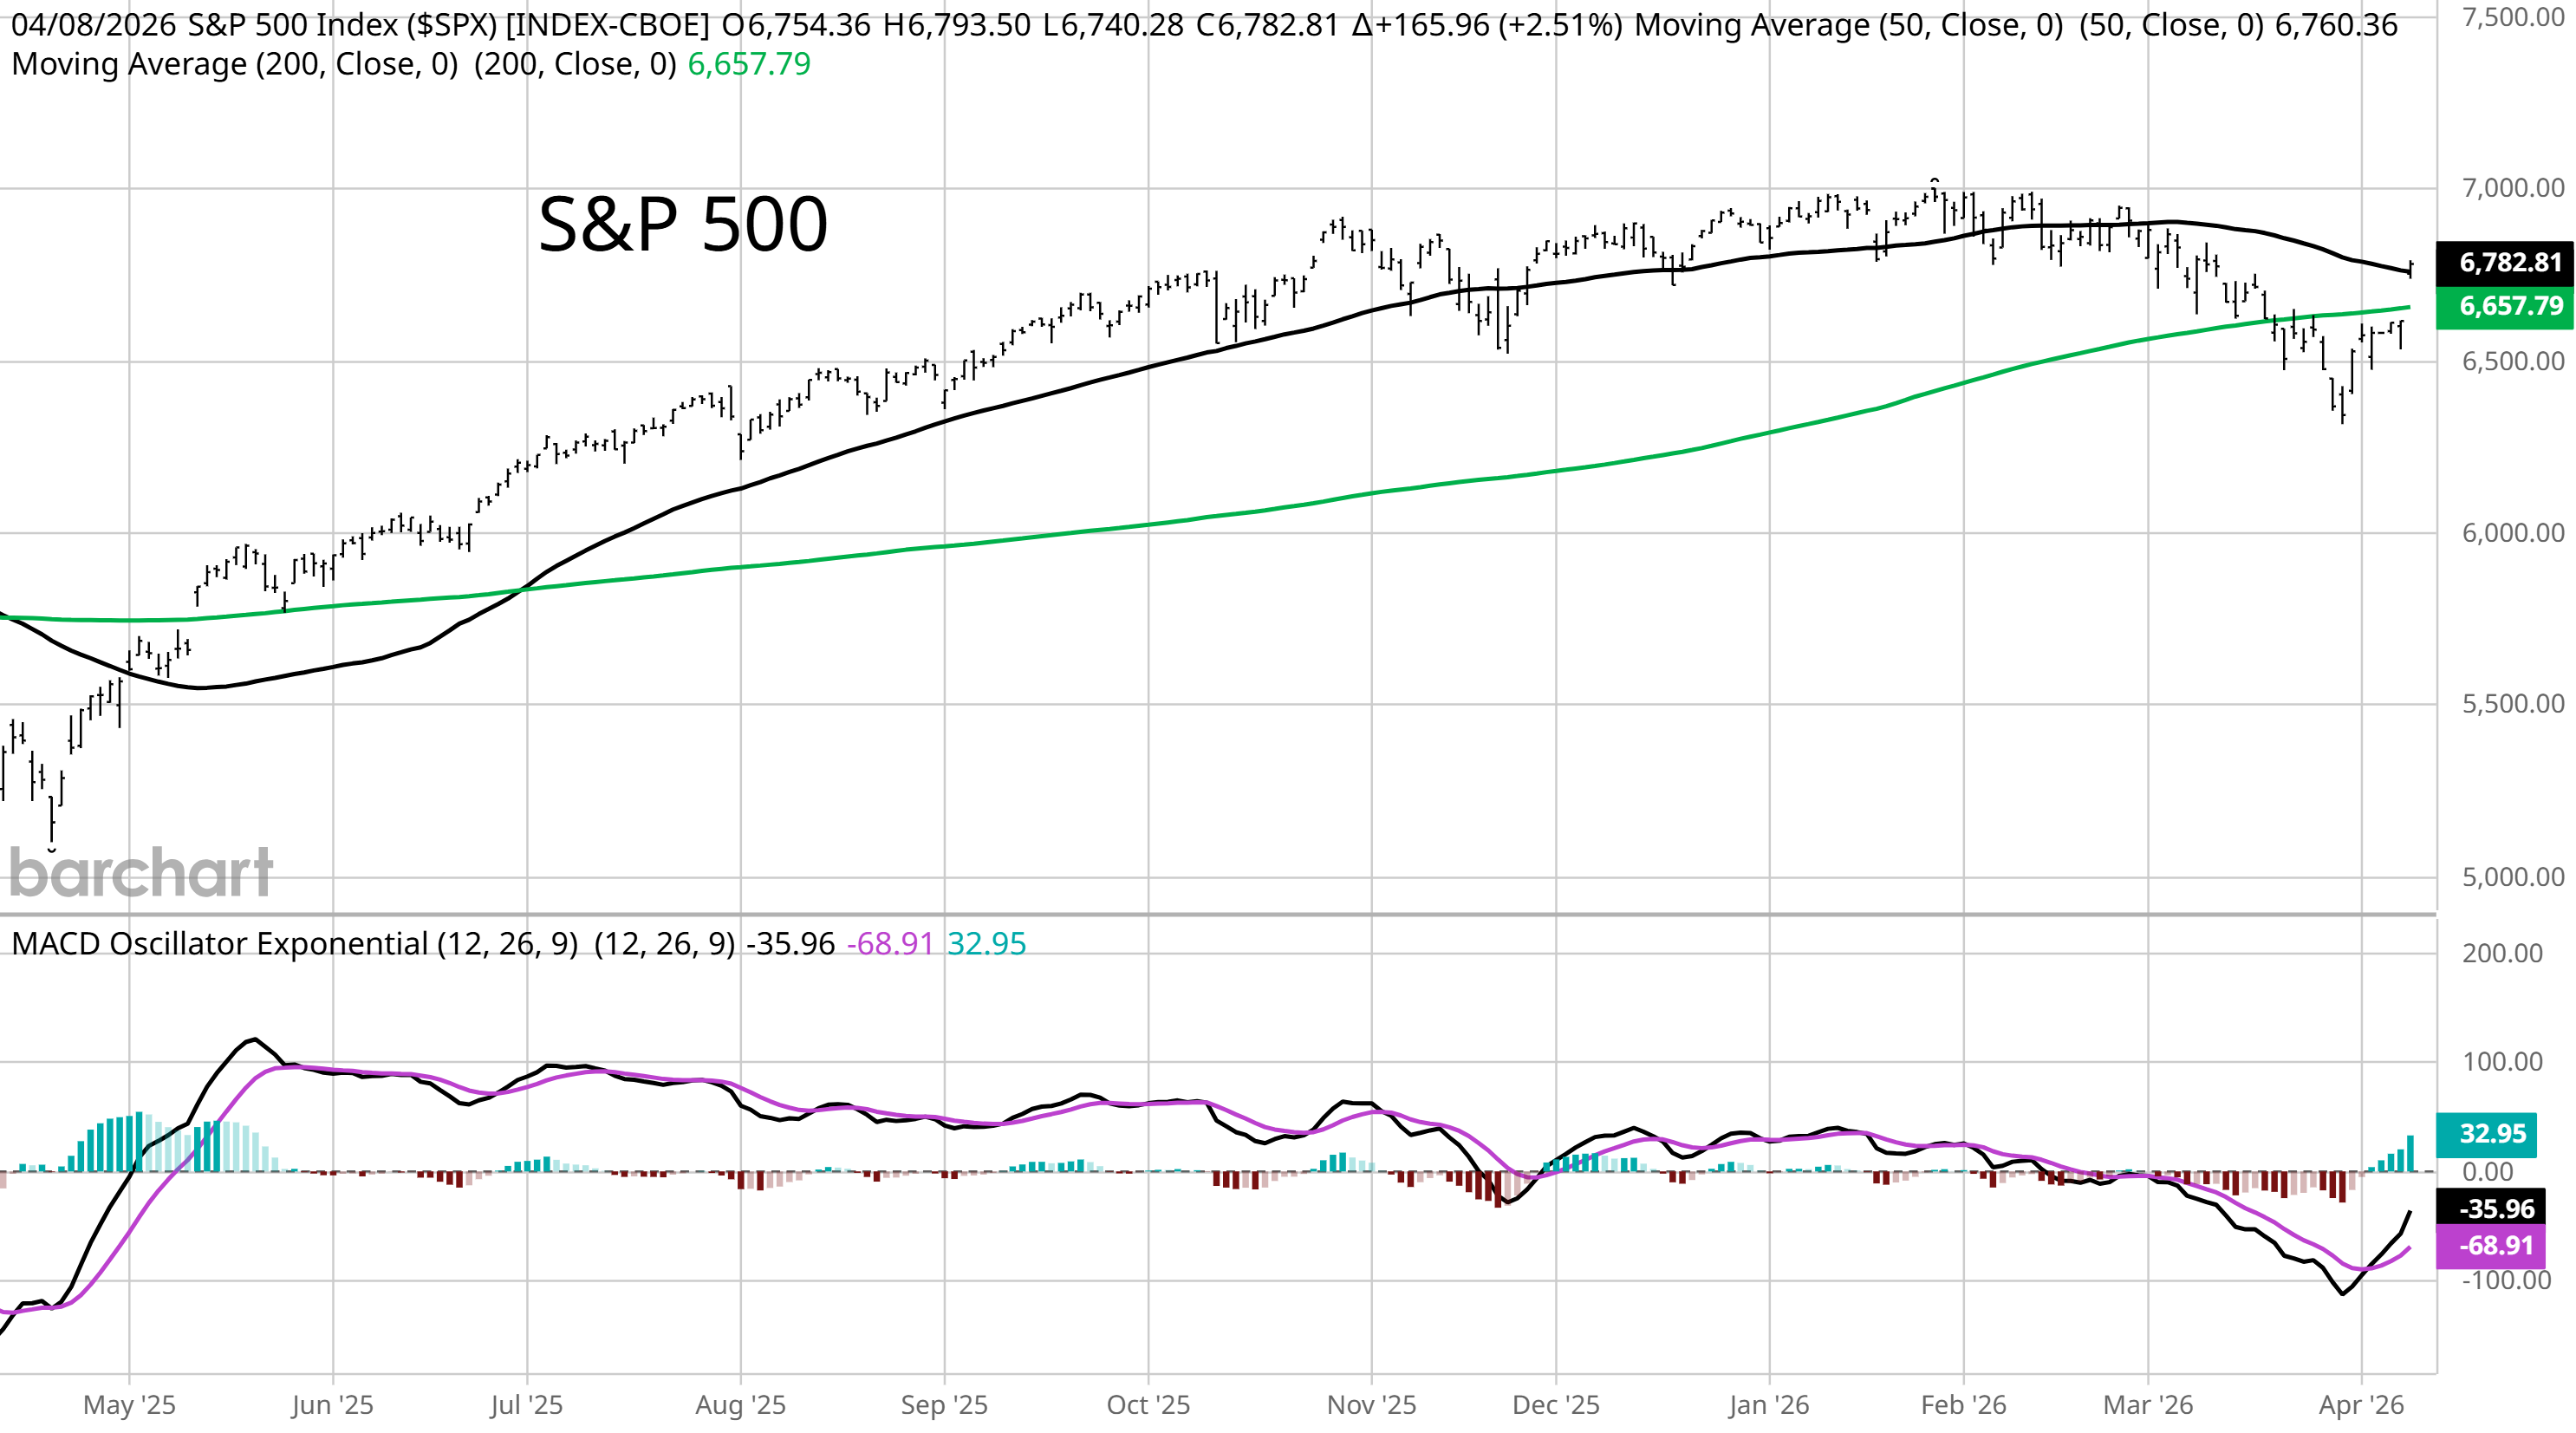
A (fragile) two week ceasefire between the U.S. and Iran delivered the spark that ignited bullish conditions recently building. The combination of oversold breadth, positive divergences, and bearish sentiment and positioning provided the right ingredients to see a massive rally unfold. As I highlighted in Sunday’s Market Mosaic, the presence of positive breadth divergences was only adding to the bullish setup over the near-term. The ceasefire and potential reopening of the Strait of Hormuz helped drive a massive rebound that saw the S&P 500 recover key moving averages (MAs) on a huge opening gap. The chart below shows the S&P gapping above both the 200-day MA (green line) and 50-day MA (black line) in a single trading session.
The situation might feel familiar with the one-year anniversary of the stock market’s recovery from the trade war and subsequent pause on tariffs. While follow through on the rebound remains to be seen, it’s worth noting that breadth statistics on yesterday’s advance fell well short of the thrusts trigged one year ago. The chart below shows the ratio of advancing stocks to declining stocks on the NYSE. That ratio finished the day at 4.4 compared to 37.2 last year that helped trigger several breadth thrust indicators, which typically bodes well for the S&P 500’s forward returns looking ahead on longer time frames.
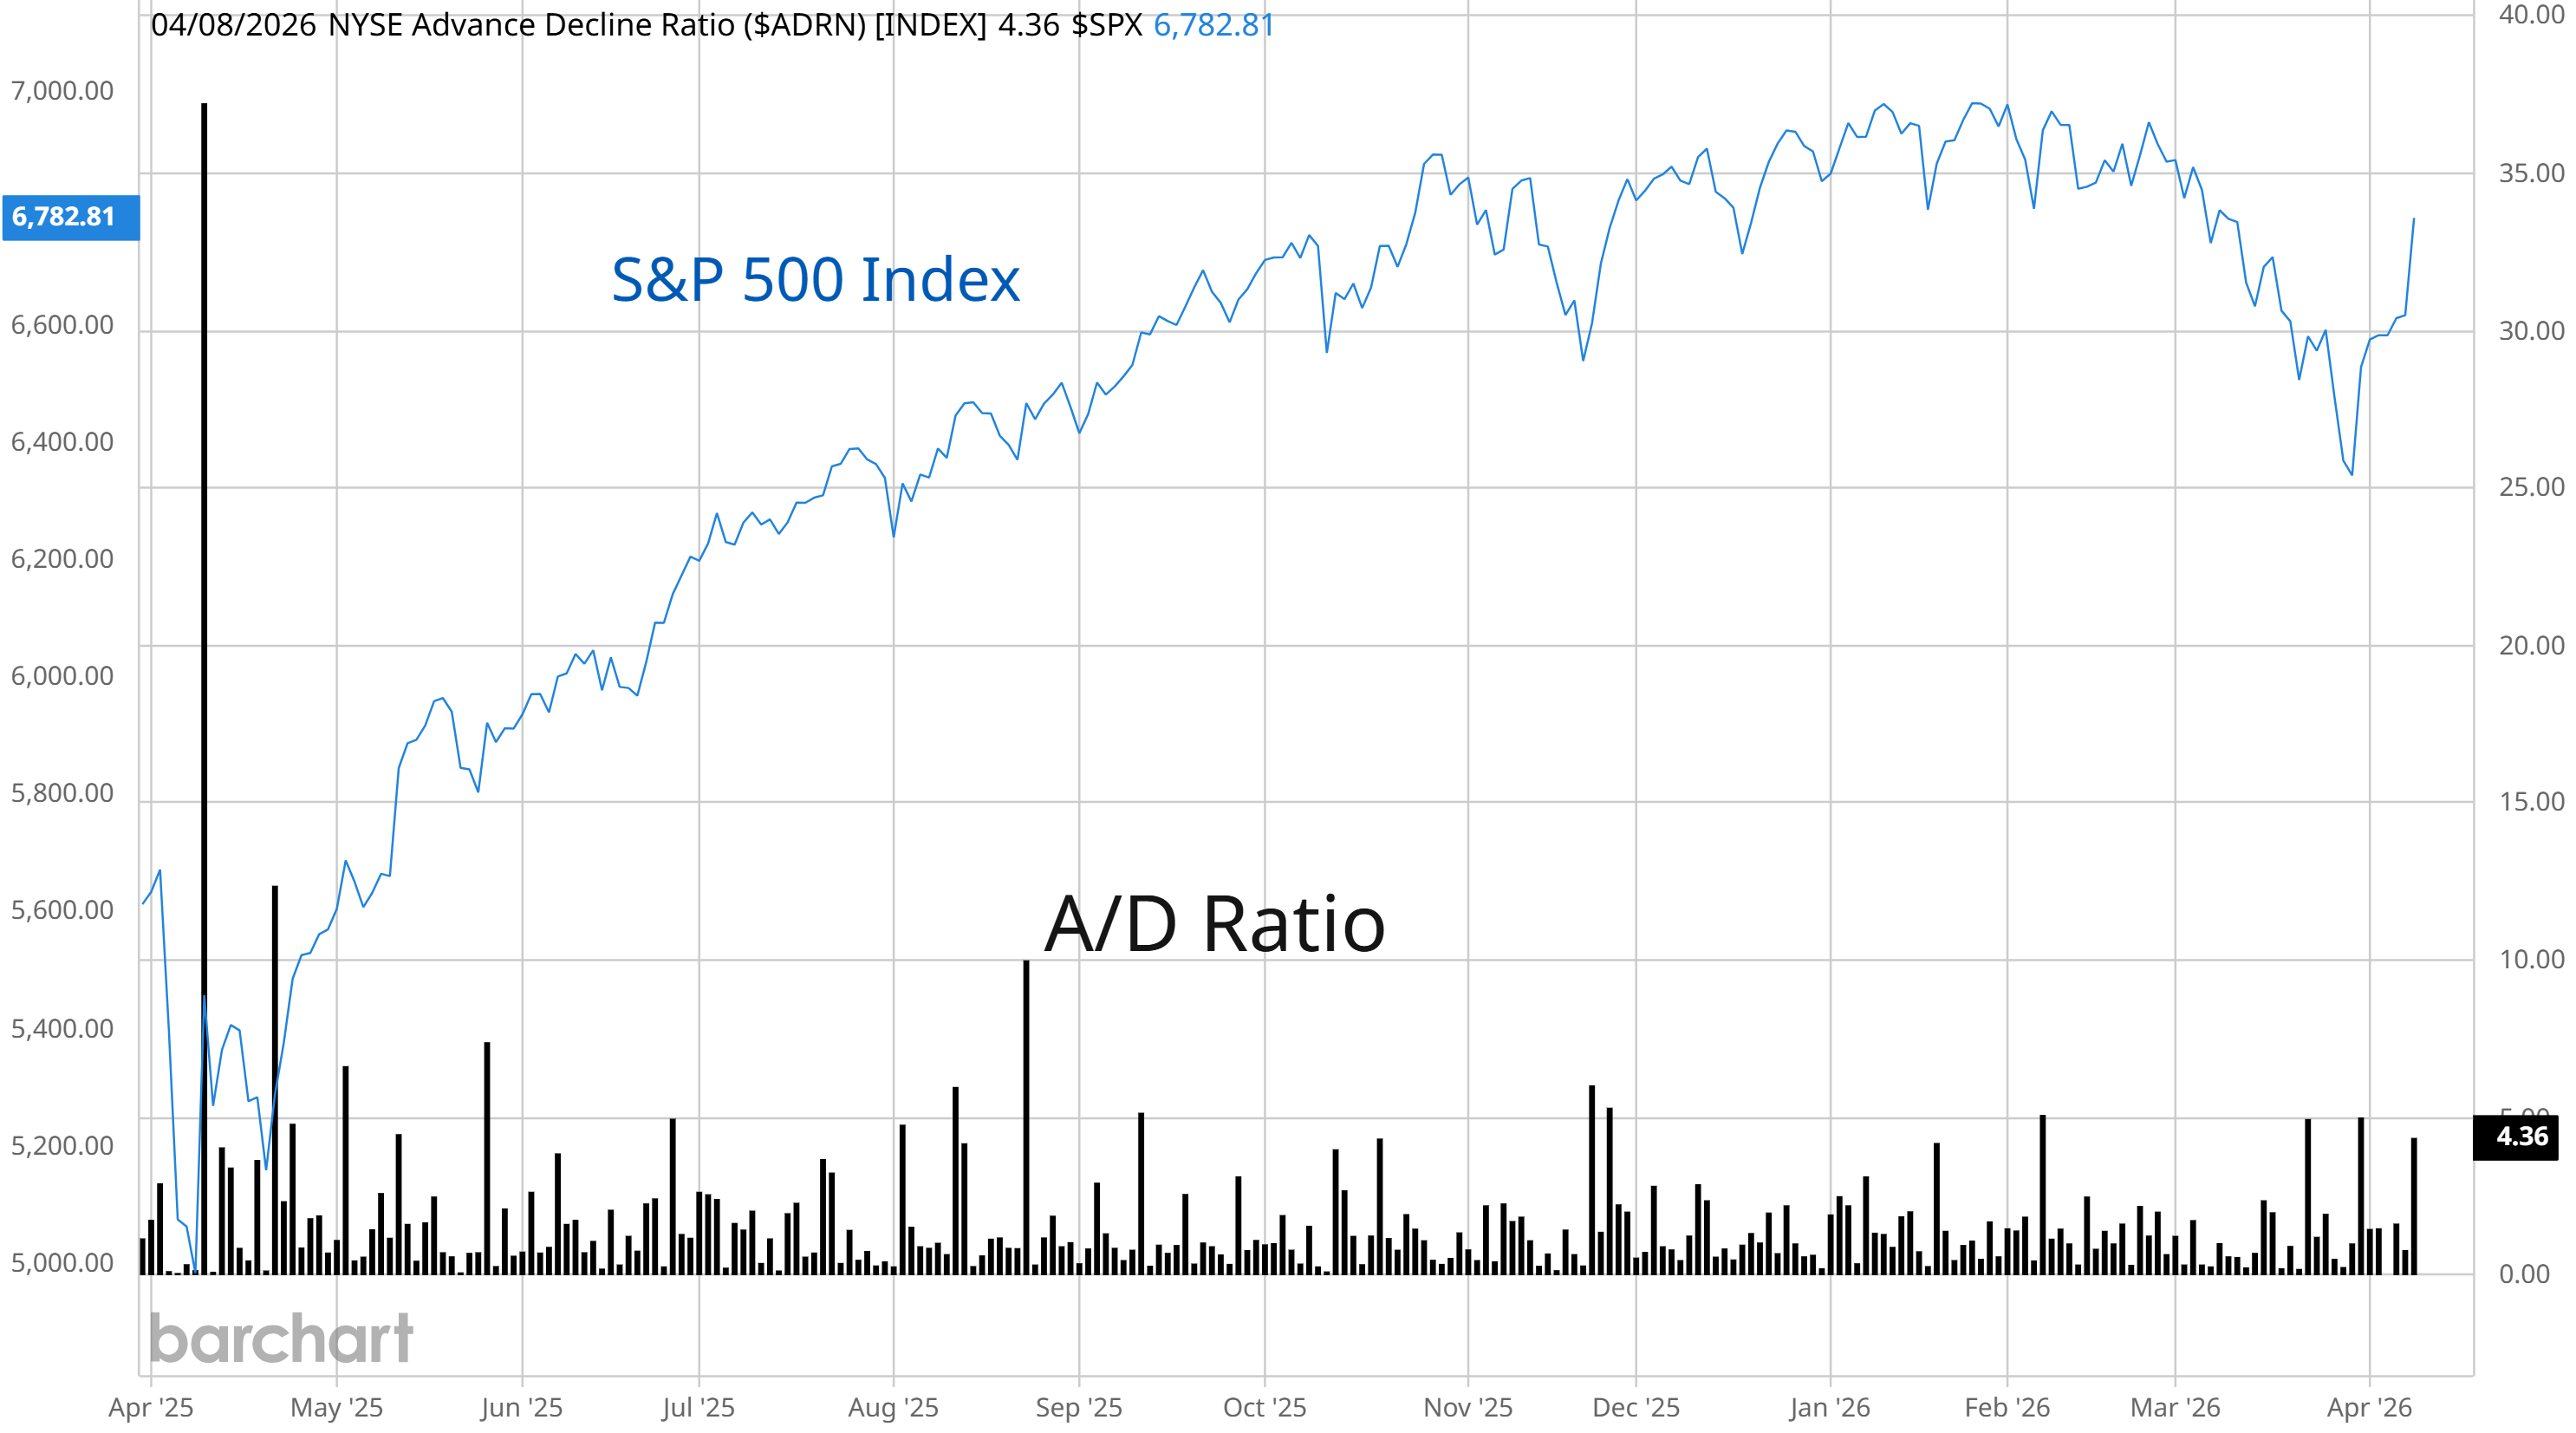
While the underwhelming A/D performance doesn’t have as positive implications for longer-term returns, the recent cluster of strong A/D ratios could help the S&P 500 follow through on a strong period of seasonality that runs through April. We added several positions to the model portfolio to take advantage of breakouts.
Keep reading to see:
Open ETF positions.
Open stock positions.
Chart analysis for new trade ideas.
