
The Market Mosaic 4.5.26
Higher Growth Signals: Can the Economy Keep It Going?

👋Welcome back to The Market Mosaic, where I gauge the stock market’s next move by looking at macro, technicals, and market internals. I’ll also highlight trade ideas using this analysis.
If you find this report helpful please hit that “like” button, share this post, and become a subscriber if you haven’t already done so!
🚨And be sure to check out Mosaic Traders Hub. It’s a members-only platform to alert trade ideas, track a model portfolio of open positions, and further analyze the message coming from the capital markets.
Now for this week’s issue…
During a speech that was widely anticipated to ratchet down tensions with Iran, President Trump instead maintained rhetoric that the campaign still has weeks to run and military strikes would intensify.
The remarks came during a primetime address to the nation, which served to pause a rally attempt by the S&P 500 mid-week. Uncertainty over tanker flow through the Strait of Hormuz kept oil prices near their highest level since the conflict began.
But amid the headlines, there are key reports suggesting an improvement in economic activity in recent months. The ISM manufacturing survey remained above 50 in March, where a reading over 50 indicates expansion.
The leading new orders component of the survey expanded for the third consecutive month with March coming in at 53.5. Another key area of the economy also showed a jump in activity last month.
Nonfarm payrolls for the month of March rose by 178,000, which was well ahead of estimates for 59,000. The three- and six-month average payroll growth are showing signs of inflecting higher after stalling near zero for the past several months (chart below).

It remains to be seen if recent momentum in economic data will be impacted by the conflict in the Middle East, but signs of activity that supports the earnings outlook would help stabilize stock prices.
There’s also evidence from breadth metrics that the average stock is diverging positively from the S&P 500 while positioning and survey-based indicators show sentiment remains extremely bearish, which is a positive contrarian signal.
This week, let’s look at evidence that the economy is showing signs of improving and if the conflict in the Middle East is going to alter the positive trajectory. We’ll also look at positive breadth divergences hinting at a rebound in equities, and how short exposure could help to fuel a rally.
The Chart Report
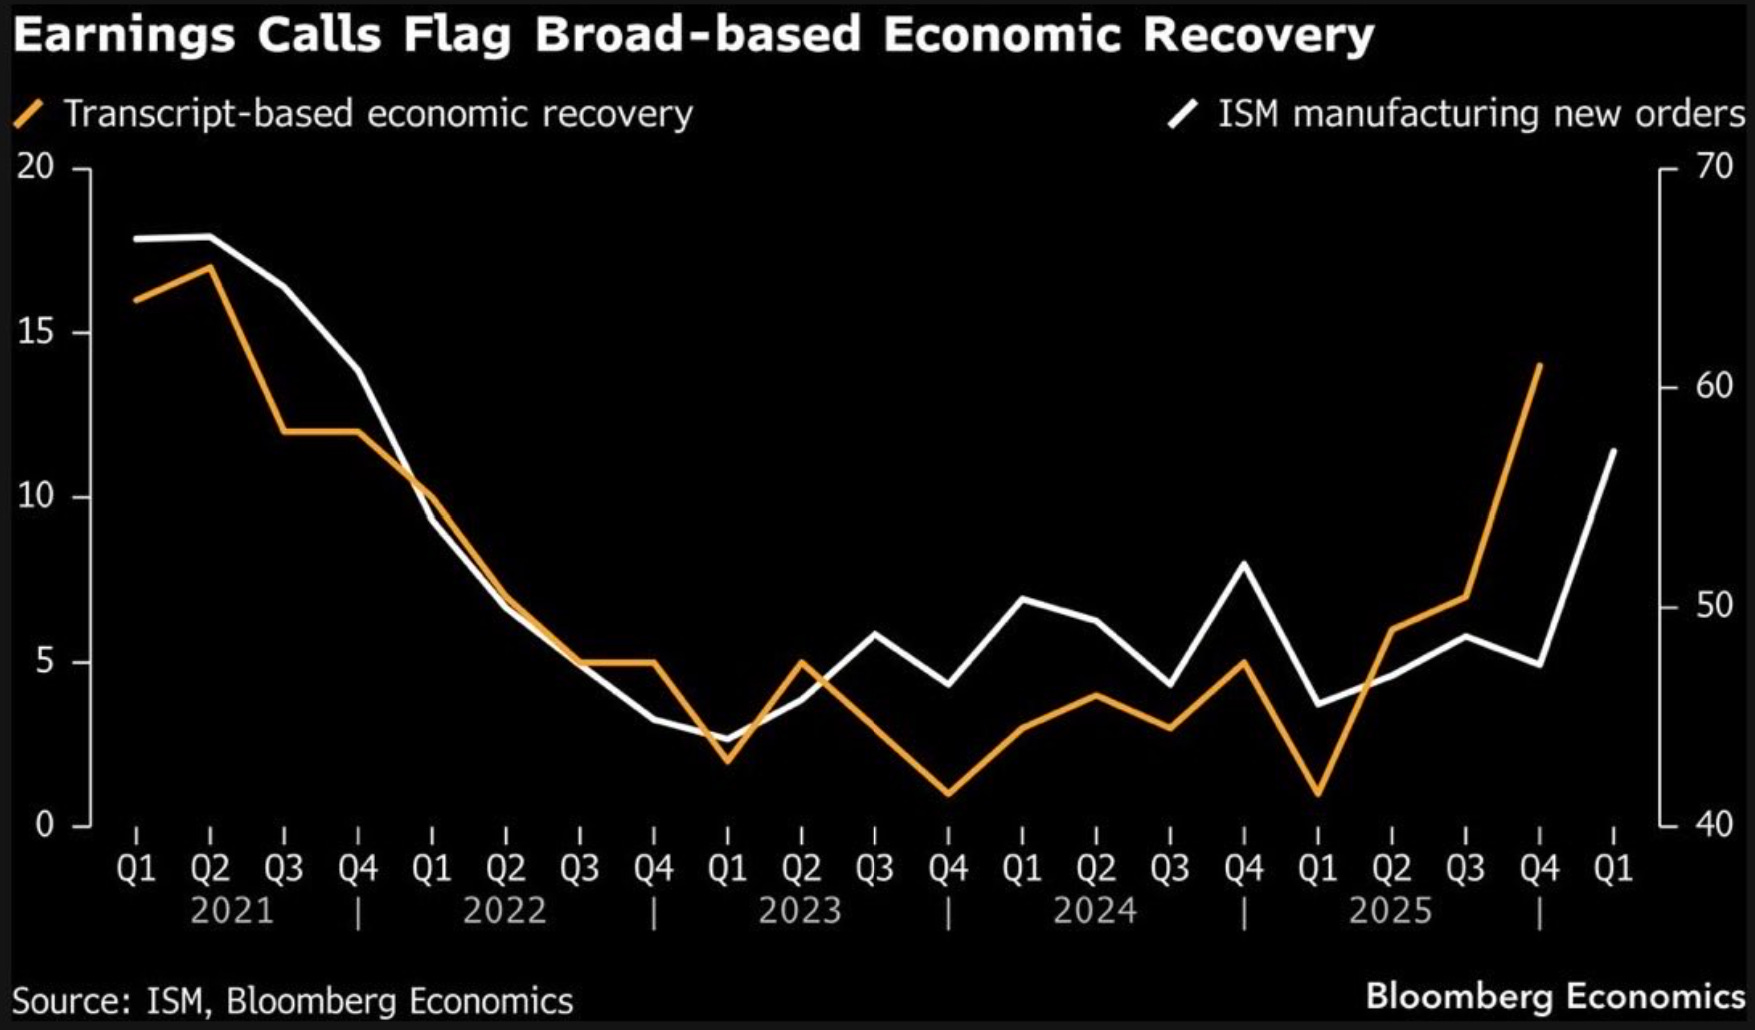
Recent economic data is showing a positive inflection across various metrics. The March payrolls report came in much better than expected and is driving short-term average job creation higher relative to the stall speed emerging last year. Leading indicators like the ISM Manufacturing’s new orders component has stayed in expansion territory. Comments from corporate executives on earnings calls has been hinting at an improving economy as well. The chart below plots the new orders component (white line) against an index of companies discussing an economic recovery on their earnings calls (orange line). You can see that discussion of a recovery has been gaining traction in recent quarters and is leading the turn higher in new orders.
An improvement in economic data was occurring mostly before the outbreak of conflict in the Middle East and surge in energy prices. Negative business sentiment and uncertainty around consumer spending are major risks to the economic outlook. The best case scenario was a quick resolution to the war and subsequent reopening of the Strait of Hormuz that allowed energy exports from the Middle East to resume. But as the conflict looks set to continue, oil prices have remained near their highs following the war. The chart below plots the estimated impact to real GDP growth based on the level of oil prices. GDP was running at a baseline of 2.4% before the conflict. If prices remain near the $100 per barrel level, GDP growth could dip to 1.6% and jeopardize the outlook for corporate earnings.

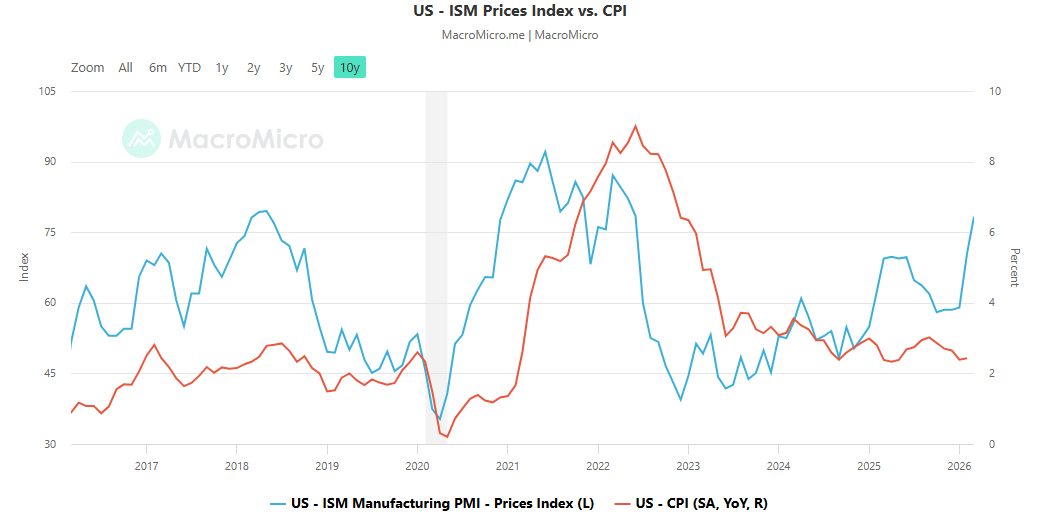
Not all of the underlying components of the ISM’s manufacturing survey portrayed a positive outlook for the economy. Following the jump in oil prices and potential spillover impact from fertilizer shortages on food prices, challenges around the inflation outlook still poses a major risk. The prices paid component of the ISM’s manufacturing survey measures costs for raw materials, and covers a time period following the war in the Middle East. The ISM prices paid jumped to 78.3 (blue line) which is the highest level since June 2022. Back then, the Consumer Price Index (red line) surged to an annual increase of 9%. You can also see in the chart that prices paid tends to lead changes in CPI.
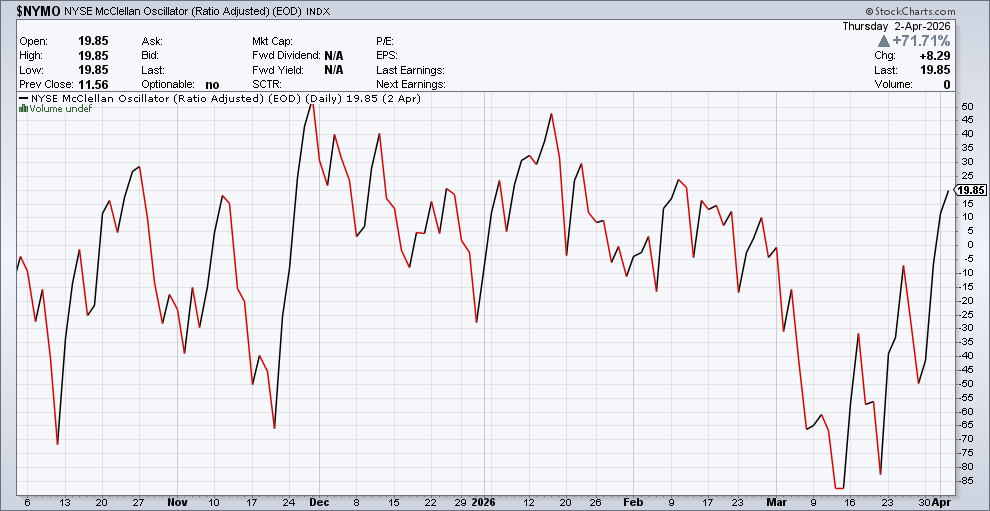
With no signs of de-escalation in hostilities between the U.S. and Iran, the implications for the inflation and economic outlook continues weighing on stock prices. The S&P 500 fell below the 200-day moving average for the first time since last year’s trade war and dropped to the lowest level since August. But there is evidence that the average stock is holding up better than the major indexes with the presence of positive breadth divergences. The chart below plots the McClellan Oscillator applied to the NYSE, which tracks the trailing difference between advancing and declining stocks on the NYSE. You can see that the oscillator is making a series of higher lows since early March and is crossing into positive territory.
At the same time that positive breadth divergences are emerging, a combination of oversold conditions and bearish positioning could help spark a rally and be boosted by a positive feedback loop. The chart below shows net positioning in global equities by hedge funds. Those institutional investors have been cutting exposure steadily in recent months, with a surge in net short positioning last month. That brought exposure to the largest net short position (based on z-score) in over 10 years, where signs of recovering stock index momentum could trigger a rush of buying pressure to cover short positions.

Heard in the Hub
The Traders Hub features live trade alerts, market update videos, and other educational content for members.
Here’s a quick recap of recent alerts, market updates, and educational posts:
The long-term risk from commodity prices.
The near-term opportunity brewing in stocks.
The market’s similarities to 2022’s bear market.
Why the traditional retirement portfolio could get rocked.
One stock about to see a massive acceleration in earnings.
You can follow everything we’re trading and tracking by becoming a member of the Traders Hub.
By becoming a member, you will unlock all market updates and trade alerts reserved exclusively for members.
Trade Idea
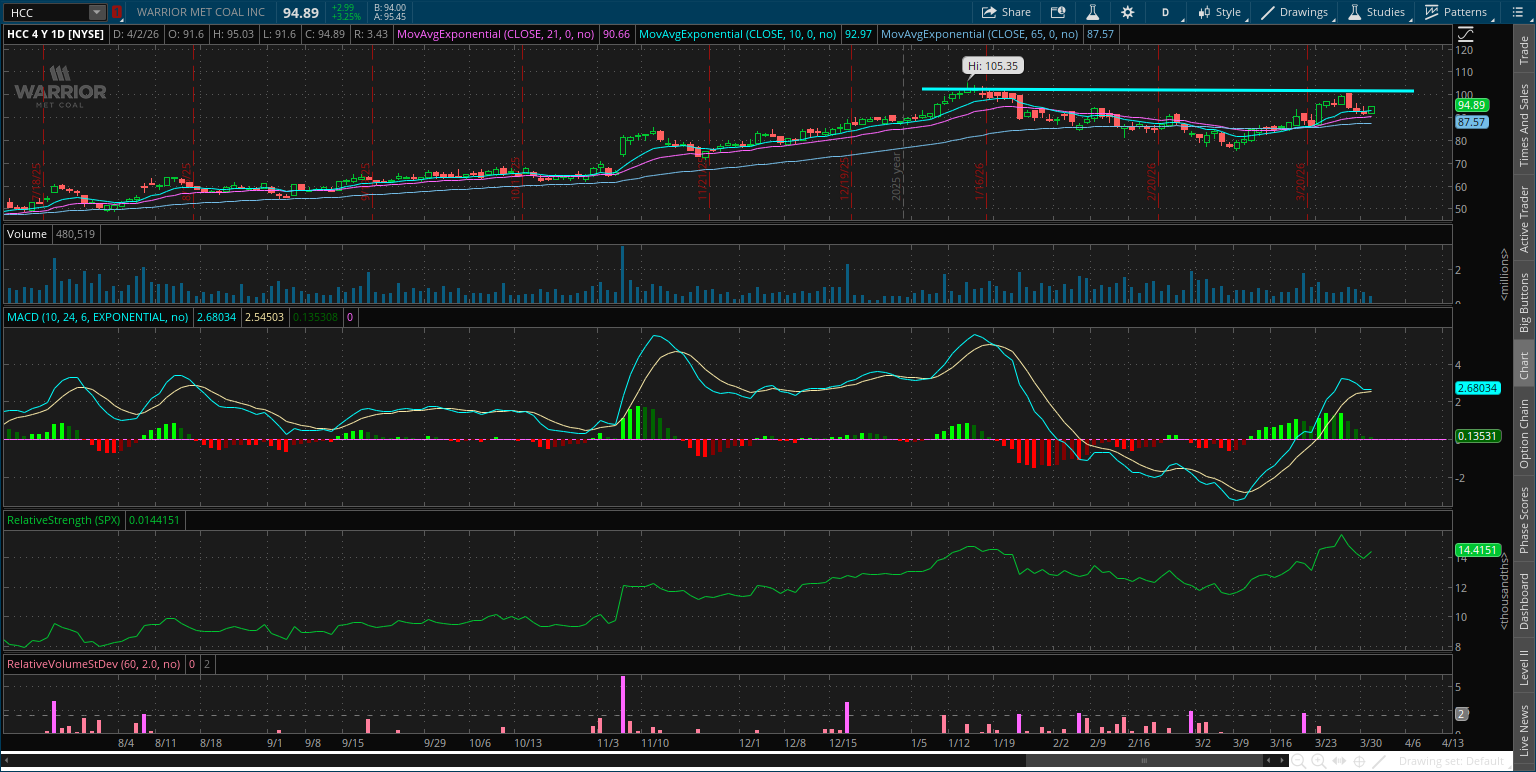
Warrior Met Coal (HCC)
The stock is setting up a new base right at the important $100 level. A smaller pullback is underway following a rally to test resistance. The setup needs more time to see the MACD reset before trying to break above $100.
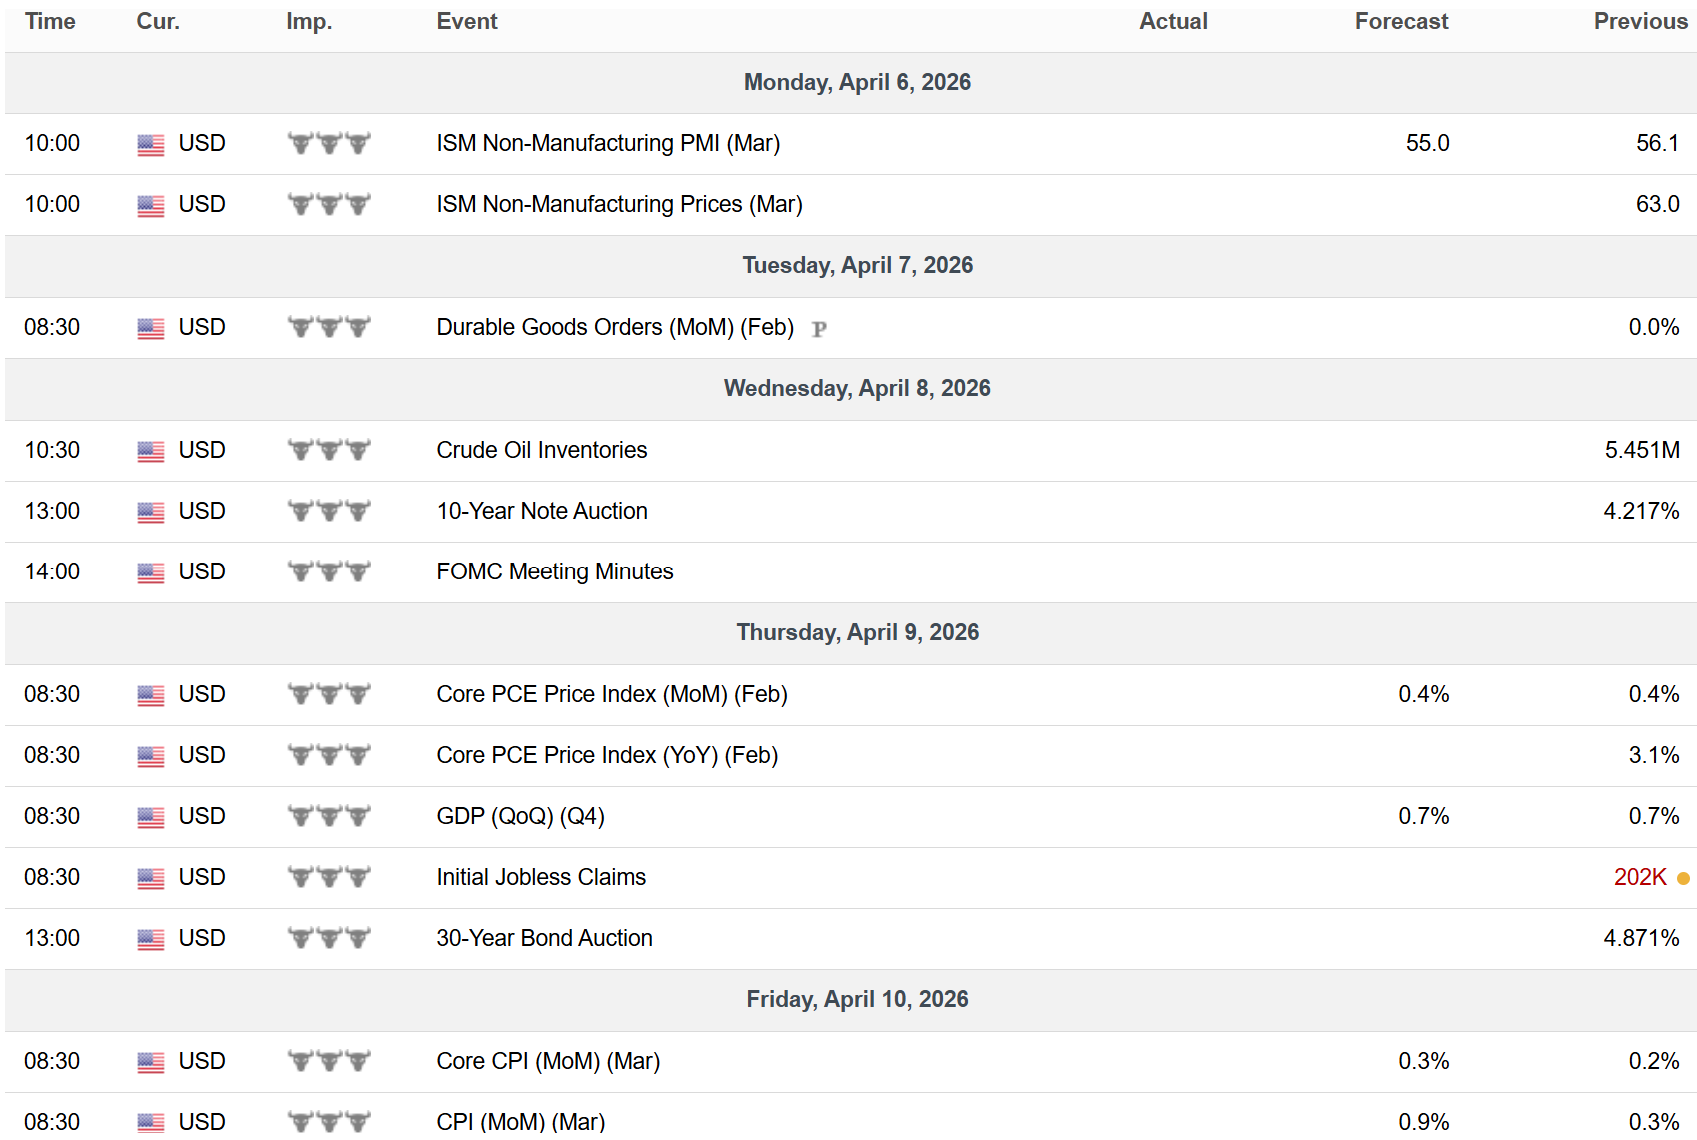
Key Upcoming Data
Economic Reports
Earnings Reports

I hope you’ve enjoyed The Market Mosaic, and please share this report with your family, friends, coworkers…or anyone that would benefit from an objective look at the stock market.
Become a member of the Traders Hub to unlock access to:
✅Model Portfolio
✅Members Only Chat
✅Trade Ideas & Live Alerts
✅Mosaic Vision Market Updates + More
Our model portfolio is built using a “core and explore” approach, including a Stock Trading Portfolio and ETF Investment Portfolio.
Come join us over at the Hub as we seek to capitalize on stocks and ETFs that are breaking out!
And if you have any questions or feedback, feel free to shoot me an email at mosaicassetco@gmail.com
Disclaimer: these are not recommendations and just my thoughts and opinions…do your own due diligence! I may hold a position in the securities mentioned in this report.
https://stevenrob1.substack.com/