Mosaic Chart Alerts
As the S&P 500 tests a critical level, this sector may tip the next move.
Welcome back to Mosaic Chart Alerts!
In this newsletter, I’ll focus on the best setups that I’m monitoring for both long and short positions. With a chart and short write-up, this is a quick way to scan and plan potential trades.
These ideas are the end result of my process to identify stocks offering the right combination of fundamentals along with a proper chart setup.
Here are my notes from a shortlist of setups I’m monitoring.
Stock Market Update
In a case of deja vu, the S&P 500 is again struggling with a familiar level. And that is with trendline resistance from the peak in the S&P at the end of 2021, which the 200-day moving average (green line) is also closely tracking. As you can see in the chart below, we’ve been here several times before and failed at this level. Yet there are reasons to be more hopeful that the stock market can take out resistance this time around. I noted in last week’s update that breadth has been much stronger on this rally, meaning more stocks are participating in the recent uptrend.
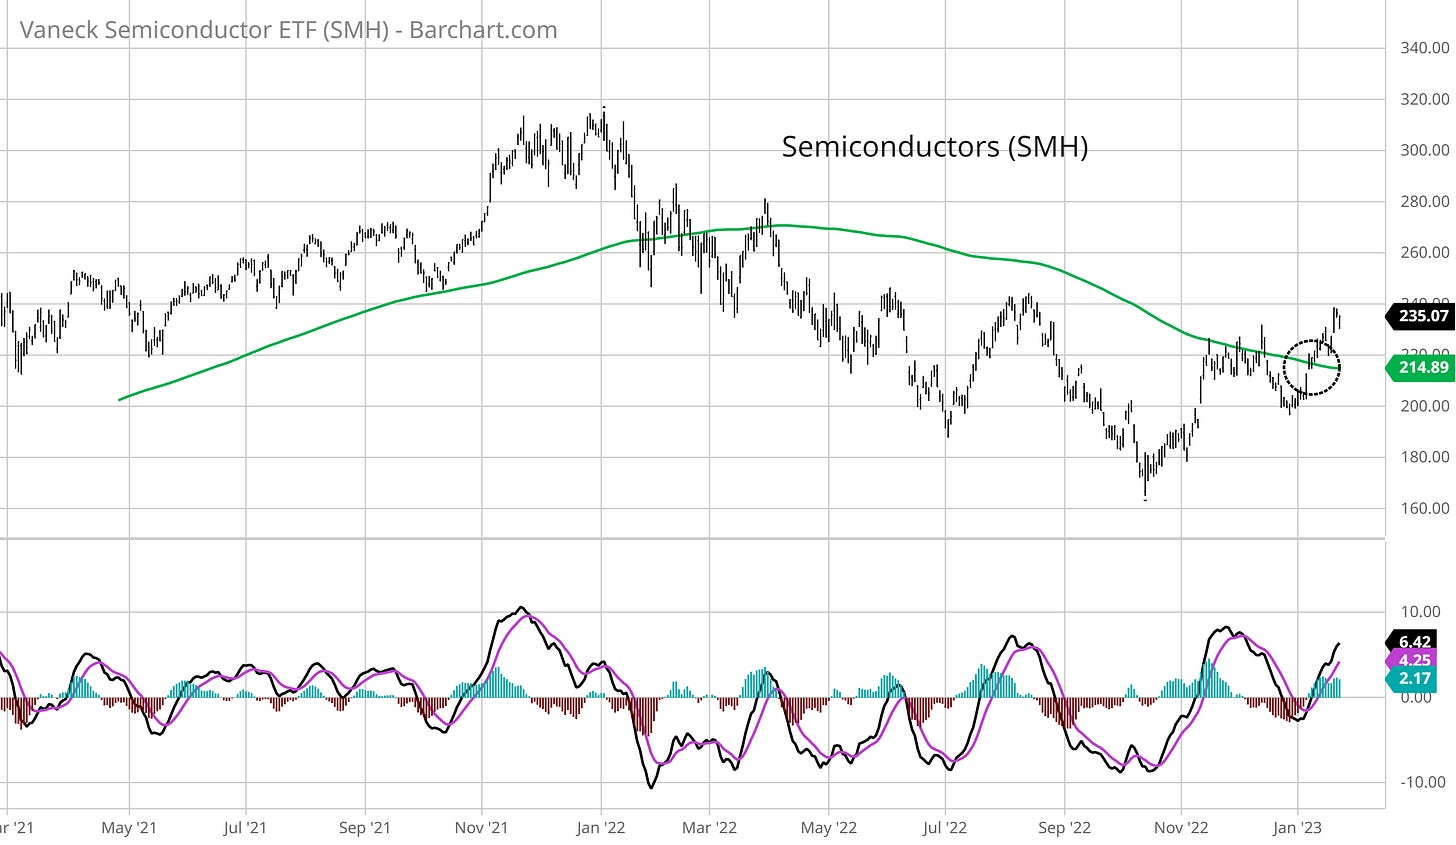
There’s another reason to be more optimistic, and that is with the performance of semiconductor stocks. This economically-sensitive group of companies can lead key turning points in the stock market, and offer up clues about underlying strength or lack thereof. In the chart below of the SMH semiconductor ETF, you can see a similar struggle with the 200-day moving average which confirmed underlying weakness in the market. But this time around, SMH is achieving decent escape velocity with a strong move over the 200-day (circled area). I believe this bodes well for the rest of the market at least over the near-term.
There are a few updates to the watchlist this week. First, BLDR and LSCC are completing their patterns by taking out the resistance levels noted last week. So we’ll replace those stocks with new long ideas. I’m also removing TTD from the short watchlist, as recent strength has invalidated the descending triangle pattern we were tracking.
Keep reading below for all the updates…
Long Trade Setups
MRC
The recent basing structure is looser and deeper than ideal, but the tight trading range since November has reset the MACD for another move higher. Using the $12.50 - $13 resistance area as a trigger.
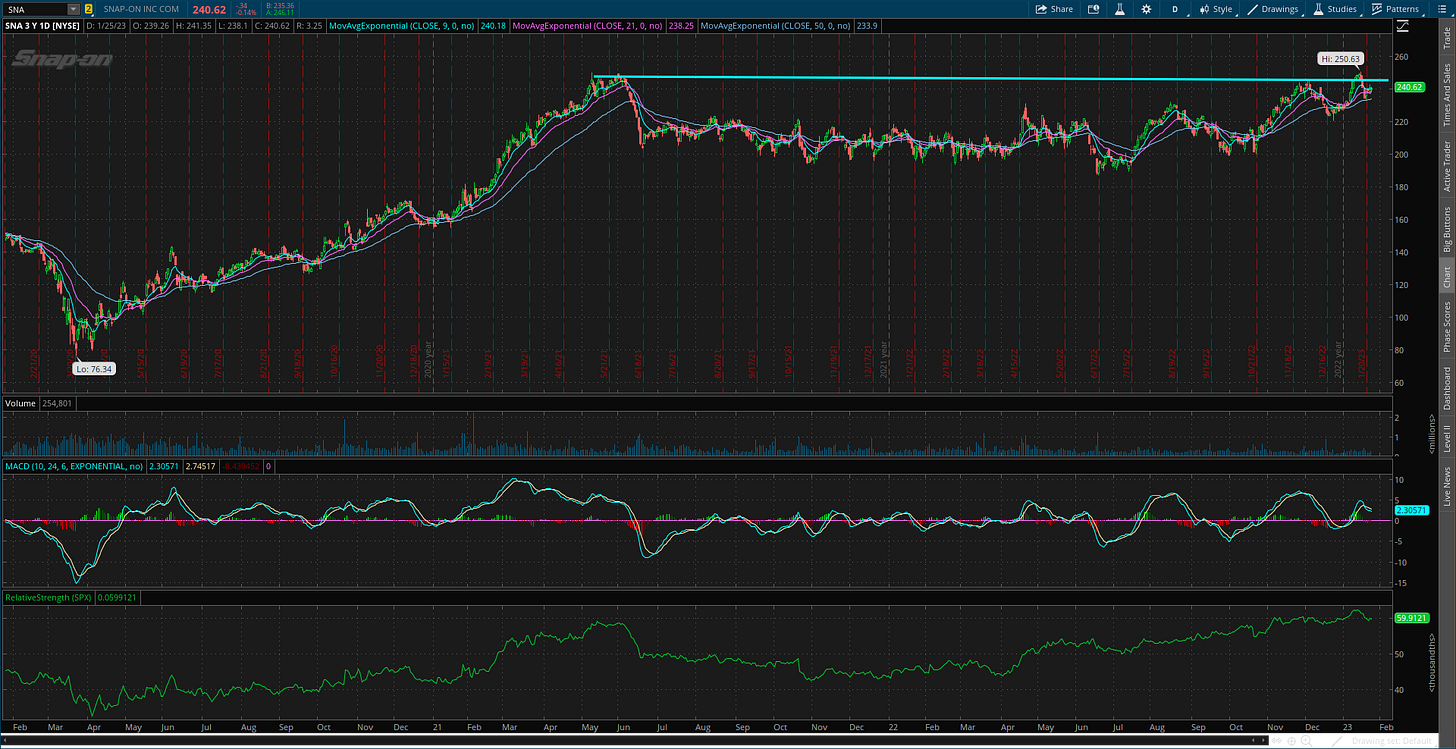
SNA
Simple basing pattern stretching back to 2021. Recent test of the $250 resistance level was turned back, but allowing the MACD to reset while relative strength hovers near the high.
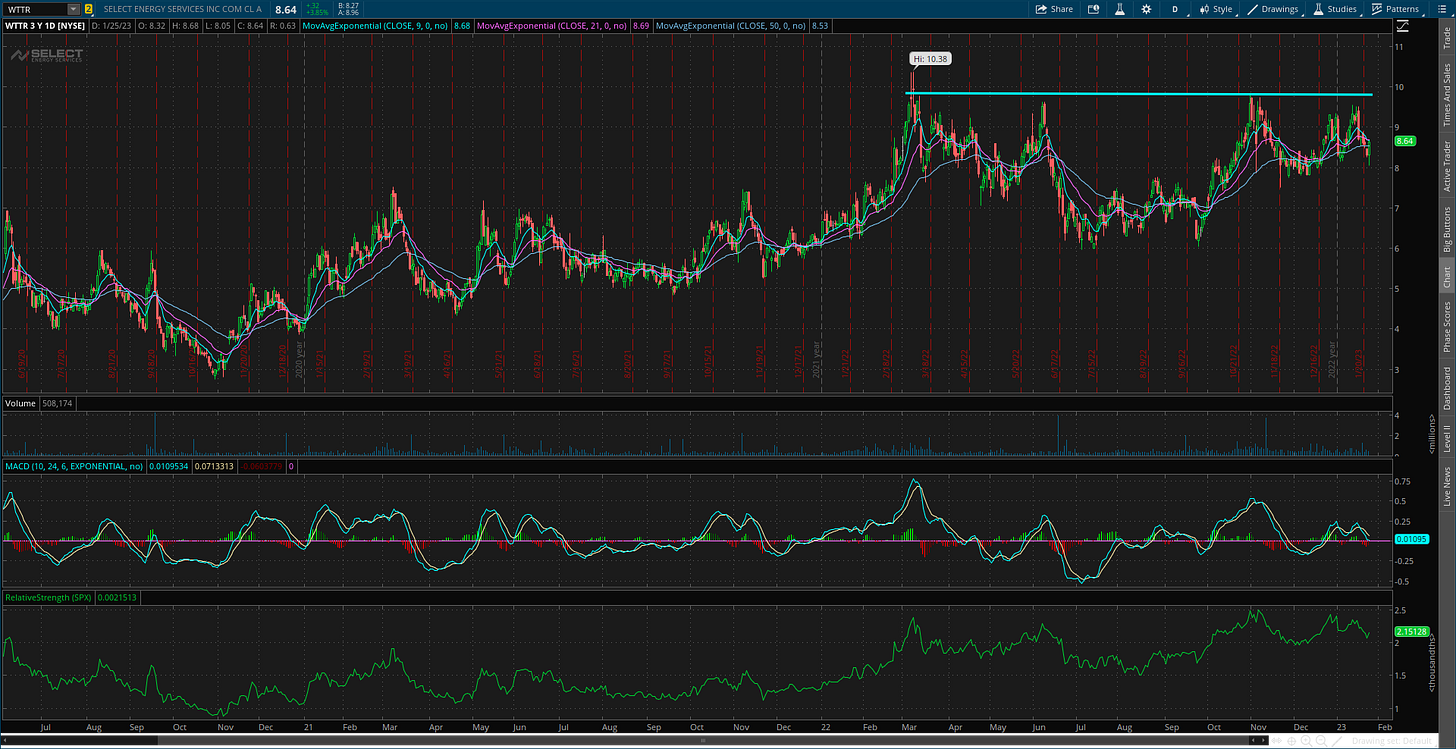
WTTR
In case you missed it, I put together a special report on this setup. I wanted to provide a “behind the scenes” look at how I evaluate trade ideas. As noted, I’m watching for a move above the $10 level which remains in play.
ETD
Strong move off the October lows quickly brought the stock back to the $30 resistance area. Rejecting off $30 resistance again, though the reset in the MACD underway would help this breakout setup.
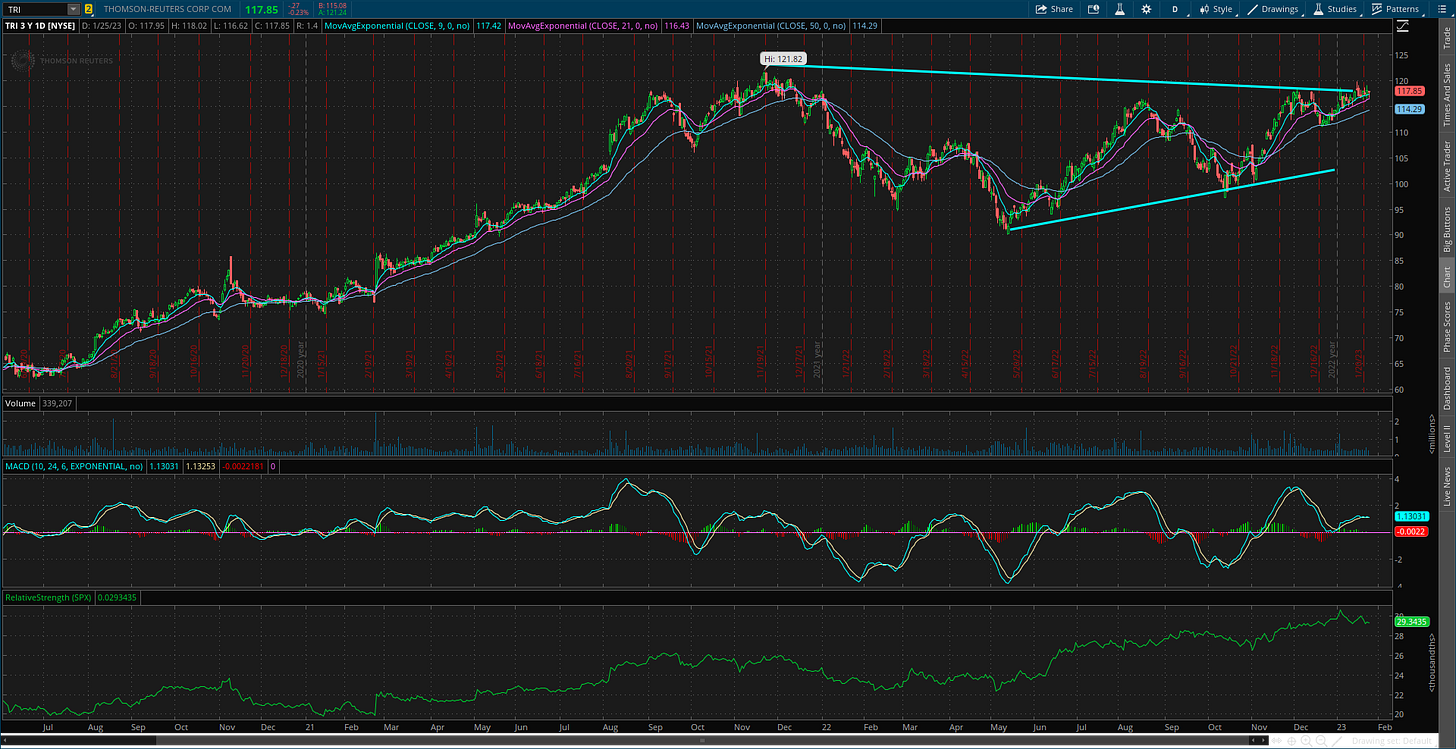
TRI
Trendlines show a triangle consolidation pattern. Price still right at trendline resistance while wedged against short-term moving averages. Need to see a solid breakout on volume soon or this will removed from watch.
RNGR
Price resistance around the $11.50 level tested several times over the past 16 months. Still trading in a tight range just below that level. A more speculative smaller-cap name, so position size accordingly.
Short Trade Setups
RUN
Creating a bearish triangle continuation pattern. Watching for a close below trendline support around the $22 level.
MOS
Abnormal price bar this week likely related to the NYSE’s technical “glitch”. Will keep this on watch for another week. Want to see price move back below moving averages and MACD turn back lower to test support around the $43 level.
NET
Bouncing off the $40 support level for the third time since June. Simple setup and trigger level.
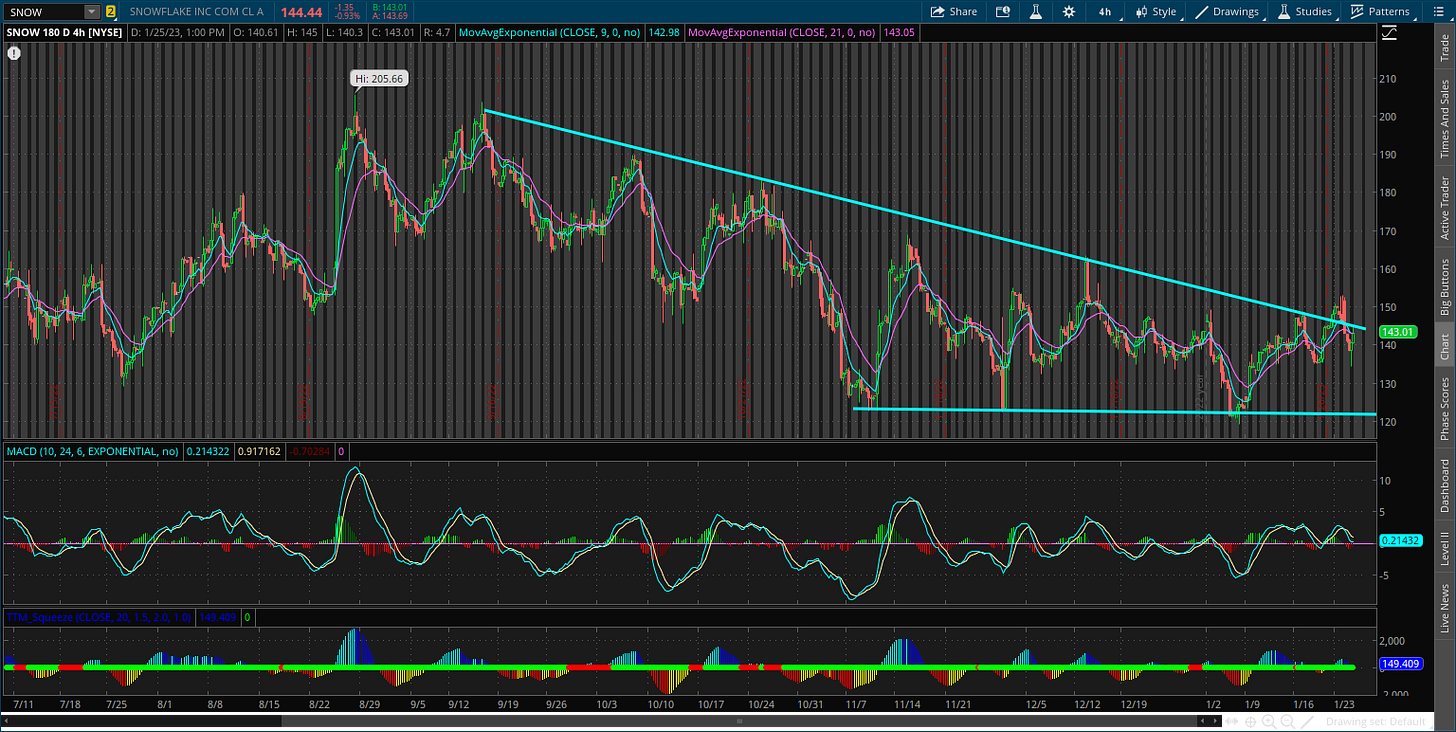
SNOW
Continue to watch for a breakdown through the $121 support area to complete this descending triangle pattern. Struggling with the resistance line, but a sustained move above would invalidate the pattern.
Rules of the Game
If you haven’t noticed yet, I trade breakouts! I trade based on the daily chart for long positions. And for price triggers on long setups, I tend to wait until the last half hour of trading to add a position. I find that emotional money trades the open, and smart money trades the close. If it looks like a stock is breaking out, I don’t want a “head fake” in the morning followed by a pullback later in the day.
Also for long positions, I use the 21-day exponential moving average (EMA) as a stop. If in the last half hour of trading it looks like a position will close under the 21-day EMA, I’m usually selling whether it’s to take a loss or book a profit.
For short (or put) positions, I trade off a four-hour chart instead of a daily. Why? There’s a saying that stocks go up on an escalator and down on an elevator. Once a profitable trade starts to become oversold on the four-hour MACD, I start to take gains. Nothing like a short-covering rally to see your gains evaporate quickly, so I’m more proactive taking profits on short positions. I also use a 21-period EMA on the four-hour chart as a stop. If there is a close above the 21-period EMA, I tend to cover my short.
For updated charts, market analysis, and other trade ideas, give me a follow on twitter: @mosaicassetco
Disclaimer: these are not recommendations and just my thoughts and opinions…do your own due diligence! I may hold a position in the securities mentioned in this newsletter.


