Welcome back to Mosaic Chart Alerts!
In this post, I’ll focus on setups that I’m monitoring for both long and short positions. With a chart and short write-up, this is a quick way to scan and plan potential trades.
These ideas are the end result of my process to identify stocks offering the right combination of growth fundamentals along with a proper chart setup.
Here are my notes from a focus list of setups I’m monitoring.
Stock Market Update
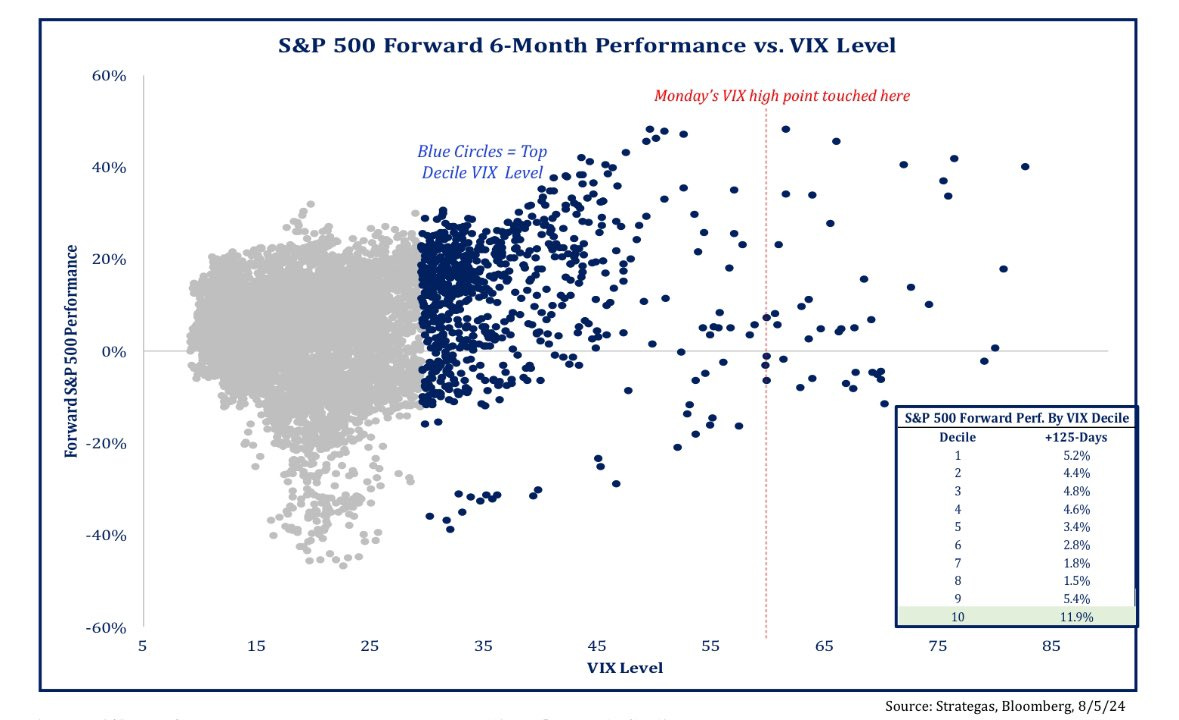
A plunge in stock market indexes around the world helped the CBOE Volatility Index (VIX) soar to its third highest level in history. The VIX surged 172% to an intraday high of nearly 66 on Monday, and has only been higher during the 2008 financial crisis and 2020’s pandemic driven bear market. Headlines are mostly blaming the move on evidence of an impending recession following last week’s unemployment report and unwinding of the Japanese yen carry trade that’s forcing selling in equities. While those events surely contributed to the increase in the VIX, I have a hard time believing those events are worthy of rivaling the financial crisis and economic impact of the pandemic.
Rather, I outlined my view in this week’s Mosaic Vision Market Update that the surge in VIX is more structural following an extended period of calm in the markets. My view is that institutional strategies like volatility-targeting and risk parity funds were running close to fully invested based on their risk budgets, and rushed to sell stocks at the same time once VIX started moving higher (creating a negative feedback loop of selling pressure). No matter the cause, the focus now should be on what tends to happen following VIX spikes. Such moves in volatility markets tend to mark peak fear and panic, with forward returns in the stock market historically strong. The chart below plots the S&P 500’s forward six month return by VIX level. The blue dots represent the top decile of VIX readings, where the S&P averages an 11.9% gain looking ahead.
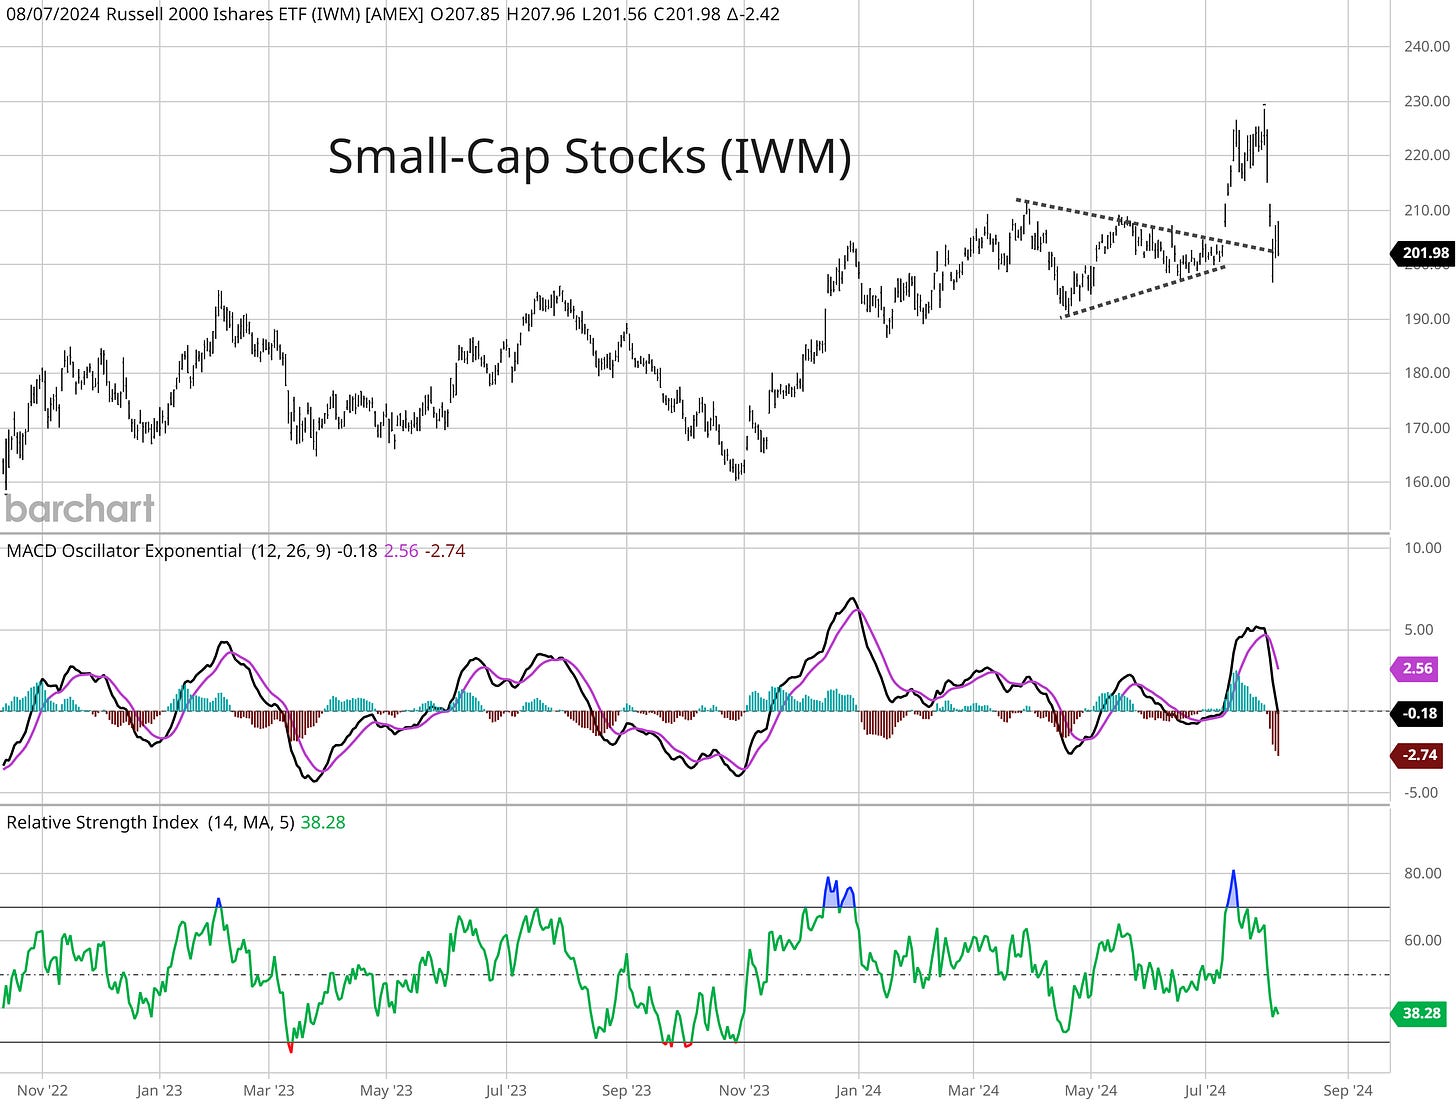
But if the selloff is a reflection of economic troubles, then I would expect the action in cyclical sectors to provide confirmation. So far, many cyclical sectors recently breaking out are coming back to test prior resistance levels as support. I shared on Notes how bank stocks are coming back to test their breakout level, and small-caps in the chart below are doing something similar. You can see the move out of the bullish pennant pattern in early July that accompanied strong breadth metrics. Following breakouts, price will often test trendline or price support. The IWM exchange-traded fund (ETF) that tracks small-caps is testing the resistance trendline. At the same time, the MACD in the middle panel is resetting at the zero line after being extended to the upside. I’m following the price action in these sectors closely for signals on the economic outlook, where failed breakouts would be a warning sign.
There are ways to use the deeper pullback in the stock market to your advantage. You can become more selective about which stocks and trade setups are showing the best relative performance. Stocks that keep showing constructive basing action in their patterns along with smaller pullbacks will see their relative strength (RS) line improving. And if the S&P 500 can start forming a bottom, stocks among the first to new highs are often the leaders of the next rally phase. You’re seeing that with MELI, which I’m removing from watch as the stock breaks out to complete its pattern. This is also the time to prune the watchlist and remove stocks that are showing weak price action. That includes DDOG, MNDY, COIN, and TRMD that I’m removing from the watchlist this week.
Keep reading below for all the updates…
Long Trade Setups
SKWD
Prior watchlist stock that could be forming a “base on base” pattern. Originally broke out over the $38 level and now trading in a tight range while the RS line is staying near the high. Watching for a MACD reset at the zero line followed by a move over $40.
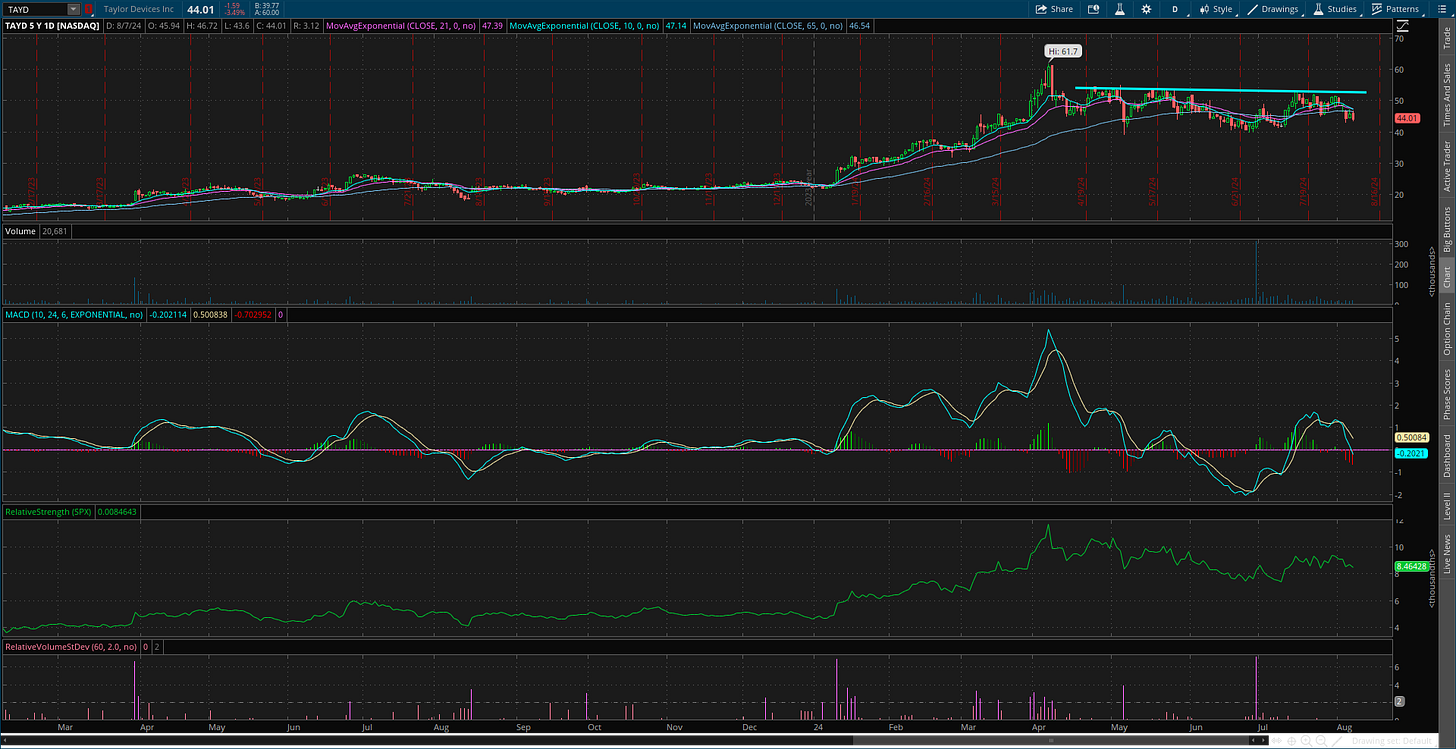
TAYD
Peaked at the $60 level after moving out of a large base in January. Consolidating gains since April, with an initial resistance level to monitor at the $53 level. Need to see the MACD turn up and not dip too far below zero.
IAG
Trading in a bullish pennant pattern after breaking out over the $3 level. Price action coiling while the RS line remains near the recent high and the MACD resets above the zero line. Watching for a move over $4.30.
PLTR
Creating a “base on base” pattern after breaking out over the $25 level. I would prefer to see one more test and smaller pullback off the $30 level, which is also resistance from 2021. A move above $30 can target the post-IPO high around $40.
LNW
Good basing action after the stock peaked just under $110 in March. Price is recently retesting that level and pulling back. Now getting one smaller pullback that reset the MACD at the zero line. That sets up a move to new highs over $110.
FG
Broke out of a base back in November and rallied to the $48 area. Consolidating gains since the start of the year and recently rallying back toward $48. Want to see price hold support at the $35 area.
PDD
Trading in a consolidation pattern going back to December and recently working up the right side of the base. That move left the MACD extended, with price pulling back. Need to see the MACD move back above zero, then a move over $160 with confirmation by the RS line.
Rules of the Game
I trade chart breakouts based on the daily chart for long positions. And for price triggers on long setups, I tend to wait until the last half hour of trading to add a position. I find that emotional money trades the open, and smart money trades the close. If it looks like a stock is breaking out, I don’t want a “head fake” in the morning followed by a pullback later in the day.
I also use the RS line as a breakout filter. I find this improves the quality of the price signal and helps prevent false breakouts. So if price is moving out of a chart pattern, I want to see the RS line (the green line in the bottom panel of my charts) at new 52-week highs. Conversely, I prefer an RS line making new 52-week lows for short setups.
Also for long positions, I use the 21-day exponential moving average (EMA) as a stop. If in the last half hour of trading it looks like a position will close under the 21-day EMA, I’m usually selling whether it’s to take a loss or book a profit.
For short (or put) positions, I trade off a four-hour chart instead of a daily. Why? There’s a saying that stocks go up on an escalator and down on an elevator. Once a profitable trade starts to become oversold on the four-hour MACD, I start to take gains. Nothing like a short-covering rally to see your gains evaporate quickly, so I’m more proactive taking profits on short positions. I also use a 21-period EMA on the four-hour chart as a stop. If there is a close above the 21-period EMA, I tend to cover my short.
For updated charts, market analysis, and other trade ideas, give me a follow on X: @mosaicassetco
Disclaimer: these are not recommendations and just my thoughts and opinions…do your own due diligence! I may hold a position in the securities mentioned in this post.


