Mosaic Chart Alerts
The S&P 500 is at converging support levels just as oversold conditions emerge.
Welcome back to Mosaic Chart Alerts!
In this newsletter, I’ll focus on the best setups that I’m monitoring for both long and short positions. With a chart and short write-up, this is a quick way to scan and plan potential trades.
These ideas are the end result of my process to identify stocks offering the right combination of fundamentals along with a proper chart setup.
Here are my notes from a shortlist of setups I’m monitoring.
Stock Market Update
With a 2% drop on Tuesday, the S&P 500 officially logged its worst day in 2023 (so far…). In a year that’s off to a hot start, the drop feels like it came out of nowhere. But recently we’ve been tracking signs that stocks were due for a pullback. I noted here a couple weeks ago that near-term breadth was already deteriorating. I also wrote in last week’s Market Mosaic that the second half of February features bearish seasonality. Now throw in too much bullish sentiment, and you have all the ingredients for a decline. But I also noted that a pullback could be a healthy reset for the stock market, which can keep the uptrend intact. And now we find the S&P 500 sitting at a confluence of support levels, including the 50-day moving average (black line) and trendline support off the October lows.
Those support levels are coming into play at a time when oversold conditions are emerging. Lets circle back to the percent of stocks trading above their 20-day moving average. At 29%, we’re starting to enter oversold territory that has marked past short-term bottoms (see chart below). The McClellan Oscillator, which is another breadth metric, also hit its lowest level since late September. That marked a low and saw the S&P 500 run 14% into December. Sentiment indicators are still running a bit too bullish, but developing oversold conditions at key support is worth your attention.
I have a bullish tilt given the cyclical sector leadership that has characterized the year so far, along with several breadth thrusts back in January that points to institutional buying. So my main focus is on the long watchlist, where I have several updates. Both CHWY and SEDG never broke out and are now trading below key moving averages, so I’m removing these from the list. I’m also taking off KEYS following the stock’s negative reaction to earnings. From the short watchlist, SBOW completed its downside pattern with a move below the $23 level. That means there are several new additions this week. Finally, I’m also adding an important update to my “Rules of the Game”.
Keep reading below for all the updates…
Long Trade Setups
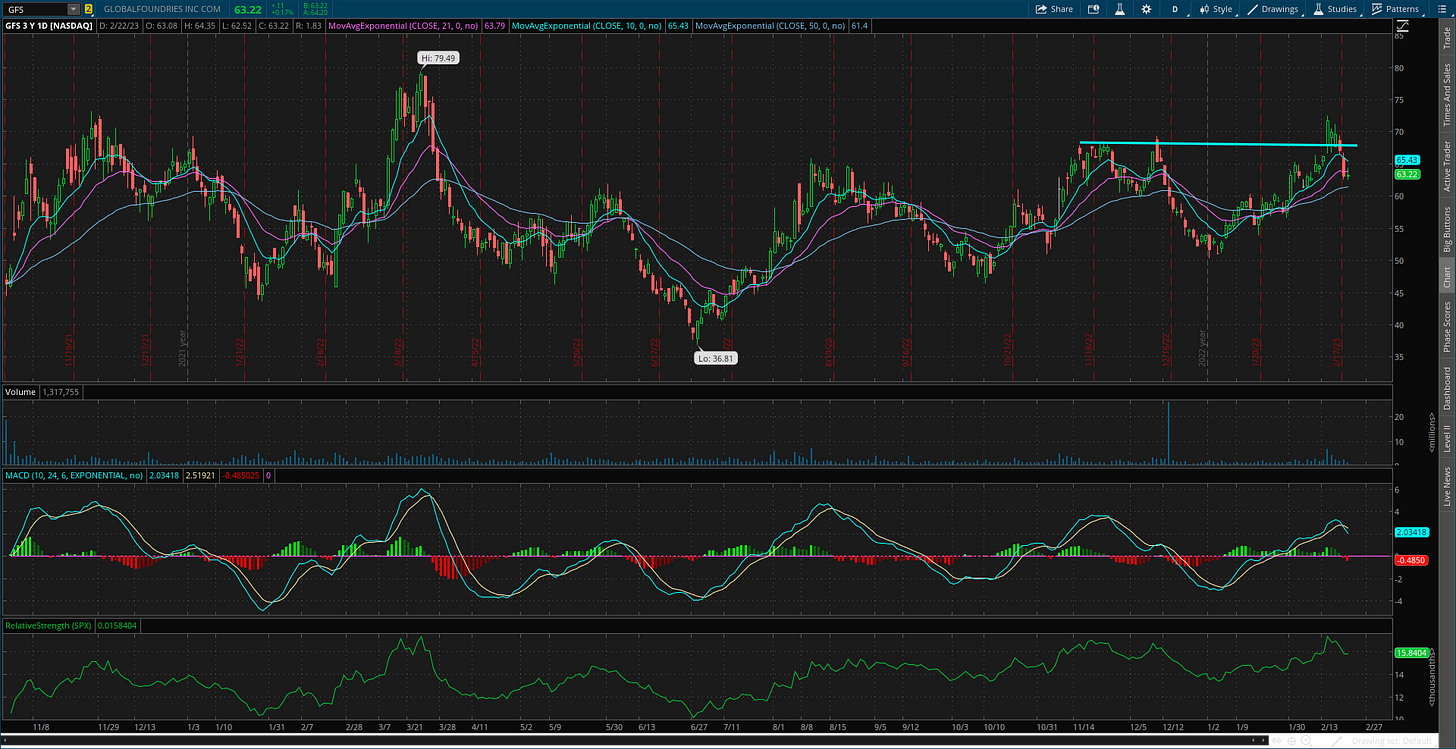
GFS
Recent IPO that tried to break above $70 resistance and failed. The pullback is resetting the MACD at the zero line while relative strength (RS) is hovering near the highs. Looking for another attempt at $70 that can test the prior high at $80.
HOG
Earnings gap tried to breakout then failed. Pullback has filled the gap and reset the MACD. Looking for another attempt to move over the $50 level.
OC
Building products stock that recently ran up to the prior resistance highs around $105. Expect the recent pullback to set up another breakout attempt. Also notable that the RS line is staying close to new highs.
AVNW
Massive consolidation pattern in the works for nearly two years. Testing support at the $35 level after gapping higher. Seeing the MACD reset closer to zero before trying to breakout over the $40 level.
BE
Renewable energy stock that peaked two years ago and has tested trendline resistance on three instances. On this recent test, MACD is resetting at the zero line while RS is near the 52-week high. Watching for a move over the $25-$26 area.
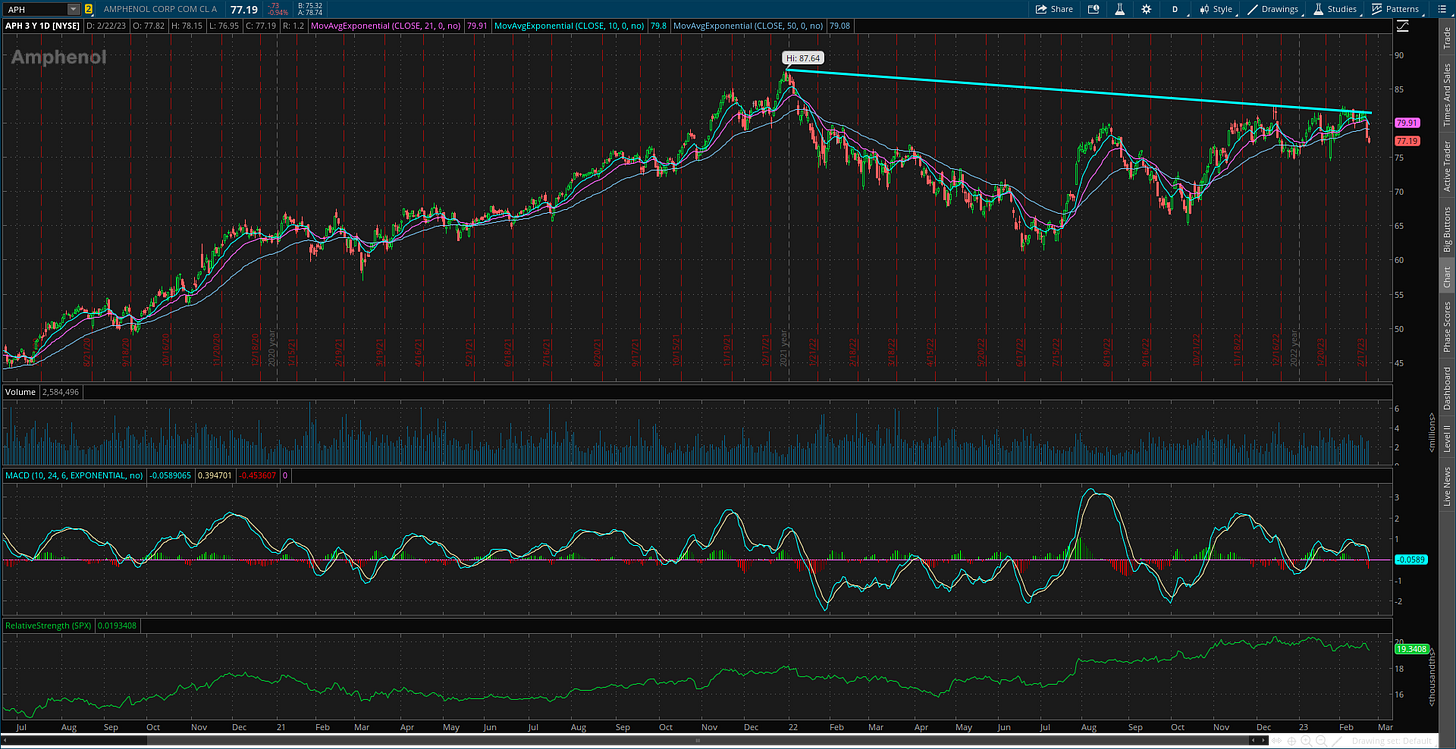
APH
Rejecting again off resistance around the $82 level. Recent MACD reset while the RS line is holding near the highs. Will keep on watch for another week, but I don’t like the close below the 50-day moving average.
Short Trade Setups
WHR
Price recently backtesting the breakdown from this trendline. Expect a close under the $138-$140 area could test the lows.
SPWR
Targeting a move below the $15 support level, which was tested again this week. MACD and RS line still in position to support a move lower.
RUN
Creating a bearish triangle continuation pattern. Tested trendline support this week at the $23 level, where I’m watching for a close below.
MOS
Keeping on watch for another week. Still want to see price move back below moving averages and now have MACD turning lower to test support around the $43 level.
Rules of the Game
If you haven’t noticed yet, I trade breakouts! I trade based on the daily chart for long positions. And for price triggers on long setups, I tend to wait until the last half hour of trading to add a position. I find that emotional money trades the open, and smart money trades the close. If it looks like a stock is breaking out, I don’t want a “head fake” in the morning followed by a pullback later in the day.
New Filter: After extensive back testing and live implementation, I am adding new highs on the RS line as a breakout filter. I find this improves the quality of the price signal and helps prevent false breakouts. So if price is moving out of a chart pattern, I want to see the RS line (the green line in the bottom panel of my charts) at new 52-week highs.
Also for long positions, I use the 21-day exponential moving average (EMA) as a stop. If in the last half hour of trading it looks like a position will close under the 21-day EMA, I’m usually selling whether it’s to take a loss or book a profit.
For short (or put) positions, I trade off a four-hour chart instead of a daily. Why? There’s a saying that stocks go up on an escalator and down on an elevator. Once a profitable trade starts to become oversold on the four-hour MACD, I start to take gains. Nothing like a short-covering rally to see your gains evaporate quickly, so I’m more proactive taking profits on short positions. I also use a 21-period EMA on the four-hour chart as a stop. If there is a close above the 21-period EMA, I tend to cover my short.
For updated charts, market analysis, and other trade ideas, give me a follow on Twitter: @mosaicassetco
Disclaimer: these are not recommendations and just my thoughts and opinions…do your own due diligence! I may hold a position in the securities mentioned in this newsletter.


