Mosaic Chart Alerts
FOMC didn't disappoint the bears. Removing PARR and CVEO as relative strength is becoming hard to find.
Welcome back to Mosaic Chart Alerts!
In this newsletter, I’ll focus on the best setups that I’m monitoring for both long and short positions. With a chart and short write-up, this is a quick way to scan and plan potential trade ideas.
And to select these ideas, a lot of work goes on behind the scenes to find stocks offering the right combination of fundamental attributes along with a proper chart setup.
These are my notes from a shortlist of setups I’m monitoring.
Weekly Recap
Ever since last week’s hotter-than-expected consumer inflation report, intense focus built up around the Federal Reserve as Chairman Powell and the rest of the FOMC concluded their latest meeting today. And they sure didn’t disappoint the bears. After choppy price action following the meeting statement and Powell’s press conference, stocks fell to their lows of the day with a decline of 1.7%. I’ll have more thoughts around the Fed in this weekend’s Market Mosaic.
With the volatility in the stock market, as well as emerging weakness in some sectors that were previously demonstrating relative strength, there’s been more turnover in my watchlist than usual. I added and removed several stocks from watch last week, particularly on the long side. Most new additions are still seeing constructive action in their breakout setups. But there are a couple more stocks that have been on the list for several weeks, and have not been able to complete their patterns. That includes PARR and CVEO that never triggered a trade and are now below key moving averages, so I am removing those from watch while making a few more new additions.
Long Trade Setups
ORA
Short-term consolidation with resistance at $98, which I would expect to be followed with a move over $100 to target the prior highs.
CCRN
Tested the $30 level numerous times since the start of the year. Trading just below that breakout level as MACD reset on most recent consolidation, which continues to hold above key moving averages as well.
NRP
A mineral properties LP stock that was testing the prior 52-week high at around the $50 level, which is my trigger. Today’s break below the 50-day moving average is a sign of weakness, so I will take this off watch next week if price can’t recover.
ENVX
Lithium battery producer that suffered a steep drop in stock price followed by a sharp recovery since July. Bull pennant pattern developing with $25 being my trigger level. This one is very speculative!
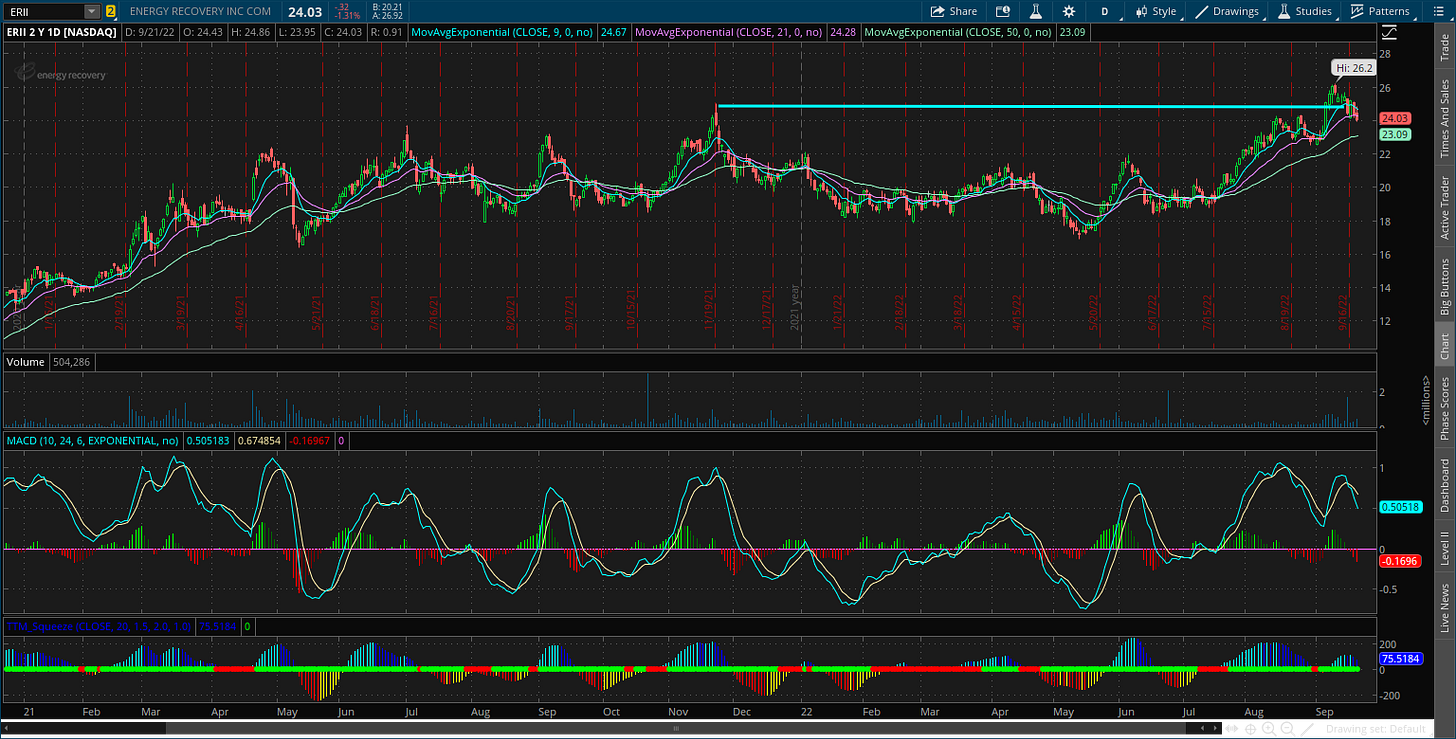
ERII
This one is starting to fail after attempting to breakout. Do not want to see this stock fall back into the consolidation area.
DINO
Still showing the weekly chart where a consolidation pattern could be setting up a test of the $57 breakout level. Want to see this stock hold the 10-week moving average.
Short Trade Setups
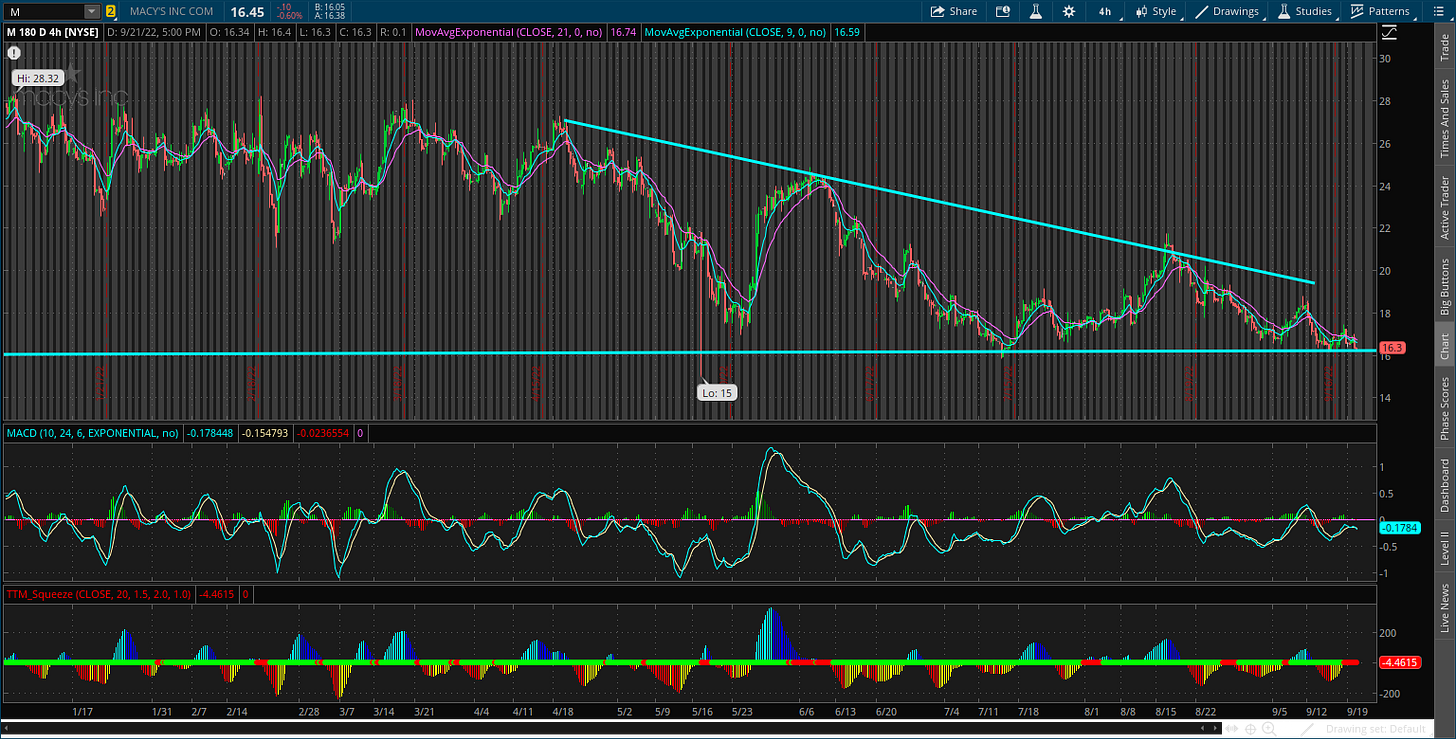
M
The $16 level is important support, which has been tested many times going back to 2021. MACD is recharged for another move lower.
CCL
Still trading inside the bear flag pattern since end of June, where a move below $9 could see the downside accelerate.
UAL
Setting up a descending triangle continuation pattern. Still monitoring for a break below $35.
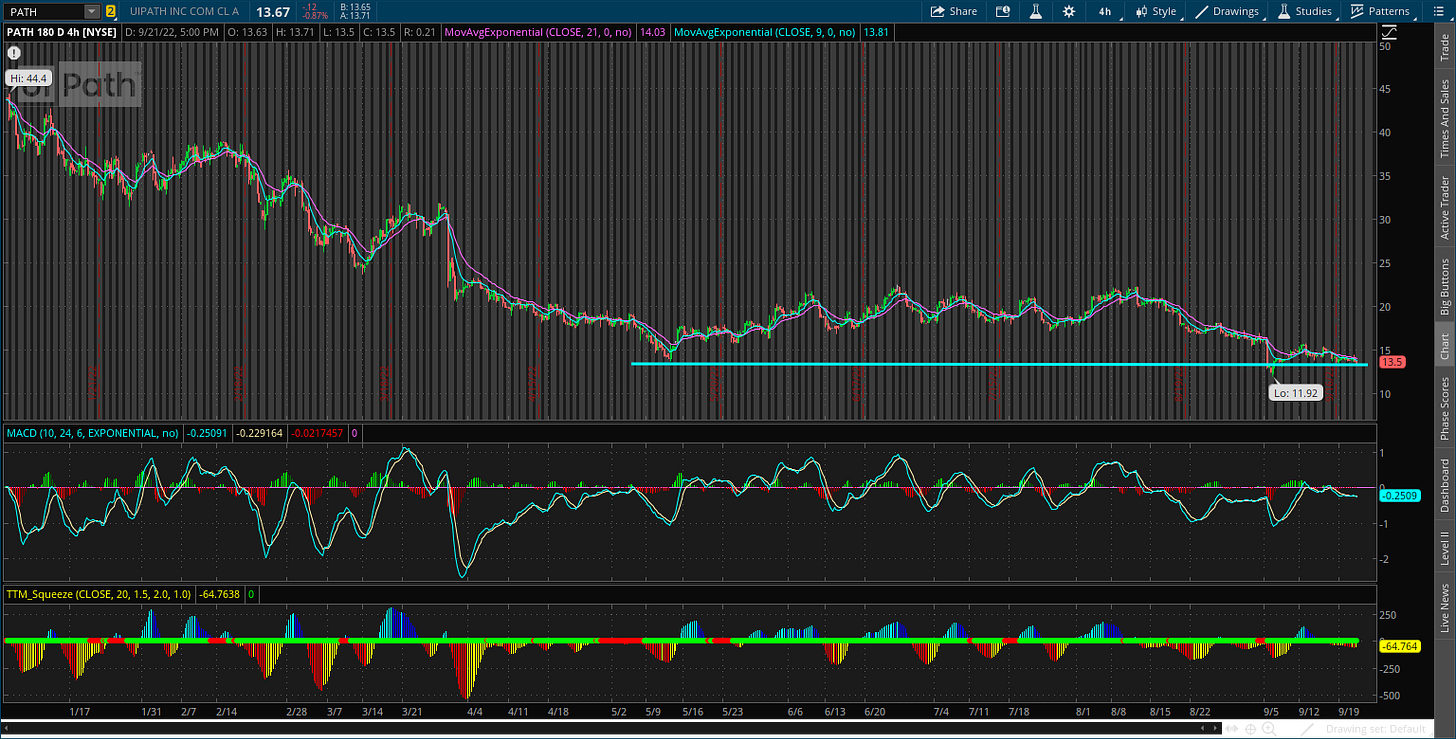
PATH
Support level at around $13 being tested. Initially rallied off this level back in May, where range bound trading since has allowed weekly momentum to recharge for another move lower.
Rules of the Game
If you haven’t noticed yet, I trade breakouts! I trade based on the daily chart for long positions. And for price triggers on long setups, I tend to wait until the last half hour of trading to add a position. I find that emotional money trades the open, and smart money trades the close. If it looks like a stock is breaking out, I don’t want a “head fake” in the morning followed by a pullback later in the day.
Also for long positions, I use the 21-day exponential moving average (EMA) as a stop. If in the last half hour of trading it looks like a position will close under the 21-day EMA, I’m usually selling whether it’s to take a loss or book a profit.
For short (or put) positions, I trade off a four-hour chart instead of a daily. Why? There’s a saying that stocks go up on an escalator and down on an elevator. Once a profitable trade starts to become oversold on the four-hour MACD, I start to take gains. Nothing like a short-covering rally to see your gains evaporate quickly, so I’m more proactive taking profits on short positions. I also use a 21-period EMA on the four-hour chart as a stop. If there is a close above the 21-period EMA, I will cover my short.
For updated charts, market analysis, and other trade ideas, give me a follow on twitter: @mosaicassetco
Disclaimer: these are not recommendations and just my thoughts and opinions…do your own due diligence! I may hold a position in the securities mentioned in this newsletter.


