Welcome to the very first issue of Mosaic Chart Alerts!
In this newsletter, I’ll focus on the best setups I’m monitoring for both long and short positions. With a chart and short write-up, this is a quick way to scan and plan potential trade ideas.
And to select these ideas, a lot of work goes on behind the scenes to find stocks offering the right combination of fundamental attributes along with a proper chart setup.
These are my notes from a shortlist of setups I’m monitoring.
Long Trade Setups
TAP
You’ll notice quite a few lengthy bases featured in my long setups, starting with TAP. The stock has been progressively trading in a tighter range as it nears resistance at $61, which is my breakout level.
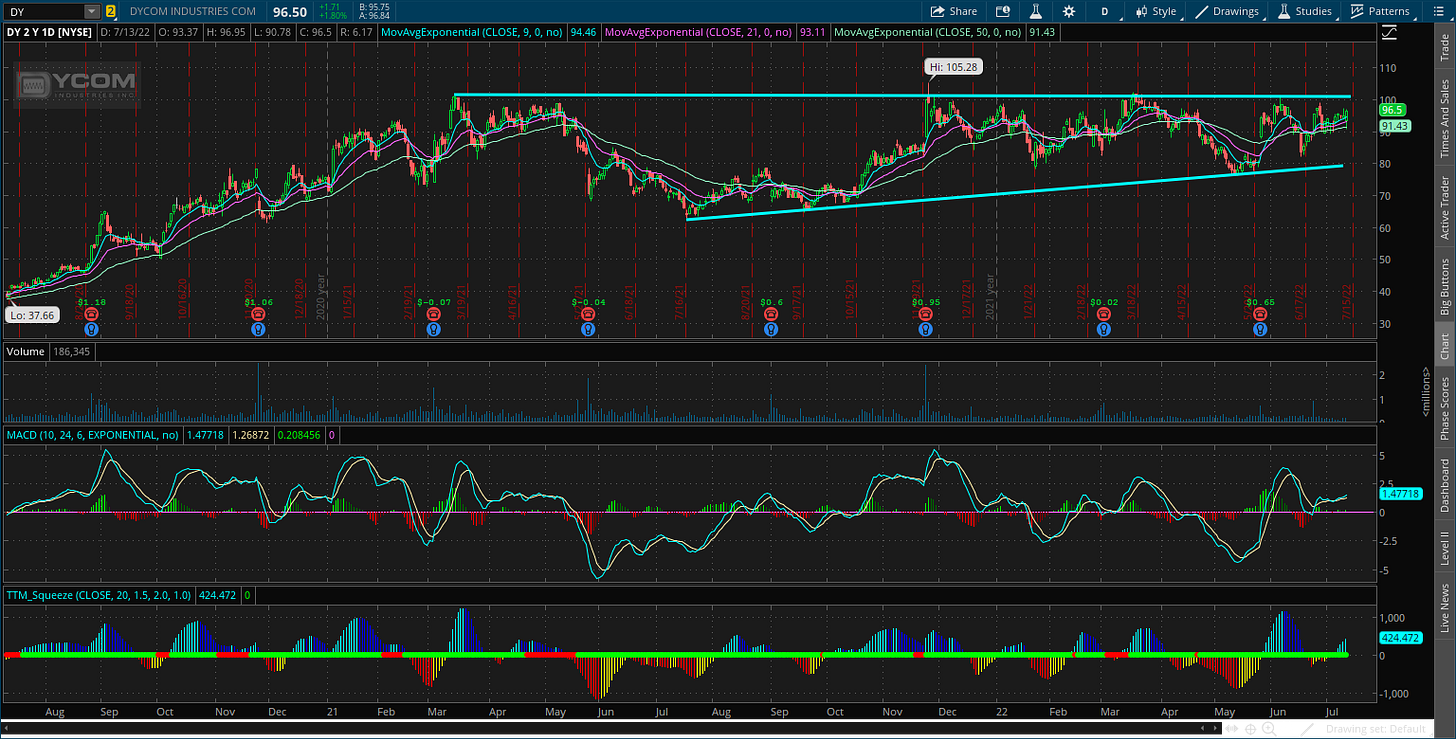
DY
Look at how many times this stock has tested the $100 level since March last year. The more a level is tested, the more likely it is to give way in my experiences. I’m using a close over $100 to add a position.
EVH
Evolent Health (EVH) is another stock right on the verge of triggering a buy signal. This stock has been basing for a move since October, and just in the past week tested resistance at $35. The stock is pulling back from that level, allowing momentum to reset. I’m just waiting for a close over $35 to trigger a position.
JKS
Initial resistance at $70 taken out last week on a strong volume day. Pulled back but holding above 20-day moving average. Next levels I’m watching are $75 and $80. Above $80 and it’s off to new highs.
HALO
Huge basing pattern. A close over $52 is the breakout level I’m watching with this one.
Short Trade Setups
JWN
Backtesting the trendline breakdown. Watching for a move under $20 to take a position.
LNG
Many former leaders in the commodity space turning to laggards. Are LNG plays next? Watching for a move below $120.
GVA
Monitoring for a trendline break under $28.
My Rules of the Game:
If you haven’t noticed yet, I trade breakouts! I trade based on the daily chart for long positions. And for price triggers on long setups, I typically wait until the last half hour of trading to add a position. I find that emotional money trades the open, and smart money trades the close. If it looks like a stock is breaking out, I don’t want a “head fake” in the morning followed by a pullback later in the day. So I verify a breakout by waiting for the close.
Also for long positions: I use the 20-day exponential moving average (EMA) as a stop. If in the last half hour of trading it looks like a position will close under the 20-day EMA, I’m usually selling whether it’s to take a loss or book a profit.
For short (or put) positions, I trade off a four-chart instead of a daily. Why? There’s a saying that stocks go up on an escalator and down on an elevator. Once a profitable trade starts to become oversold on the four-hour MACD, I start to take gains. Nothing like a short-covering rally to see your gains evaporate quickly, so I’m more proactive taking profits on short positions. I also use a 20-period EMA on the four-hour chart as a stop. If there is a close above the 20-period EMA, I usually cover my short.
For updated charts, market analysis, and other trade ideas, give me a follow on twitter: @mosaicassetco
Disclaimer: these are not recommendations and just my notes, thoughts, and opinions…do your own due diligence! I may hold a position in the securities mentioned in this newsletter.


