In today’s special report, I want to highlight a trade setup that recently passed my scans. Given the favorable setup, I wanted to dive further into the details relative to what I normally cover in The Market Mosaic and Mosaic Chart Alerts.
This post will also provide more insight into how I select my trade ideas, and why studying prior breakouts can be a powerful tool for spotting future winners.
Today’s trade idea is with Select Energy Services (WTTR). The company provides water services and infrastructure to oilfield companies. It’s primary exposure is the Permian basin (46% of revenue), but is diversified among other domestic basins as well.
WTTR’s setup is similar to how another energy sector stock was evolving in both fundamentals and chart pattern in March 2022. At that time, a breakout in Comstock Resources (CRK) saw the shares gain 60% in less than one month. So lets first take a look at CRK’s setup from last year, and then I’ll highlight the similarities with WTTR.
First, consider the reason why investors would be attracted to CRK’s stock. At a time when Fed rate hikes were just getting underway and storm clouds were developing with the economic outlook, CRK was experiencing a boom in sales and earnings growth. Prior to breaking out in late March, CRK averaged 400%+ earnings growth in the prior four quarters while sales growth averaged 117% in the same span.
A model score taking into account CRK’s stock price momentum, analyst revisions, profitability, and growth metrics scored the stock in the 84th percentile before the breakout took place.
Now look at the chart setup leading up to CRK’s big move higher.
Point 1 marks the end of a rally in October 2021, which started a six month consolidation process that created a resistance area around the $10 to $11 level. Point 2 marks a transition in the base when the stock started making a series of higher lows. Point 3 shows the MACD crossing back above the zero line and resetting before the breakout attempt. Point 4 shows the breakout which came on higher volume, while Point 5 shows the relative strength line confirming the breakout.
Now lets take a look at WTTR and the similarities with CRK. First, WTTR is coming off a string of strong quarterly sales and earnings growth. Over the past four quarters, the company has averaged year-over-year growth of 97% on the top line and 175% on the bottom line.
Earnings are also projected to grow 85% in 2023 compared to last year. Looking at expected growth along with other model factors noted above ranks the stock in the 98th percentile for its score.
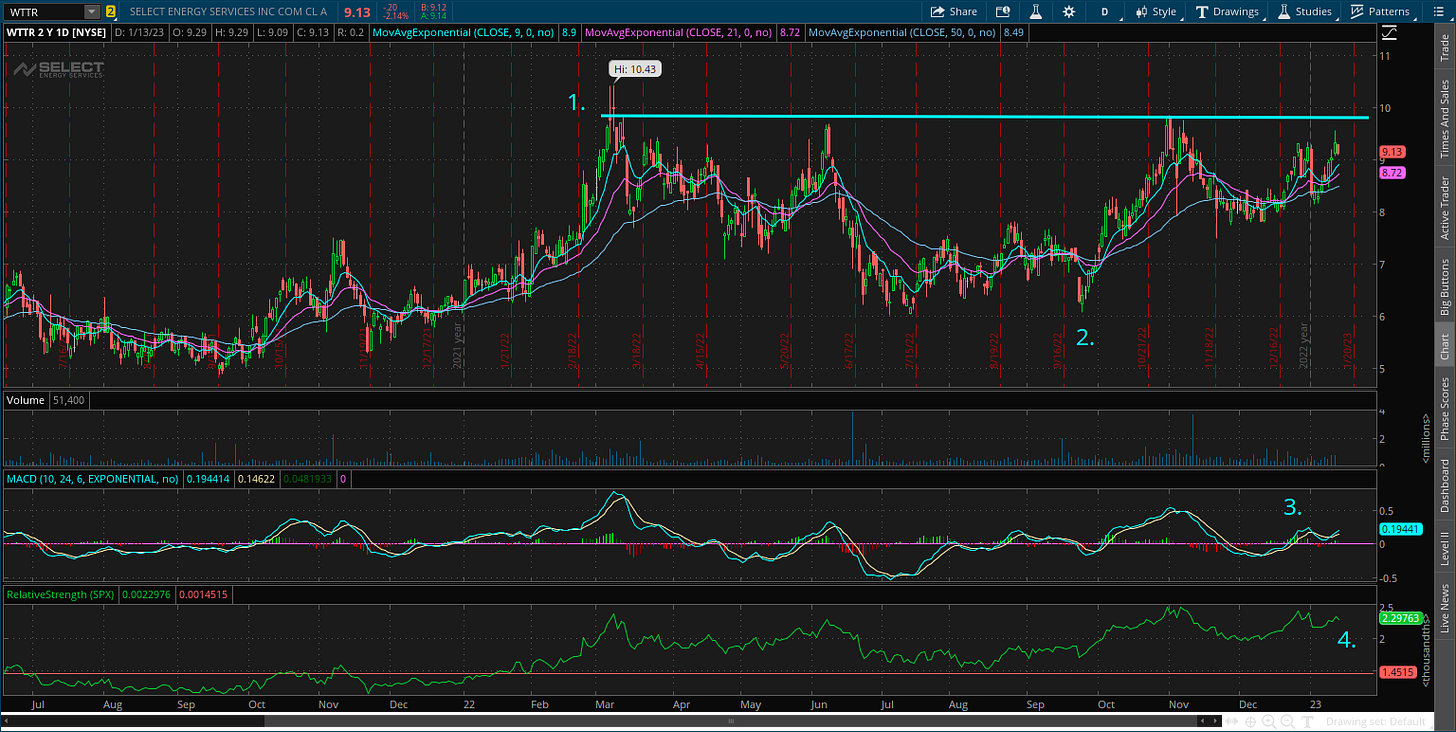
Now look at WTTR’s chart setup.
Point 1 marks the start of a nine month consolidation process that’s still ongoing, with resistance just below the $10 level. Point 2 shows the transition to a series of higher lows in the stock price. At point 3 we have the MACD moving back above the zero line and has also recently reset. Point 4 shows the relative strength line in a good position to confirm a breakout if price does take out the $10 resistance level.
There’s certainly no guarantee that WTTR’s stock price will mimic CRK from last year, and I currently do not have a position in WTTR. I’m watching for price to close above the $10 area along with the relative strength line breaking out to new highs. Ideally, that breakout would happen on higher volume as well.
Thanks for reading this special report! This has been a tough stock market environment to trade. But as studying past winners shows, you can still find profitable buying opportunities even in a bear market.
I cover my thoughts on the stock market and share trade ideas I’m monitoring at The Market Mosaic. It’s free to read and subscribe, so please consider signing up below!
For updated charts, market analysis, and other trade ideas, give me a follow on Twitter: @mosaicassetco
Disclaimer: these are not recommendations and just my thoughts and opinions…do your own due diligence! I may hold a position in the securities mentioned in this newsletter.


Thank you. Have a pleasant weekend
Cheers