

👋Welcome back to The Market Mosaic, where I gauge the stock market’s next move by looking at macro, technicals, and market internals. I’ll also highlight trade ideas using this analysis.
If you find this report helpful please hit that “like” button, share this post, and become a subscriber if you haven’t already done so!
🚨And be sure to check out Mosaic Traders Hub. It’s a members-only platform to alert trade ideas, track a model portfolio of open positions, and further analyze the message coming from the capital markets.
Now for this week’s issue…
An August payrolls report that smashed expectations is adding additional pressure to the Federal Reserve to hike interest rates at its next meeting.
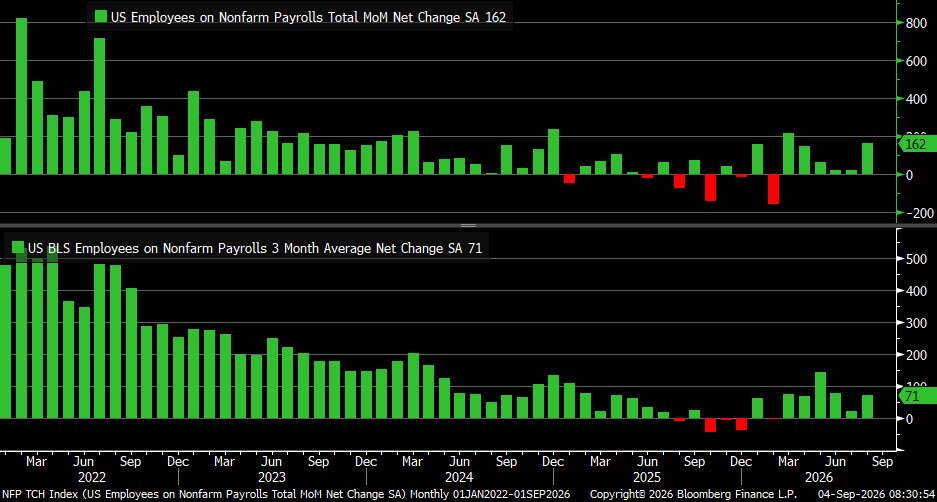
Nonfarm payrolls added 162,000 jobs last month which was triple the 53,000 expected and brings the three-month average to 71,000 (chart below). The prior two months were also revised higher by a combined 55,000. Along with a low level of weekly jobless claims, data suggests the labor market is strong.
Evidence of a decent labor market could pressure recent comments from Fed Governor Christopher Waller, who favors keeping rates steady in September assuming no big surprises across inflation reports this week.
But various measures of consumer inflation have run above the Fed’s 2% target for over five years. That means the Fed’s dual mandate of full employment along with price stability support rate hikes in the months ahead.
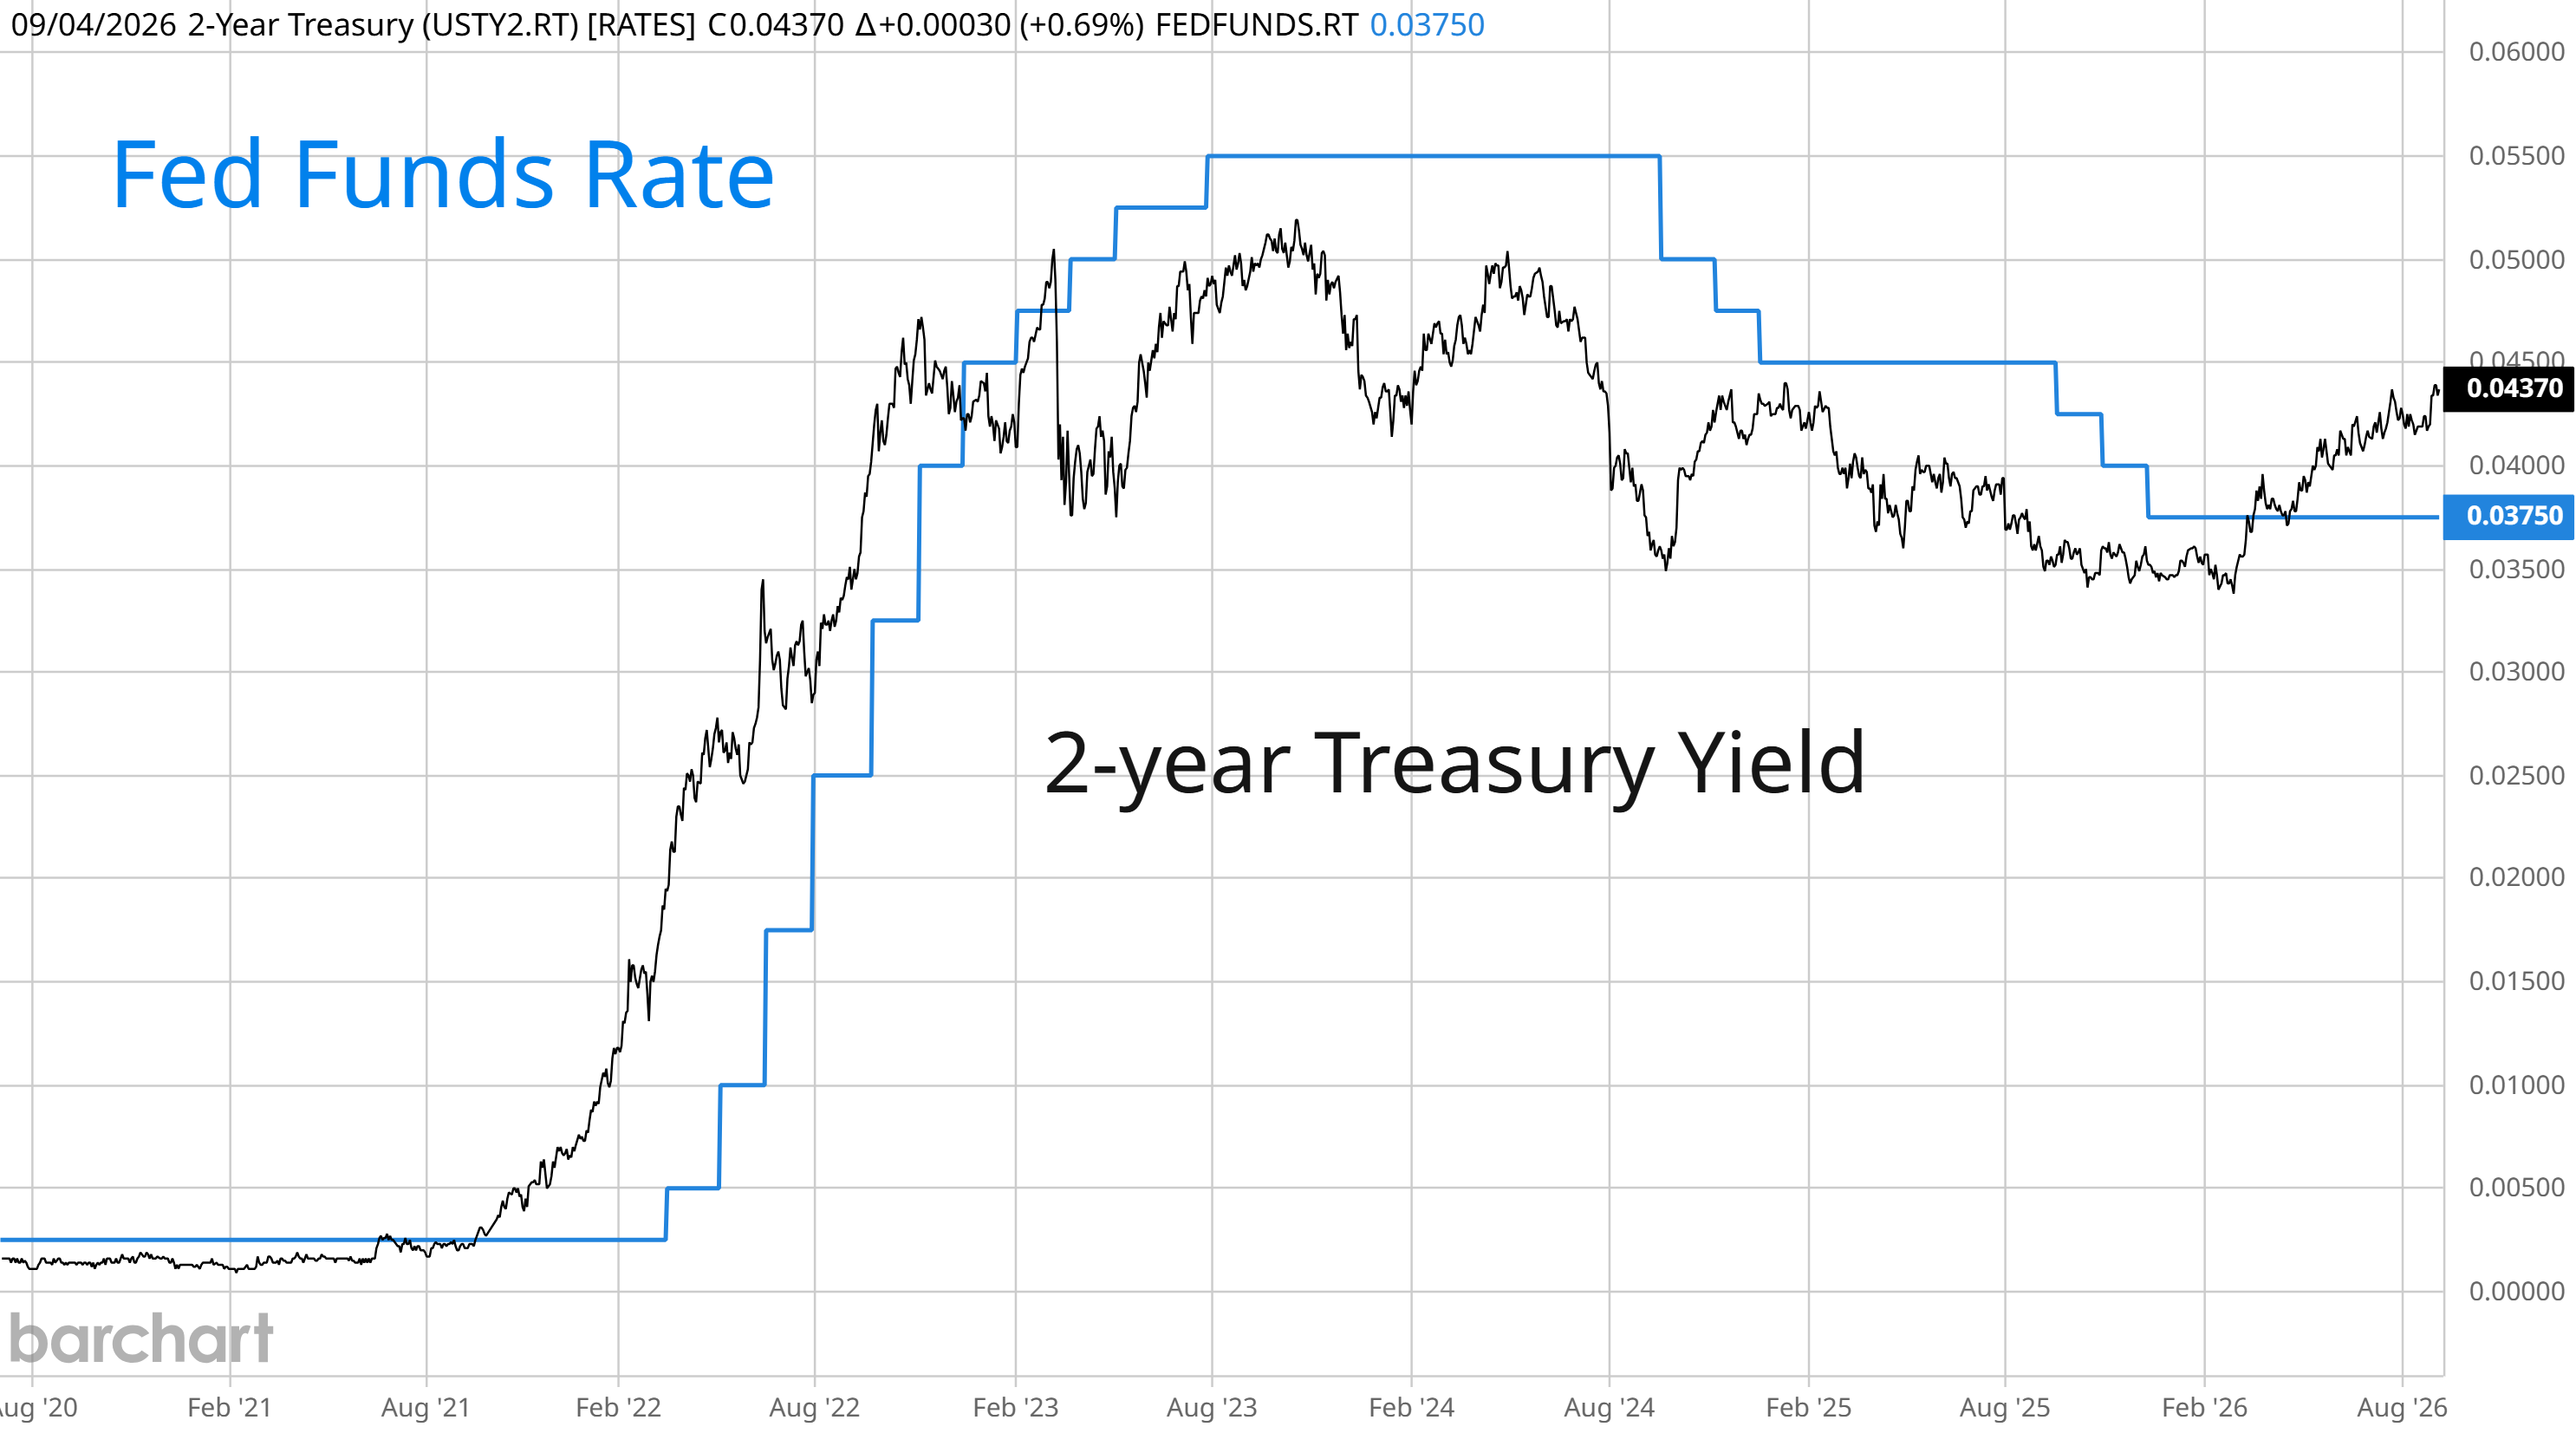
The bond market agrees, with the 2-year Treasury yield currently sitting 62 basis points above the current upper fed funds target. The 2-year yield tends to lead changes in the fed funds rate and is implying the bond market expects at least two rate hikes ahead.
While investors are on edge over the potential for a renewed hiking cycle, a slow pace of rate increases shouldn’t derail the bull market. Part of the pressure on rates is a strong economy, which should also be a tailwind for the earnings picture.
The stock market should be able to handle measured increases in the fed funds rate, provided that inflationary pressures don’t push the Fed into a quick pace of hikes like back in 2022.
This week, let’s look at market-based evidence that Fed rate hikes could be around the corner, and the latest chart breakout signaling higher inflation in the months ahead. We’ll also look at why volatility is running much higher than the VIX would suggest and why price swings could pick up soon.
The Chart Report
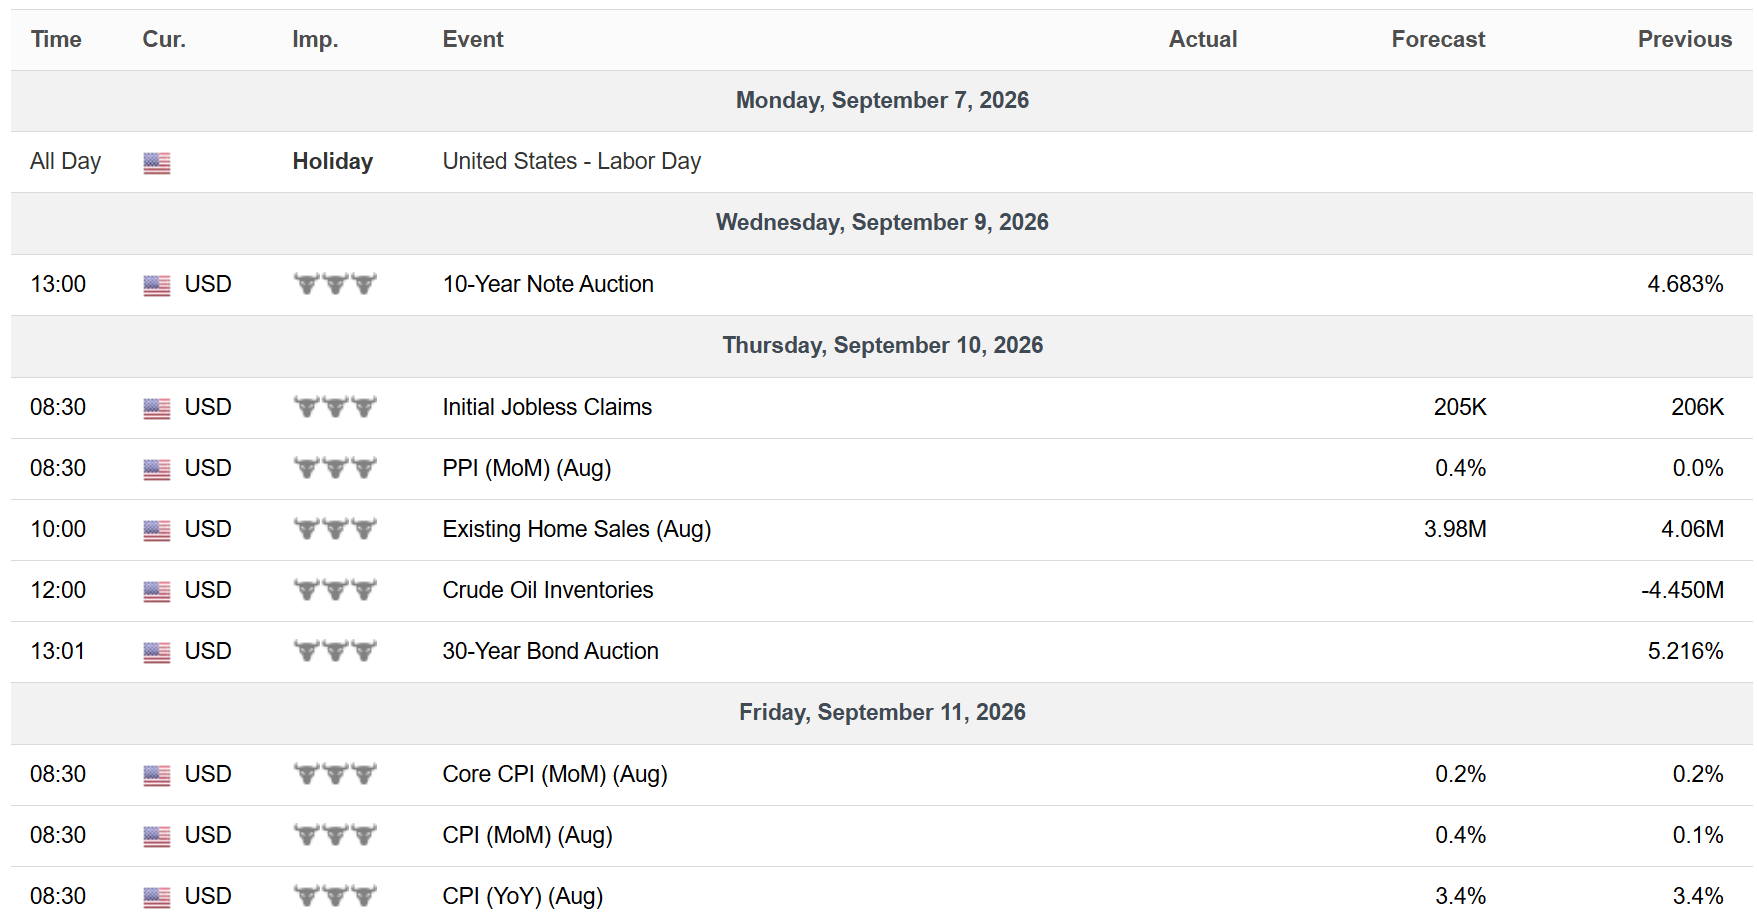
Following a strong payrolls report, investor attention will turn toward consumer and producer inflation data due to be released this week. Expectations for a Fed rate hike at their upcoming September meeting is bouncing all over, with odds pushed higher by a hawkish tone from Fed Chair Kevin Warsh at Jackson Hole and tempered by dovish talk from Waller last week. Current odds implied by fed funds futures shows a 60% chance of a rate hike at the next meeting. The bond market also agrees on tighter policy. The 2-year Treasury yield tends to lead changes in the fed funds rate and currently sits 62 basis points above the upper end of the target range (chart below).
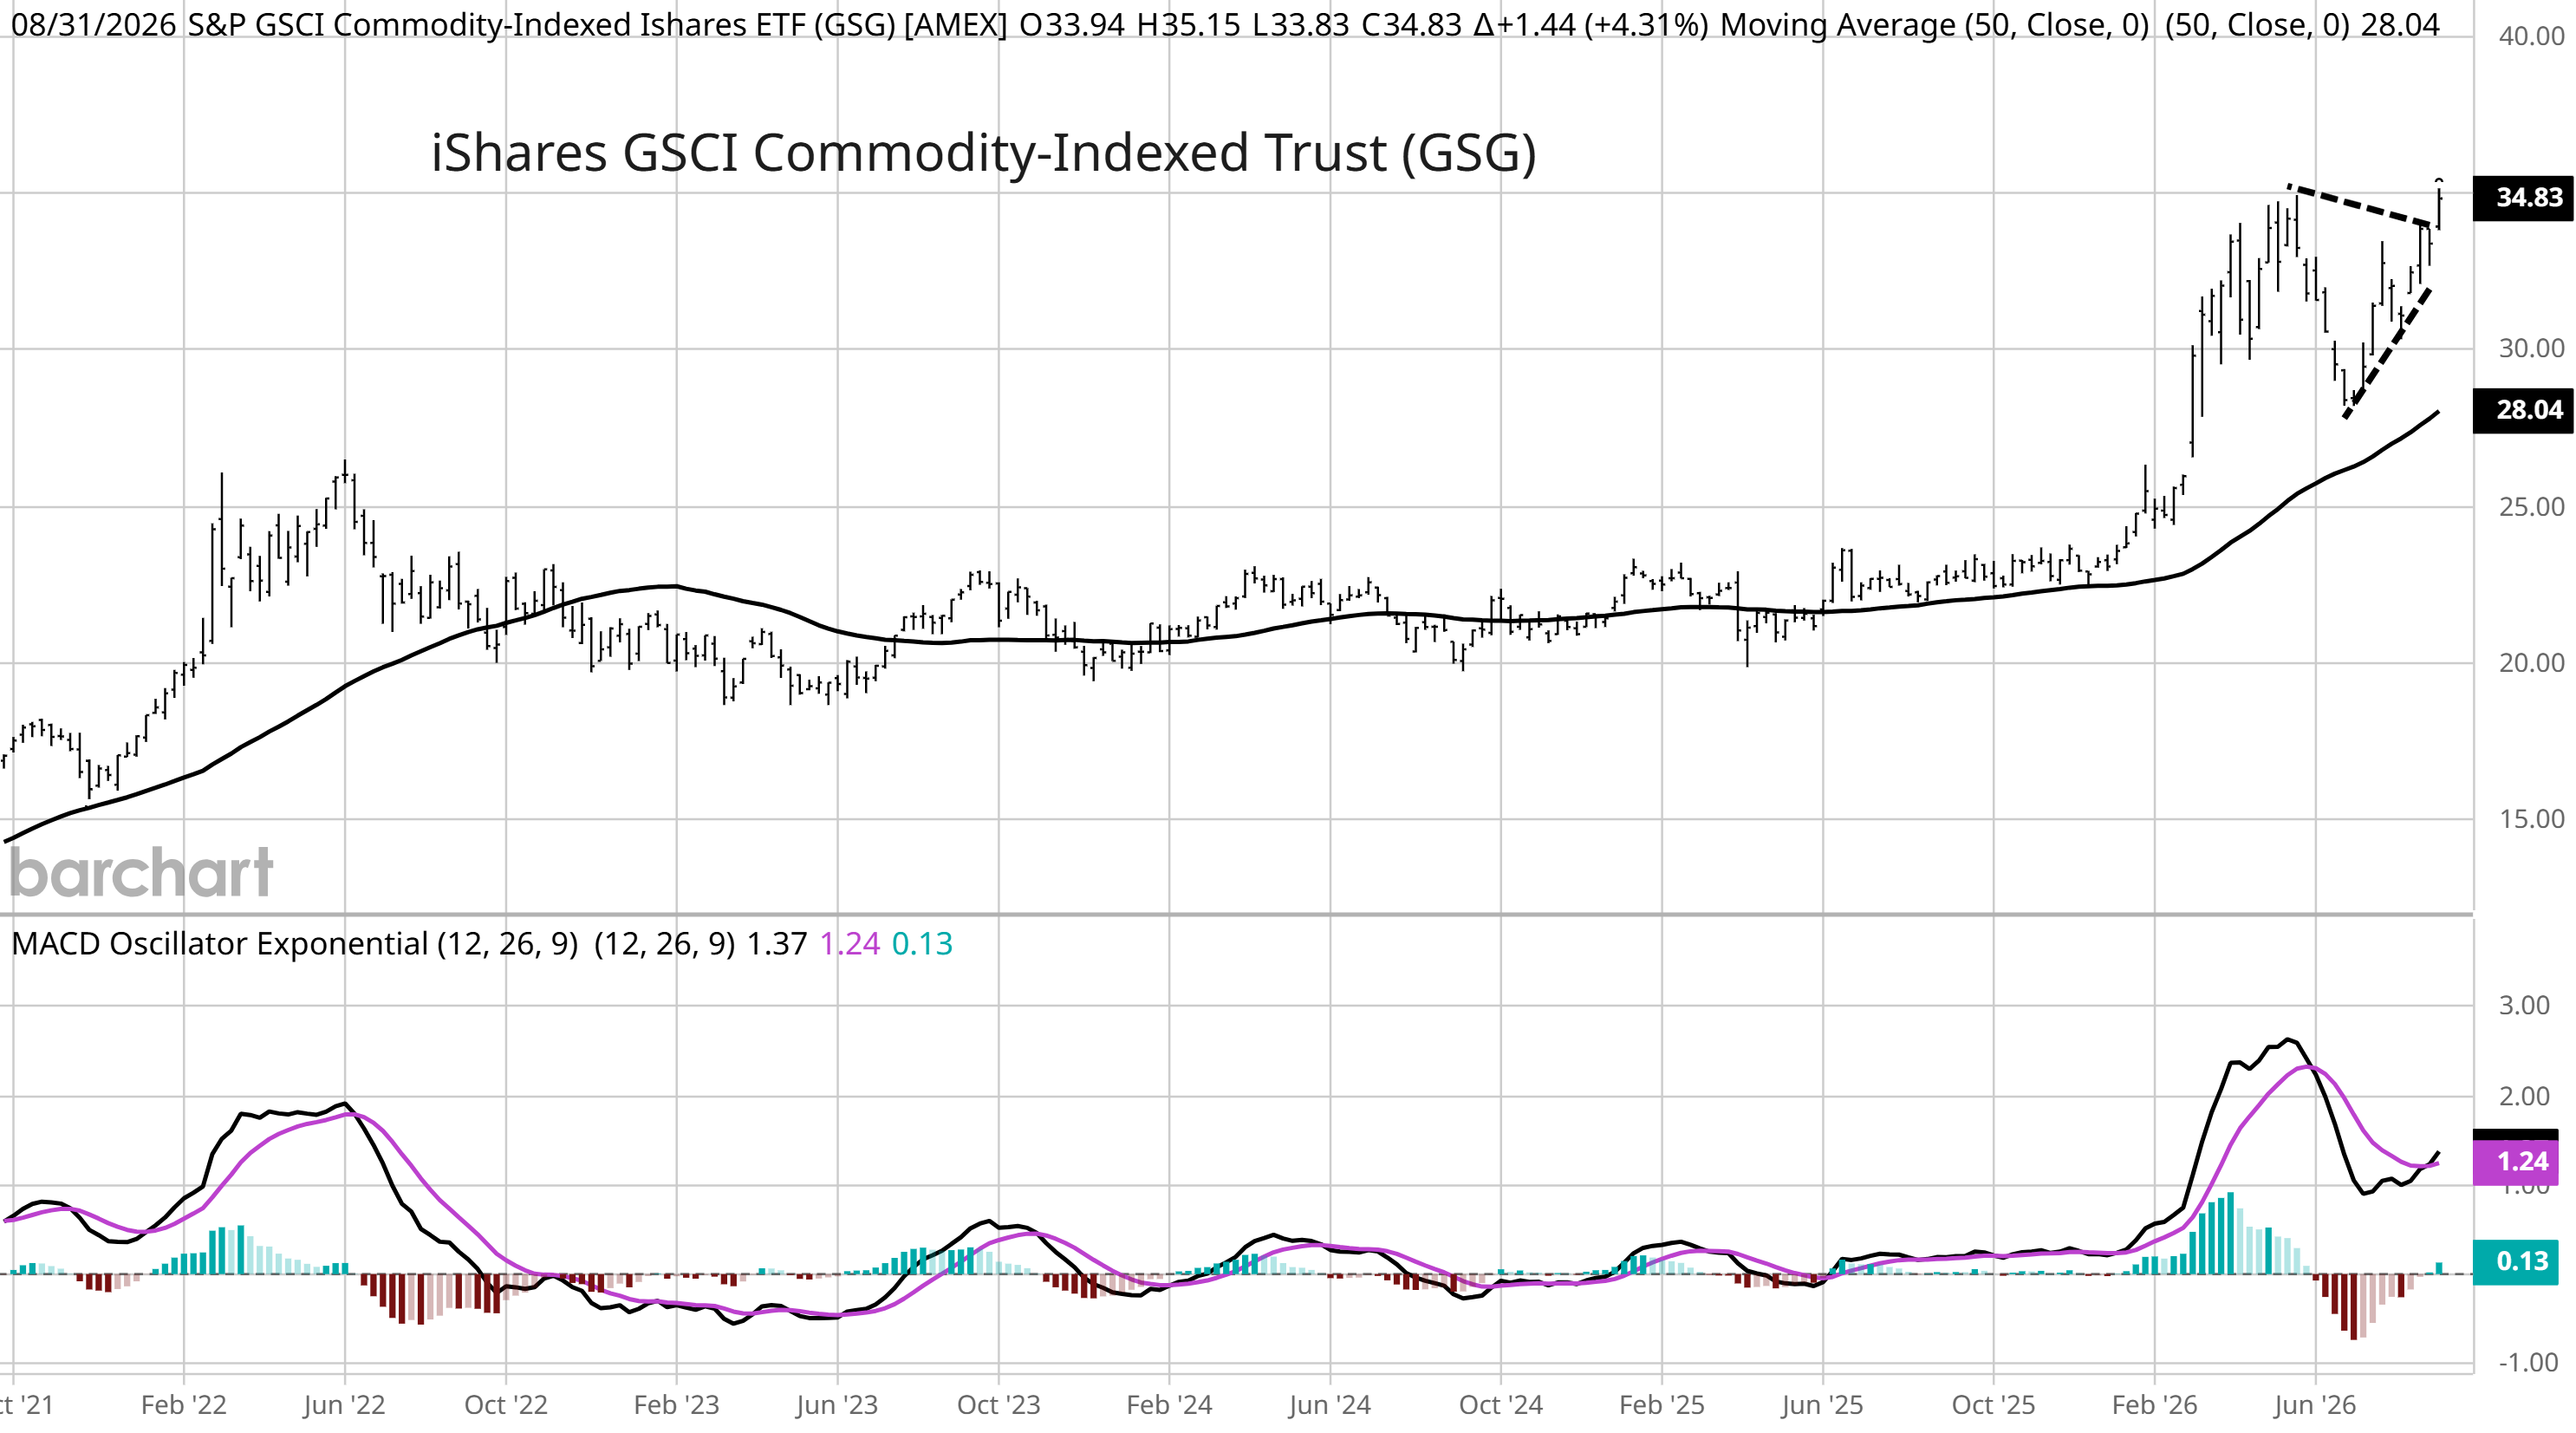
A fresh break out in commodities could add further upside to inflation in the months ahead. Everything from energy to metals and agricultural products are rising on supply and demand imbalances. The flow of tanker traffic through the Strait of Hormuz remains limited which is impacting oil and supplies used for farm fertilizers. Wheat supplies are taking a hit as Russia and Ukraine target attacks on grain terminals, where both countries comprise a quarter of the world’s wheat exports. And data center construction is boosting demand for copper. The iShares S&P GSCI Commodity-Indexed Trust ETF (GSG) that tracks a broad basket of commodities is breaking out from continuation triangle which follows a move out of a massive basing structure earlier this year.
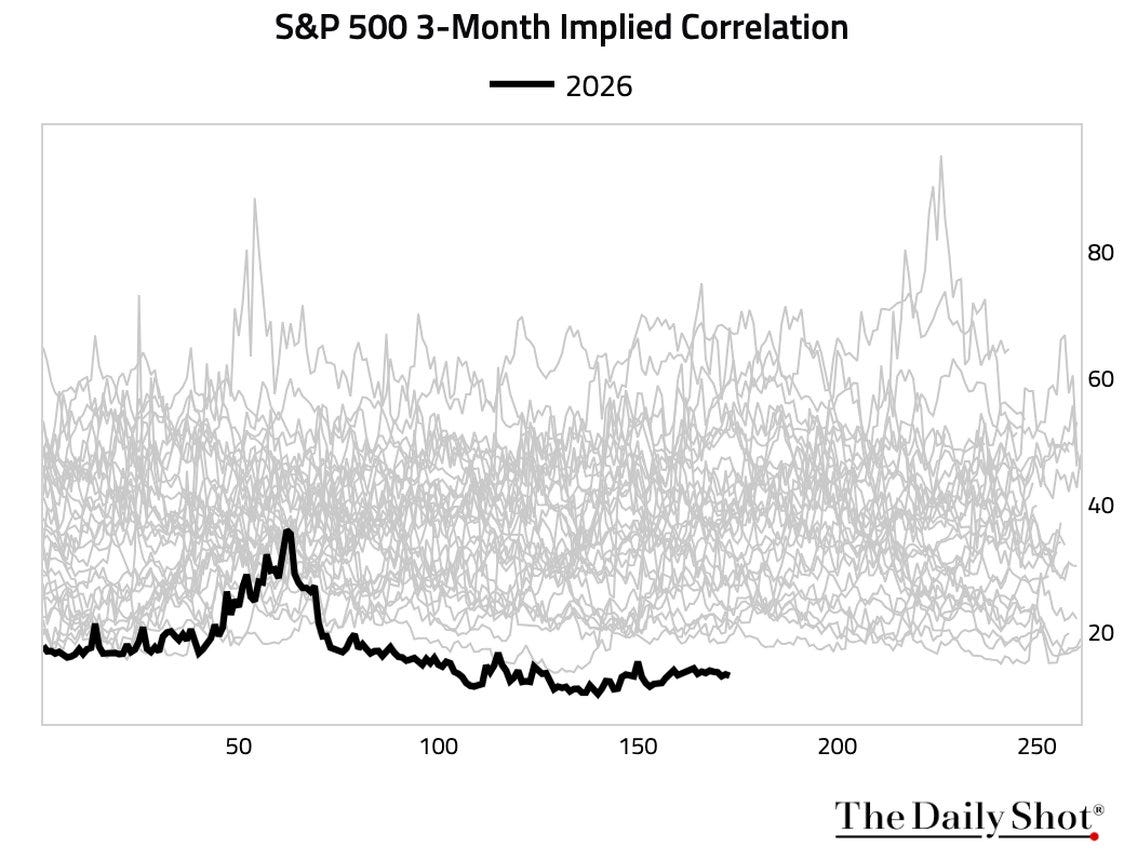
While broader market volatility dries up, there are large divergences happening under the market’s hood. The CBOE Volatility Index (VIX) touched its lowest level of the year last week and has closed between the 14-17 point range for 25 consecutive trading days. That’s the longest streak since 1992. But return dispersion within the S&P 500 has been running much higher. Weekly return differentials have been running at elevated levels while the 3-month implied correlation for stocks within the S&P are running at record low levels (chart below). While the price action on the surface of the index appears calm, there are outsized moves happening under the hood.
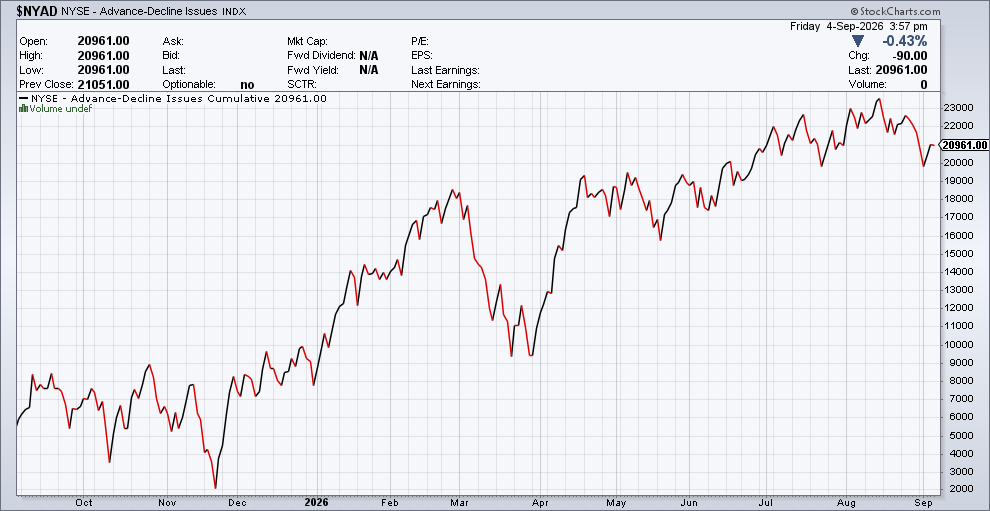
While broader stock market volatility is running at low levels, a couple catalysts could result in larger price swings ahead. The first is with calendar seasonality, with September ranking as the worst month of the year based on both average returns and win rate using data going back to 1950. It’s also worth noting that poor seasonals in September are concentrated in the last two weeks of the month. At the same time, a negative breadth divergence is forming on the NYSE. The chart below shows the cumulative advance/decline line for securities listed on the NYSE, and is a way to track the average stock. The A/D line peaked in mid-August and is turning lower even as the S&P 500 moves sideways and remains near the high.
Trade Idea
Lumentum Holdings (LITE)
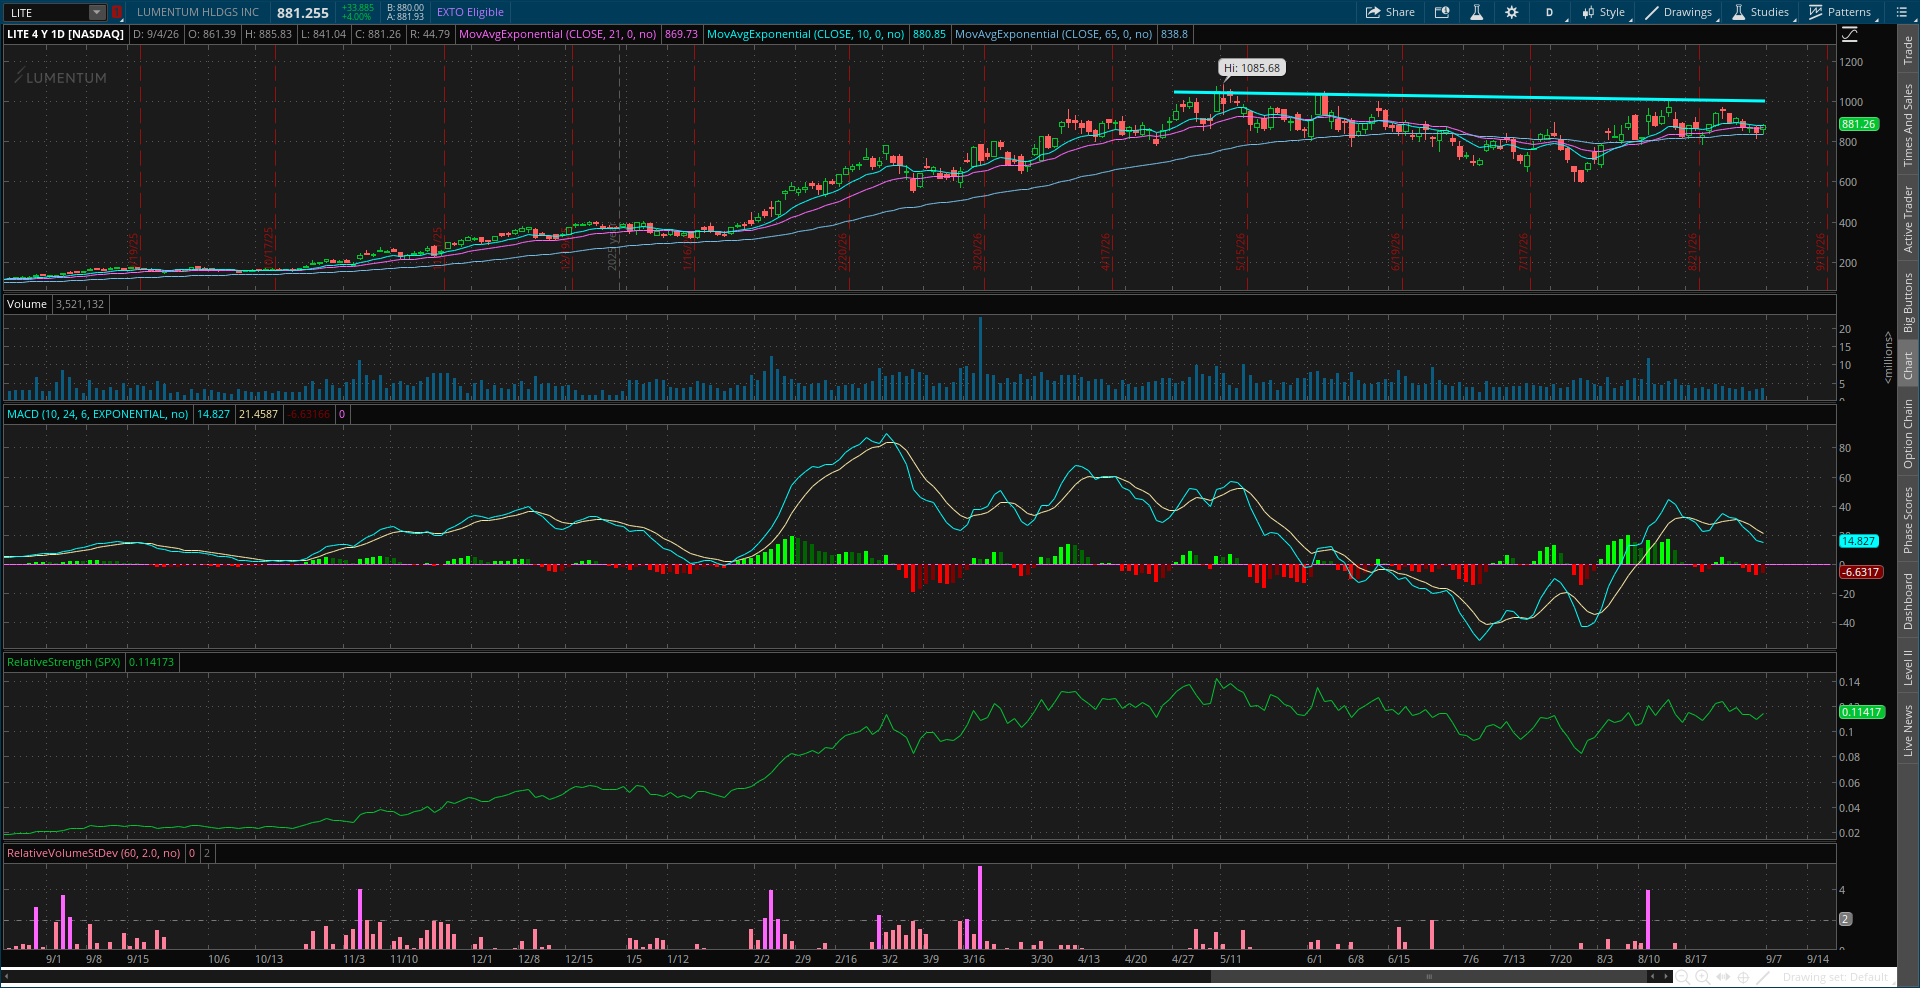
The stock topped just above $1,000 in May and is forming a new basing pattern. Recently completed a smaller pullback following a test of resistance that reset the MACD at the zero line. I’m watching for a move over $1,000.
Heard in the Hub
The Traders Hub features live trade alerts, market update videos, and other educational content for members.
Here’s a quick recap of recent alerts, market updates, and educational posts:
The setup you need to watch in mining stocks.
How to tell when rising rates will spillover to equities.
Global sovereign yields highest since the financial crisis.
Increasing money supply boosting gold’s appeal (and price target).
Sectors showing the best relative strength as the S&P 500 consolidates.
You can follow everything we’re trading and tracking by becoming a member of the Traders Hub.
By becoming a member, you will unlock all market updates and trade alerts reserved exclusively for members.
Key Upcoming Data
Economic Reports
Earnings Reports
I hope you’ve enjoyed The Market Mosaic, and please share this report with your family, friends, coworkers…or anyone that would benefit from an objective look at the stock market.
Become a member of the Traders Hub to unlock access to:
✅Model Portfolio
✅Members Only Chat
✅Trade Ideas & Live Alerts
✅Mosaic Vision Market Updates + More
Our model portfolio is built using a “core and explore” approach, including a Stock Trading Portfolio and ETF Investment Portfolio.
Come join us over at the Hub as we seek to capitalize on stocks and ETFs that are breaking out!
And if you have any questions or feedback, feel free to shoot me an email at mosaicassetco@gmail.com
Disclaimer: these are not recommendations and just my thoughts and opinions…do your own due diligence! I may hold a position in the securities mentioned in this report.
Your GSG breakout call is worth watching closely, because that index leans heavily on energy, and energy is exactly where institutional consensus is stuck.
Our own allocator panel has Energy sitting neutral, 15.4% overweight against 23.1% underweight, the most indecisive reading in the commodity complex.
A technical breakout with an undecided consensus behind it tends to move faster once the crowd finally picks a side.