
The Market Mosaic 9.7.25
Is the Fed's Rate Cut a Warning Sign of Recession on the Horizon?

👋Welcome back to The Market Mosaic, where I gauge the stock market’s next move by looking at macro, technicals, and market internals. I’ll also highlight trade ideas using this analysis.
If you find this report helpful please hit that “like” button, share this post, and become a subscriber if you haven’t already done so!
🚨And be sure to check out Mosaic Traders Hub. It’s a members-only platform to alert trade ideas, track a model portfolio of open positions, and further analyze the message coming from the capital markets (👇be sure to check out our special offer below).
Now for this week’s issue…
A negative surprise on August payrolls is leading to recession fears and solidifying the outlook for interest rate cuts from the Federal Reserve.
Nonfarm payrolls for the month of August came in at just 22,000 which missed estimates for an increase of 75,000. Prior months also saw downward revisions to job growth estimates.
June was revised lower from the initial estimate of adding 147,000 jobs to showing that 13,000 jobs were actually lost during the month. That ends the streak of payroll gains at 53 months that started in 2021, which was the second longest streak on record (chart below).

The payrolls figures fell outside the stock market’s “Goldilocks” zone for a positive market reaction. A figure in line with estimates would show job growth is running weak enough to keep the outlook for rate cuts intact but not stoke recession fears.
Coupled with more downward revisions to prior months, the August figure was a large enough miss to raise concerns about the health of the economy while boosting the outlook for rate cuts.
But at the same time, there’s more evidence emerging that the economic fog around the trade war is lifting, and that leading indicators of activity are back in expansionary territory.
That’s an important development because once the Fed starts cutting rates again, the historical data suggests that the forward path for the S&P 500 will come down to one key factor, and that’s if the economy tips into recession or avoids it.
This week, let’s look at the rapid repricing for rate cuts following the weak payrolls report. We’ll also look at more evidence that economic growth is actually accelerating despite recent jobs data, and why that’s key to the outlook for the S&P 500 once the Fed resumes cutting interest rates.
The Chart Report
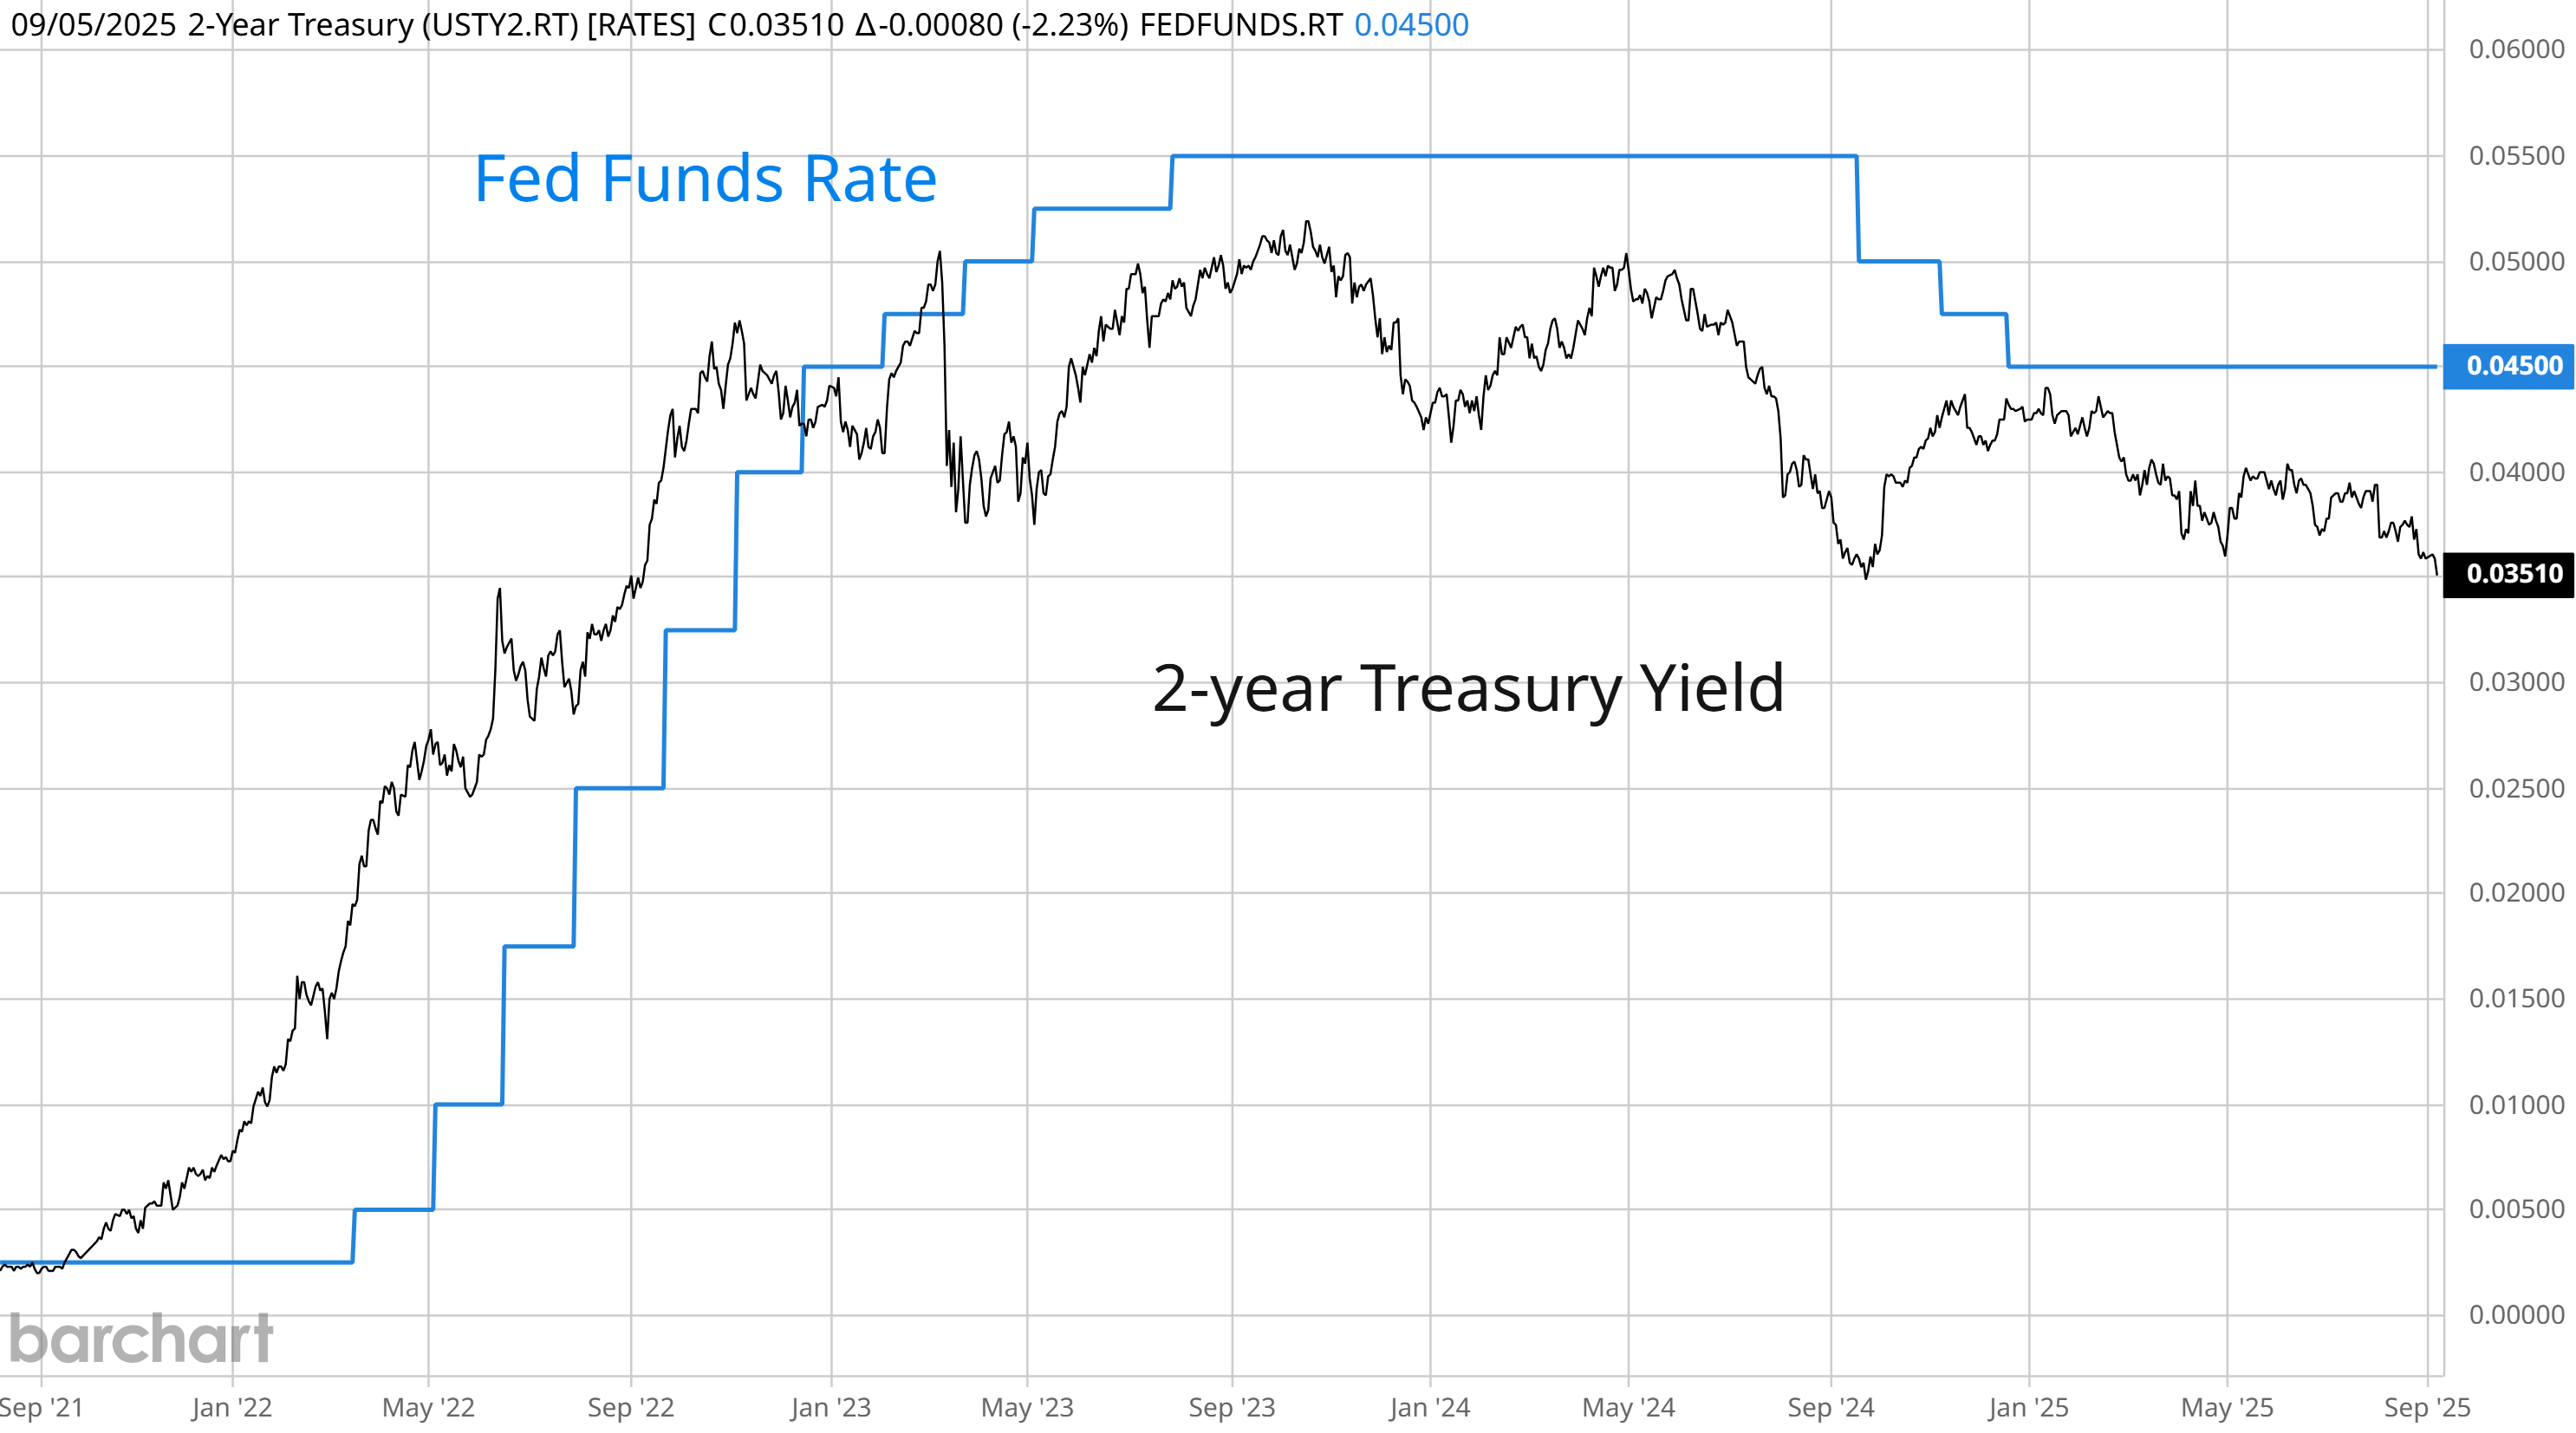
Expectations for Fed rate cuts are jumping following the weak payrolls report. During his speech at Jackson Hole, Fed Chair Jerome Powell already broadcast a pivot to concerns on the the labor market and away from rising inflation. Market implied odds currently show six quarter point rate cuts are now expected over the next year. The 2-year Treasury yield is showing more rate cuts ahead as well. The 2-year Treasury tends to lead changes in the fed funds rate (chart below), and is now trading 1.0% below the high end of the current fed funds target range. The 2-year is also close to breaking below a key level at 3.50%, which if broken to the downside could even point to an outsized rate cut at the next meeting.
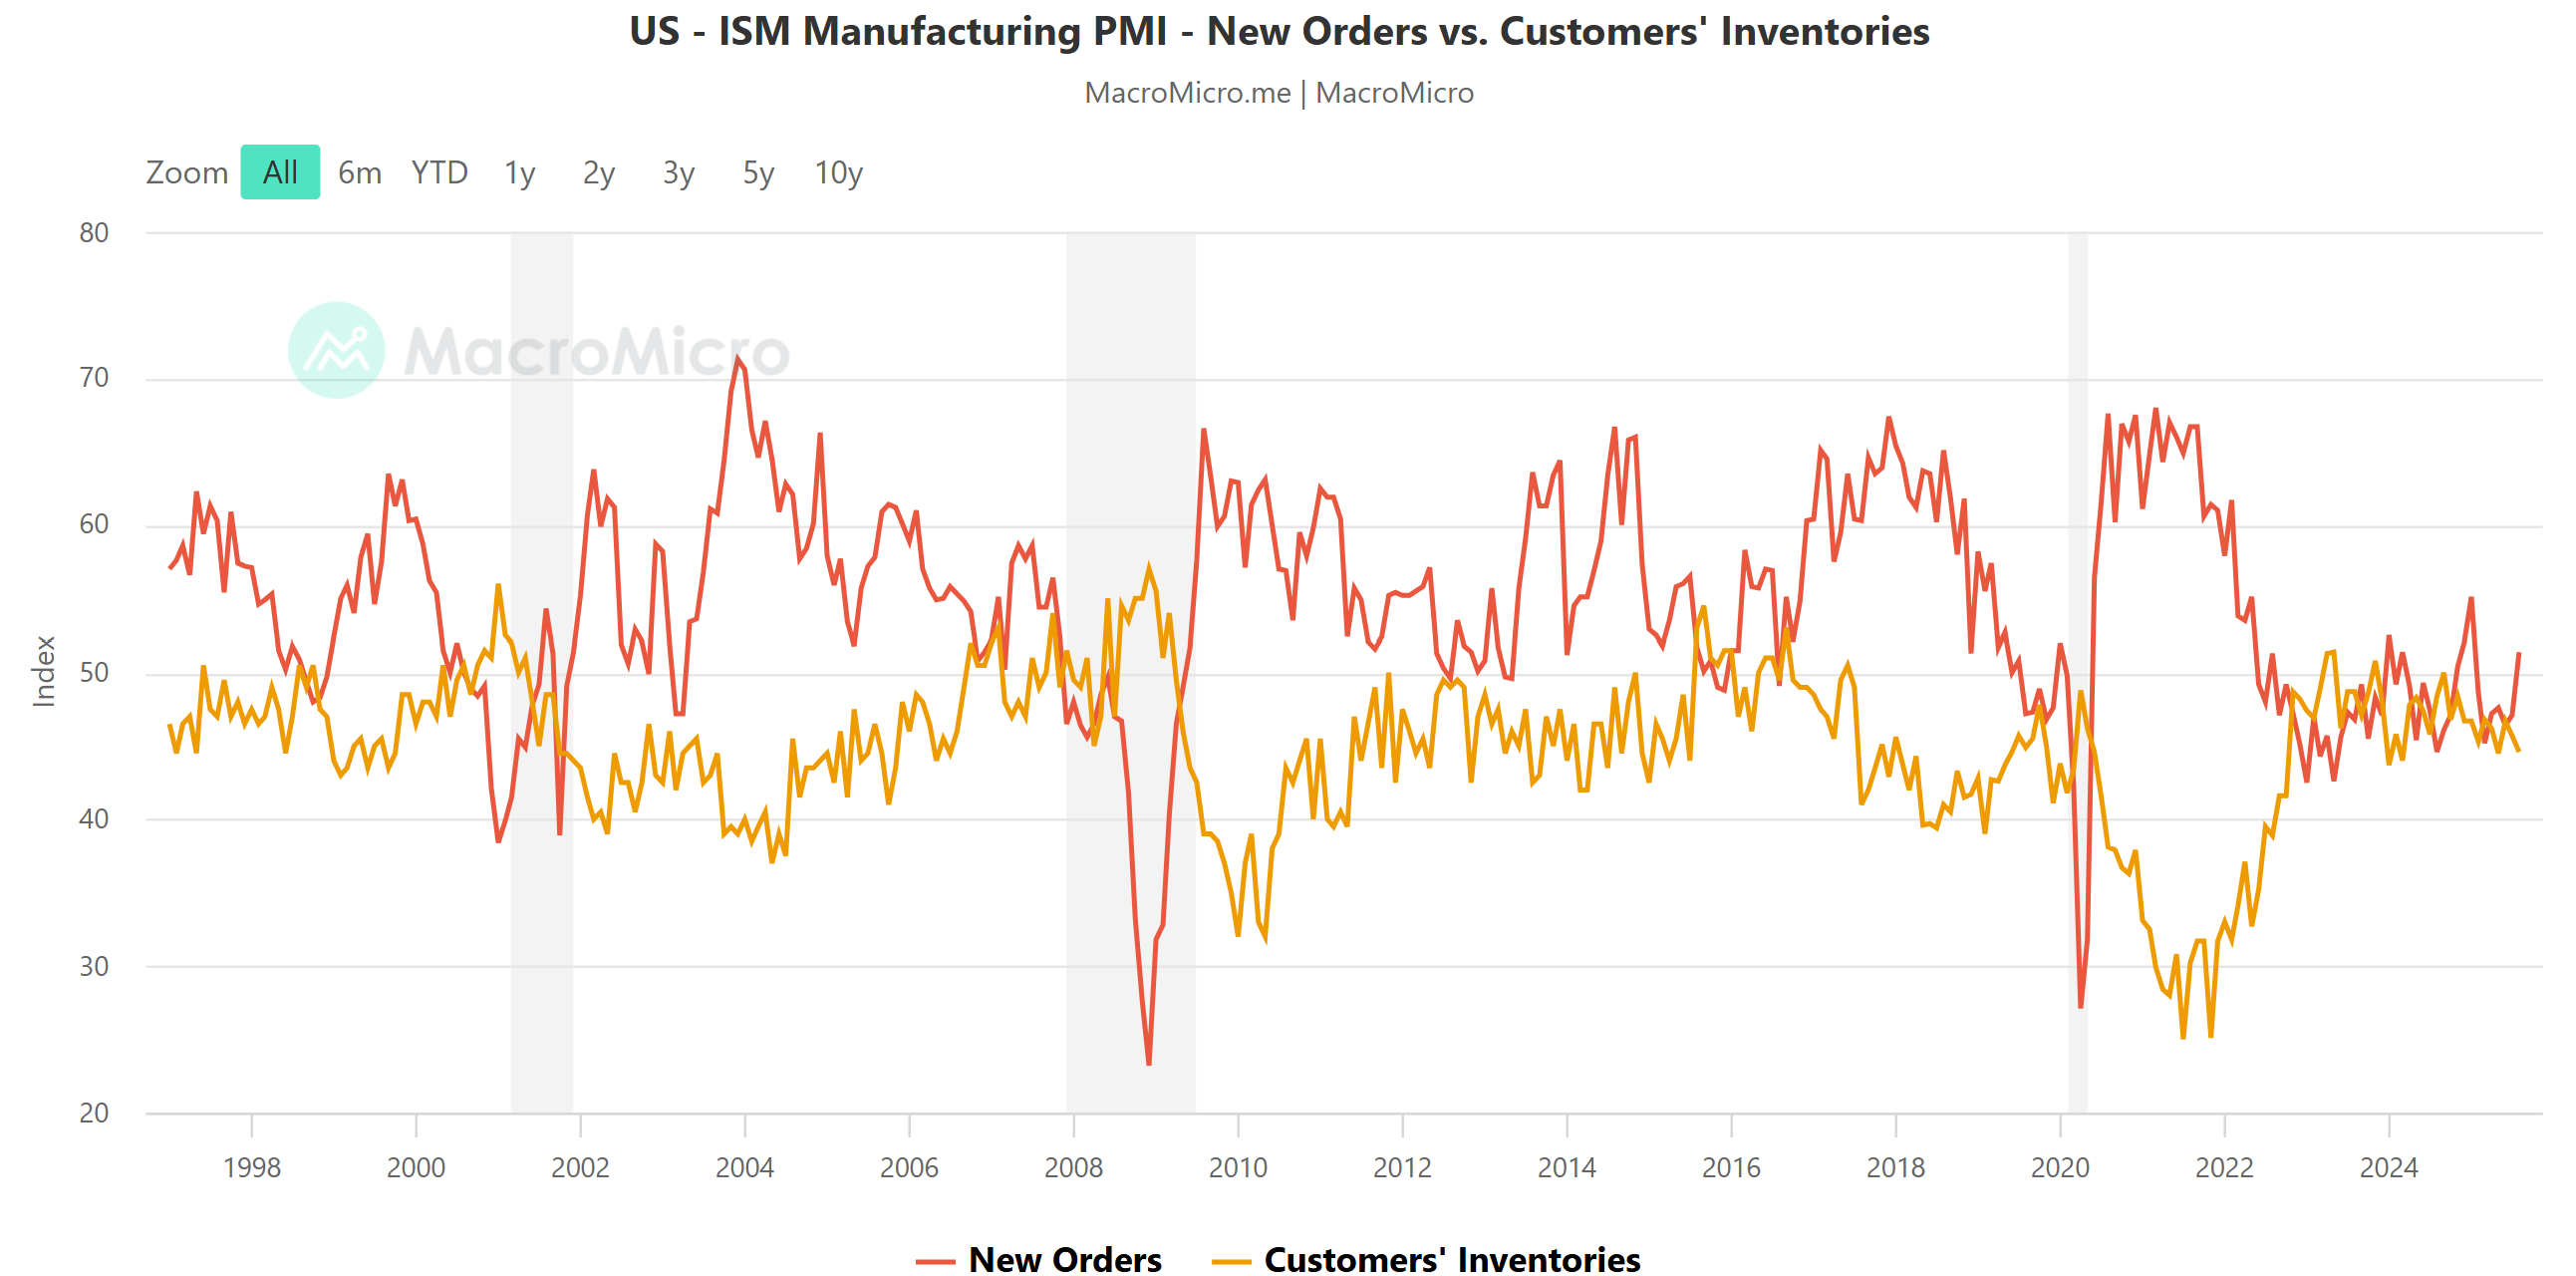
As recession fears grow, the market is pricing more Fed rate cuts ahead. But labor market data are among the last economic indicators to shift in response to changes in the underlying economy. Other leading indicators of activity are actually starting to pick up. That could suggest that uncertainty around the trade war earlier in the year, which is just now being reflected in labor market data, is clearing and that’s supporting a rebound in the economy. The ISM reports on manufacturing and service sector activity are a mixed bag, but the leading new orders component is gaining in both surveys. A reading above 50 indicates expansion, and the most recent reports show manufacturing new orders at 51.4 and services new orders at 56.0. That’s a sharp rebound in both reports, and is positive for future activity. The spread between new orders and customer inventories is also growing in the manufacturing series (chart below), which is another leading indicator of activity.
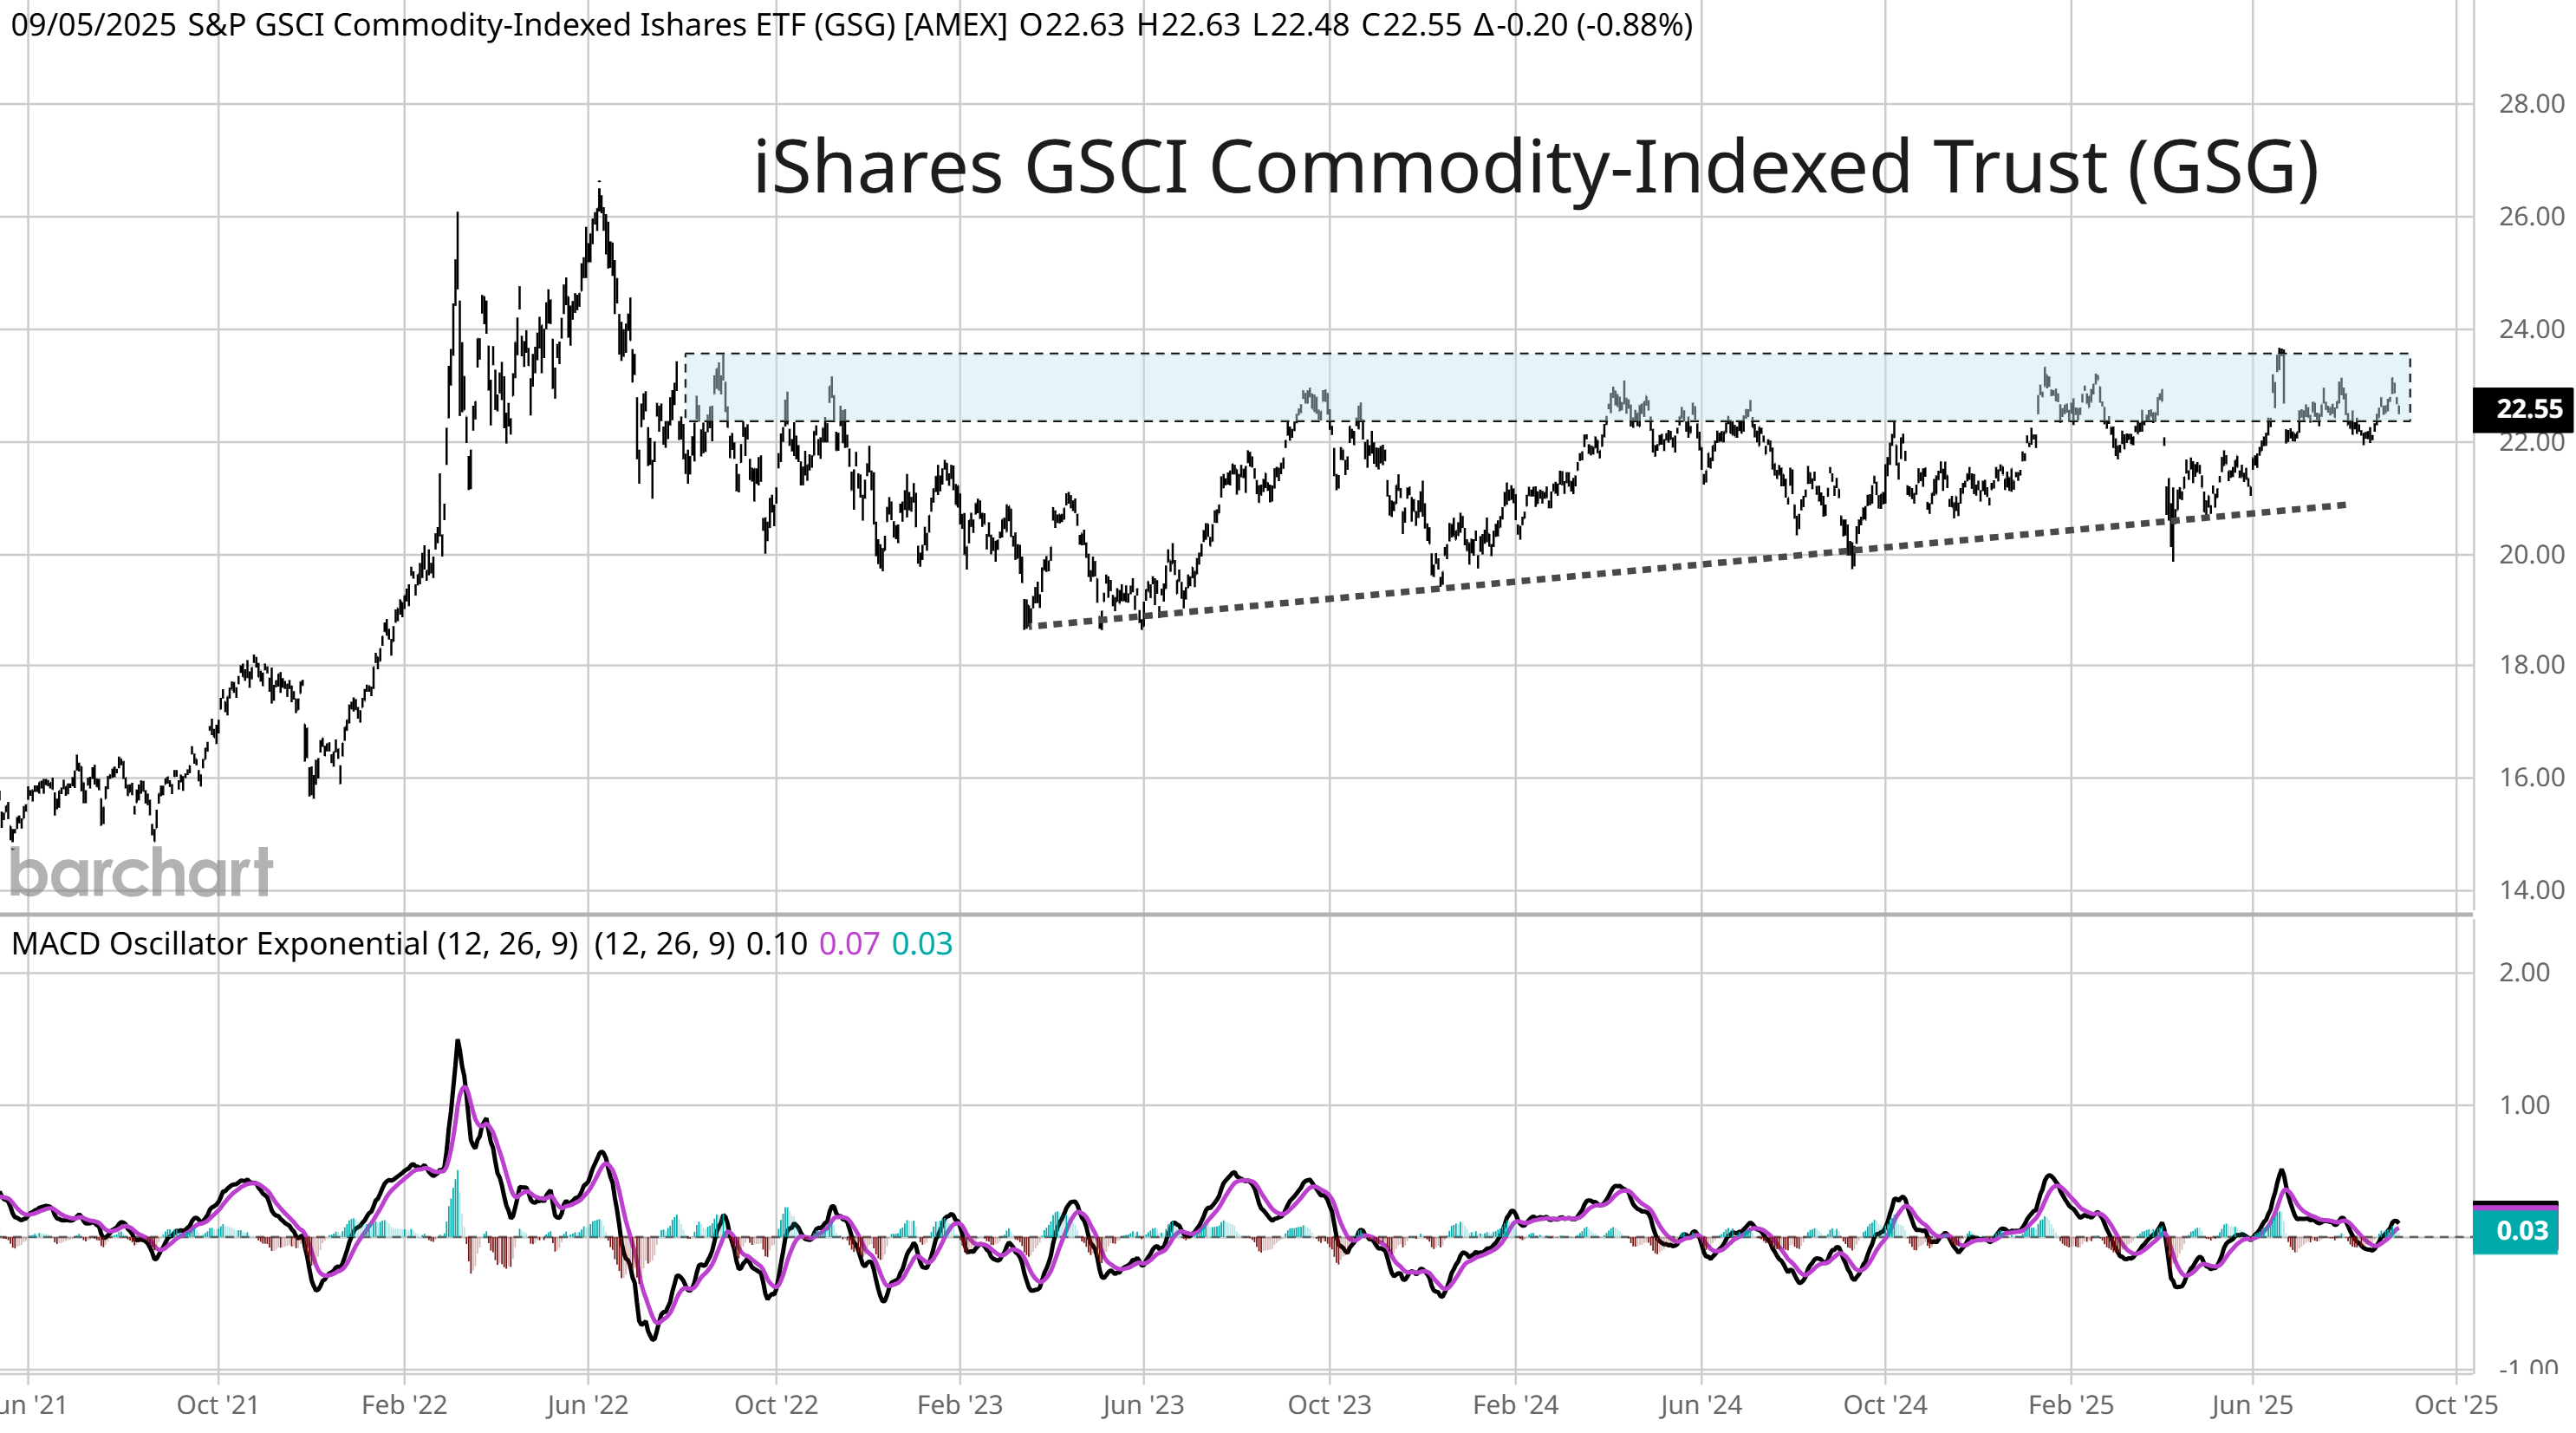
While investor concerns are quickly shifting to the labor market, inflationary pressures continue building. Various core consumer inflation measures are running around the 3.0% level, which is well above the Fed’s inflation target of 2.0%. Assets with high inflation betas are warning about upside surprises, including gold’s breakout to record highs near the $3,600 per ounce level. The next area to watch is with broader commodities that you can track with the iShares S&P GSCI Commodity-Indexed Trust ETF (GSG). GSG is trading near the high end of a multi-year basing pattern. The last big gain in GSG coincided with the last inflation wave that peaked in mid-2022. A breakout in GSG would add further inflationary pressures at a time when the Fed is expected to start slashing interest rates.
Following an initial positive market reaction to the August payrolls report, stocks reversed with the S&P 500 closing lower on the day. While recession fears could become the narrative weighing on the index over the near-term, that would align with a period of seasonal weakness. The chart below plots the four-year presidential cycle for the S&P 500 with data going back to 1928. The blue line shows average movement during the post-election year, which the S&P has tracked fairly close so far this year. That included an initial peak in February followed by a pullback into March and April. Based on the cycle, stocks should peak during late summer followed by a pullback through most of October.
 and another representing the trend if more important than level (based on daily data 11/09/1998 - 11/30/2004). The x-axis shows dates from January to December, and the y-axis shows index values ranging from -10 to 310. The graph is sourced from NDR and includes a watermark from NDR.")
While seasonal trends point to weakness ahead, the longer-term path for the S&P 500 will come down to the economy once the Fed starts cutting rates again. The chart below plots the S&P 500 conditional on the Fed holding interest rates steady for at least six months. Once the Fed starts cutting again, the forward path for the stock market depends significantly on the economy avoiding a recession. The dark bule line shows the S&P over the next 12 months when the economy continues expanding, while the gray line shows the S&P when the economy tips into recession. Over the long run, stock prices ultimately follow earnings which is why the economic outlook is critical.

Heard in the Hub
The Traders Hub features live trade alerts, market update videos, and other educational content for members.
Here’s a quick recap of recent alerts, market updates, and educational posts:
What gold’s breakout says about inflation.
Inflation is tracking a cycle that you don’t want to see.
The binary event behind stocks if the Fed starts cutting rates.
Breaking down the next AI ‘pick and shovel’ play I’m watching.
How I avoid “traps” often seen during the daily trading session.
You can follow everything we’re trading and tracking by becoming a member of the Traders Hub.
By becoming a member, you will unlock all market updates and trade alerts reserved exclusively for members.
🚨Hub members were alerted to the rally in gold mining stocks early on and jumped into Anglogold Ashanti (AU) on 3/18. Hub members are now sitting on a 75% gain. Unlock the special offer below and come join us today:
👉You can click here to join now👈
Trade Idea
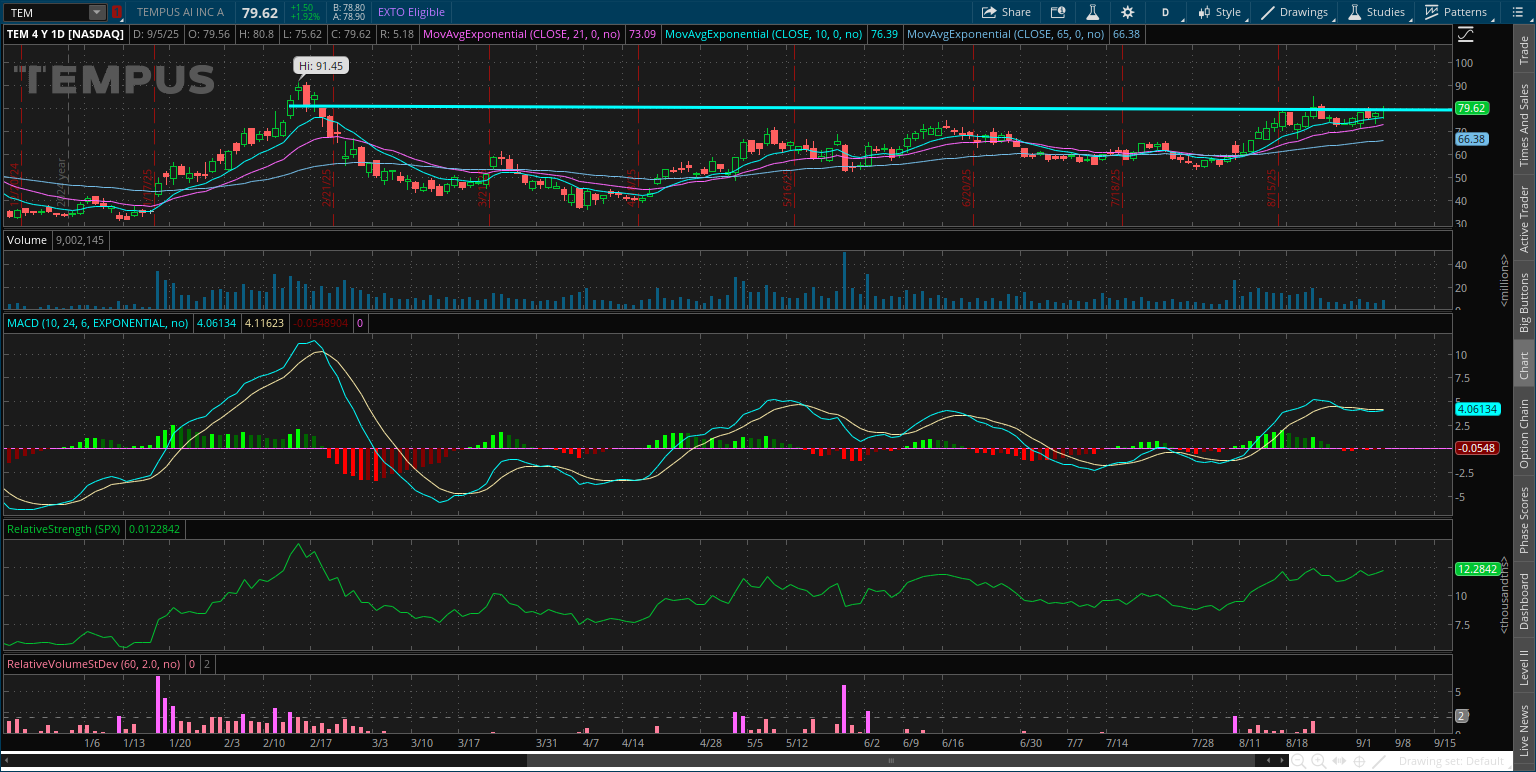
Tempus AI (TEM)
A recent AI healthcare IPO that’s trading in a narrowing range since March. The stock is making a smaller pullback following a test of the $80 level. That’s helping to reset the MACD at zero. I’m watching for a move over $80 followed by new highs.
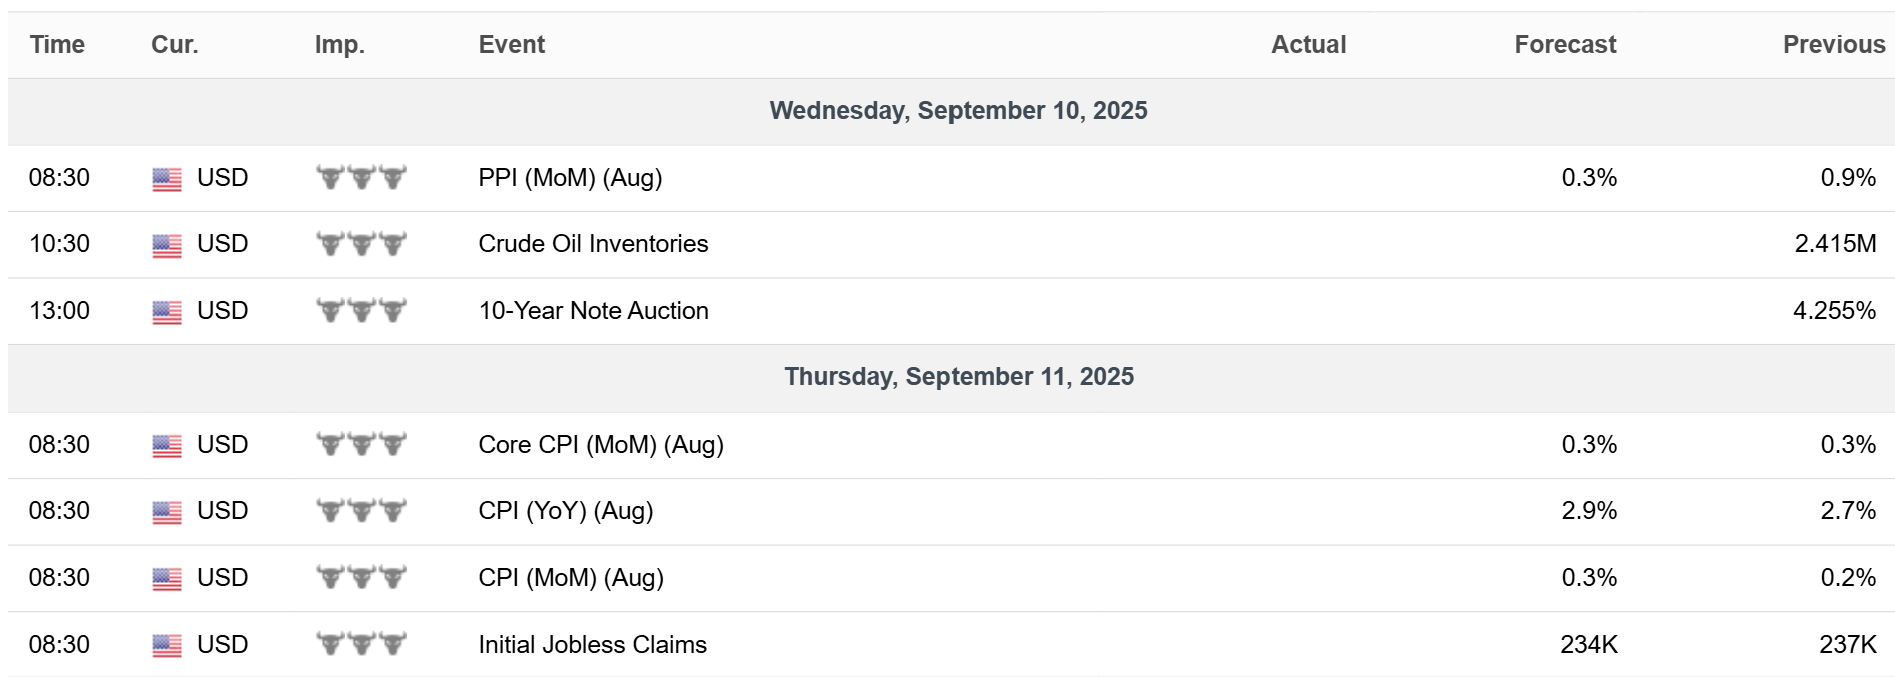
Key Upcoming Data
Economic Reports
Earnings Reports

I hope you’ve enjoyed The Market Mosaic, and please share this report with your family, friends, coworkers…or anyone that would benefit from an objective look at the stock market.
Become a member of the Traders Hub to unlock access to:
✅Model Portfolio
✅Members Only Chat
✅Trade Ideas & Live Alerts
✅Mosaic Vision Market Updates + More
Our model portfolio is built using a “core and explore” approach, including a Stock Trading Portfolio and ETF Investment Portfolio.
Come join us over at the Hub as we seek to capitalize on stocks and ETFs that are breaking out!
And if you have any questions or feedback, feel free to shoot me an email at mosaicassetco@gmail.com
Disclaimer: these are not recommendations and just my thoughts and opinions…do your own due diligence! I may hold a position in the securities mentioned in this report.