The Market Mosaic 9.4.22
Beat bear market blues by combining price and relative strength to find long opportunities.
Welcome back to The Market Mosaic, where I gauge the stock market’s next move by looking at trends, market internals, and the mood of the crowd. I’ll also highlight one or two trade ideas I’m tracking using this information.
If you find this content helpful hit that “like” button, please share this post, and become a subscriber to this always free newsletter if you haven’t already done so!
Also, be sure to check out Mosaic Chart Alerts. It’s a midweek update covering my best chart setups among long and short ideas in the stock market, along with specific levels that would trigger a trade.
Now for this week’s issue…
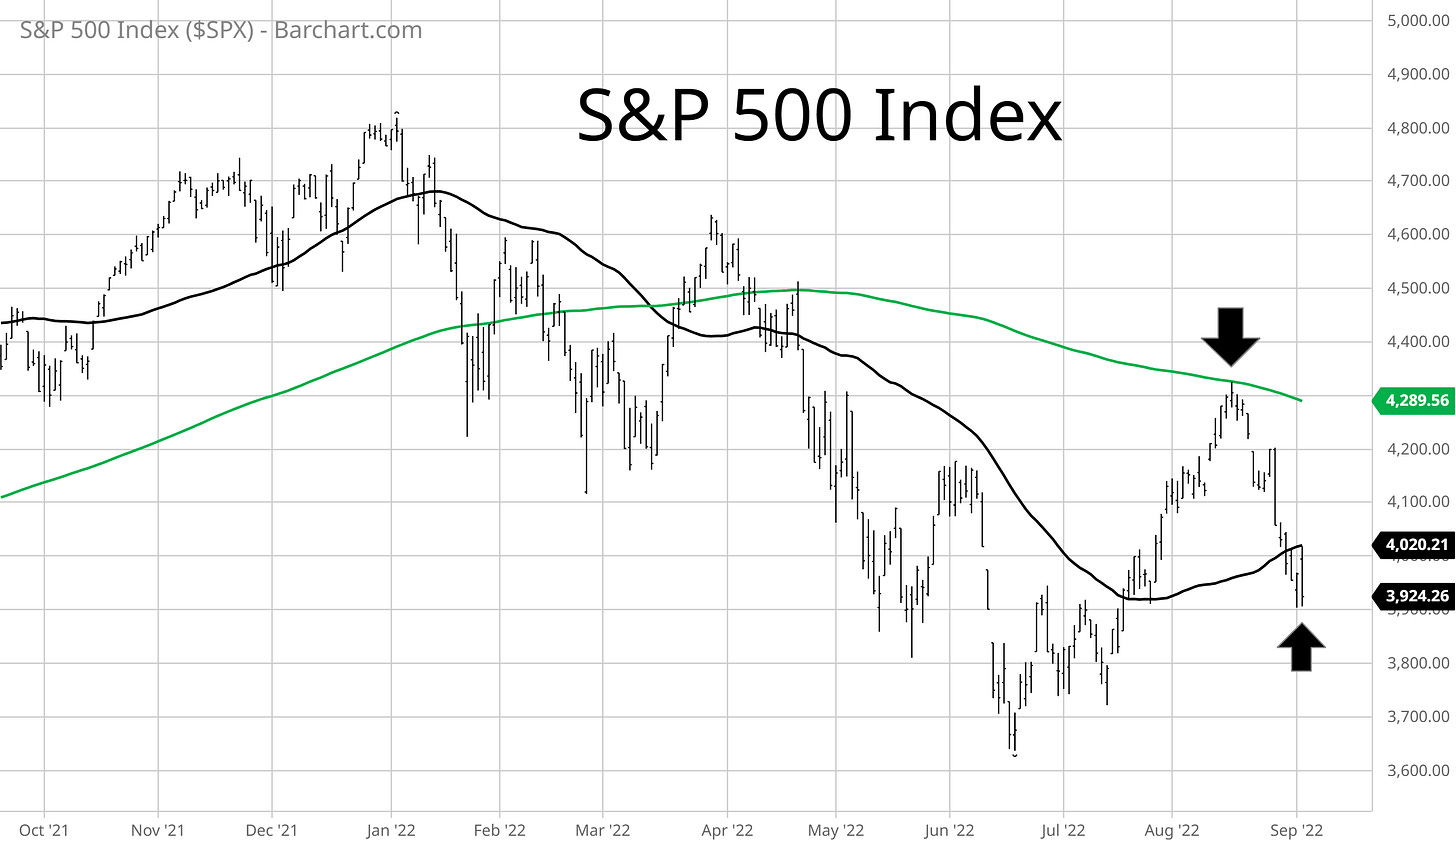
The losing streak continues. The stock market logged its third straight weekly decline, with the S&P 500 falling another 3.3% last week. That brings the total decline to over 9% since the S&P touched the 200-day moving average back in August.
The problem for stocks last week is that economic news was mostly okay. Like with the August payrolls report released on Friday that showed the addition of 315,000 jobs, or the ISM report that showed manufacturing activity is still expanding at a modest pace.
And good news for the economy is bad news for investors.
Recall that Fed Chair Powell commented at Jackson Hole that “…the current high inflation in the United States is the product of strong demand and constrained supply, and that the Fed's tools work principally on aggregate demand.” That means the Fed knows it needs to execute a more meaningful deceleration in economic activity (i.e. aggregate demand) to get inflation under control.
That gives the Federal Reserve the green light to keep tightening policy by raising interest rates and shrinking their $8.8 trillion balance sheet, which has only just begun as you can see below. The ongoing drain in liquidity from the financial markets is a major reason why I believe we remain stuck in a bear market.
Despite the recent pullback, I’m still eyeing opportunities to add long exposure in my portfolio, and a great tactical window could be upon us. Here’s why I’m getting ready to throw my line in the water, and this is where I’m doing most of my fishing.
Where to Fish
Last week, I discussed the various signals flashing red and green lights for the stock market. The warning signals are more strategic and longer-term, such as the message being delivered by the fixed income markets.
The green lights are shorter-term and more tactical, including signs of oversold conditions. And with last week’s weakness in the stock market, those signals have only strengthened. I’m watching several breadth indicators to monitor a near-term washout in stock prices. That includes a measure called the McClellan Oscillator, which tracks a moving average of the difference between advancing and declining stocks. This metric is the most oversold since 2020’s bear market:
I also want to update you on the percent of stocks trading above their 20-day moving average, which now stands at just 14%. You can see in the chart below that this indicator has sunk to levels that have marked past short-term bottoms in the market.
Given the developing potential to see a short-term bounce, I wanted to highlight another aspect of my personal trading strategy and where I see the best opportunities developing.
Dual Breakout: Relative Strength + New Highs
In past issues, I’ve discussed my personal view on the phases in stock prices and how I trade opportunities that are moving to a trending period. As part of that transition, stocks that grab my attention are those demonstrating relative strength and on the verge of breaking out to new 52-week highs. I can’t think of anything more bullish in terms of price action, especially amidst a bear market.
That’s because the laws of supply and demand applies to stock prices. Relative strength is just another way to visualize and measure demand for a particular stock compared to the broader market. And by targeting stocks moving out to new 52-week highs, that helps ensure that overhead supply is less of an obstacle on a potential breakout.
I’ve been highlighting the action in DINO lately, and also used it as an example here to highlight price phases in action. So lets also use it to illustrate how I use a dual breakout in relative strength and price to enter trades. The daily chart below shows DINO along with relative strength in the bottom panel (compared to the S&P 500) for the past two years.
Using my criteria, the first opportunity to trade DINO long was at point 1 where both and relative strength broke out to 52-week highs. As I’ve been highlighting in recent issues of Mosaic Chart Alerts, I’m watching for another trading opportunity at point 2 around the $57 level for the next breakout signal.
Stocks across the energy and commodity space show a similar setup with price and relative strength, which is why those names are dominating my focus list.
Now What…
I’ve been flagging key levels in the S&P 500 that I wanted to hold, including the 50-day moving average and price support at 4,000. We sliced right through those levels last week (see the S&P 500 chart above), which certainly isn’t ideal.
One thing I want to highlight is how my trading strategy keeps my portfolio cash-heavy when market conditions are challenging. As I’ve shown you here and in Mosaic Chart Alerts, I only take long positions on a breakout and not on the anticipation of one. Should bearish price action prevail, I wouldn’t expect many long setups to trigger.
So where is my conviction level now? I don’t like the action in the major indexes, but the setups in the energy and commodity space have my attention. Add uranium stocks to that list with LEU. I’m watching for a move over the $50 level that could take the stock back to the prior highs.
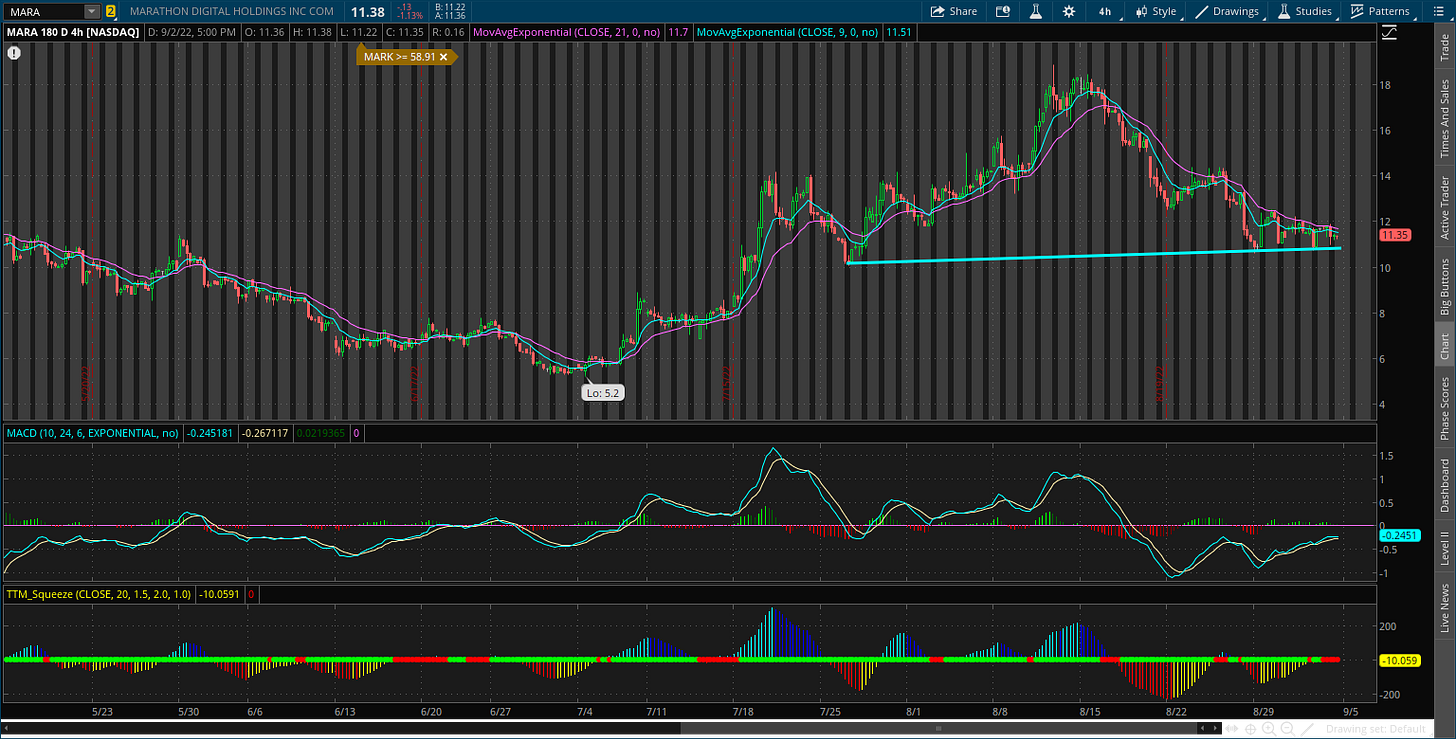
I’ve focused on long setups here but many of our short ideas are playing out as well, like with the pattern breaks we’ve seen with WDC and WU. I’ve also discussed crypto as a sentiment indicator for equities, and should Bitcoin continue to breakdown then I would watch the pattern in MARA. There is a head and shoulders developing on the four-hour chart, where I’m looking for a close under $11 for confirmation.
That’s all for this week. I’m navigating this tough market environment by staying patient and disciplined with my process, and taking only the setups that meet my criteria and breakout levels. So while there are a lot of great setups developing, stay focused on the ideas offering a dual breakout in price and relative strength!
I hope you’ve enjoyed this edition of The Market Mosaic, and please share this newsletter with anyone you feel could benefit from an objective look at the stock market.
Make sure you never miss an edition by subscribing here.
For updated charts, market analysis, and other trade ideas, give me a follow on twitter: @mosaicassetco
And if you have any questions or feedback, feel free to shoot me an email at mosaicassetco@gmail.com
Disclaimer: these are not recommendations and just my thoughts and opinions…do your own due diligence! I may hold a position in the securities mentioned in this newsletter.


