The Market Mosaic 9.3.23
S&P 500: New highs incoming...
Welcome back to The Market Mosaic, where I gauge the stock market’s next move by looking at macro, technicals, and market internals. I’ll also highlight trade ideas using this analysis.
If you find this content helpful please hit that “like” button, share this post, and become a subscriber to this always free report if you haven’t already done so!
And be sure to check out Mosaic Chart Alerts. It’s a midweek update covering chart setups among long and short trade ideas in the stock market, along with levels I’m watching.
Now for this week’s issue…
On the surface, the payrolls report for August looked pretty good. There were 187,000 jobs created during the month, which surpassed economist expectations of 170,000.
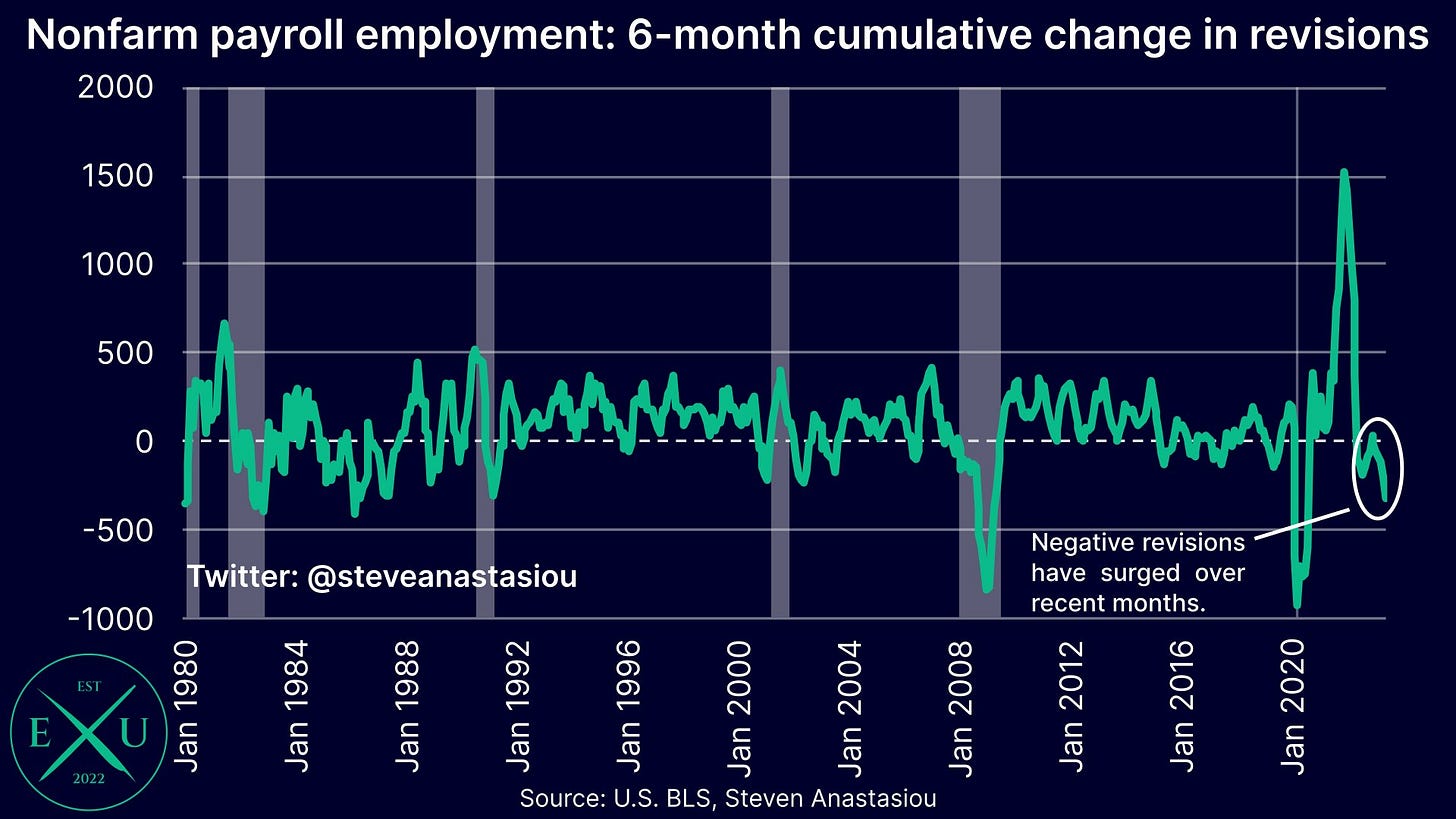
But that’s about where the good news ends. The unemployment rate jumped higher unexpectedly, while prior months’ job gains were revised lower by 110,000 with the pace of negative revisions picking up as you can see below (h/t to Steven Anastasiou for the chart).
Evidence of a softening labor market was also reflected in another jobs report. The number of available jobs fell for the third consecutive month, and dropped to the lowest level since March of 2021. Meanwhile, the quit rate fell to the lowest level since 2021 as well, suggesting that job seekers may be having a harder time finding employment.
The softening labor market data is reigniting the debate around the Federal Reserve’s rate hikes, and if the fastest tightening campaign in history is finally catching up to economic data.
But before you get too caught up in the data, remember that the most popular economic reports are trailing indicators of activity…like the payrolls report (and inflation).
Stocks are forward looking and discount conditions in the future. And within the market, the action in cyclical sectors as well as the performance of the average stock can send important clues about the economic outlook and where things are heading.
Despite the attention lobbied at the past week’s job figures, I’m focusing on several encouraging signs coming from the stock market.
In fact, I believe the message coming from the market indicates that new highs could be just around the corner, reflecting a very different message about the economy that lies ahead.
New Highs for the S&P 500 Incoming
The stock market is widely acknowledged as a discounting mechanism for future business conditions, and reflects the corporate earnings outlook.
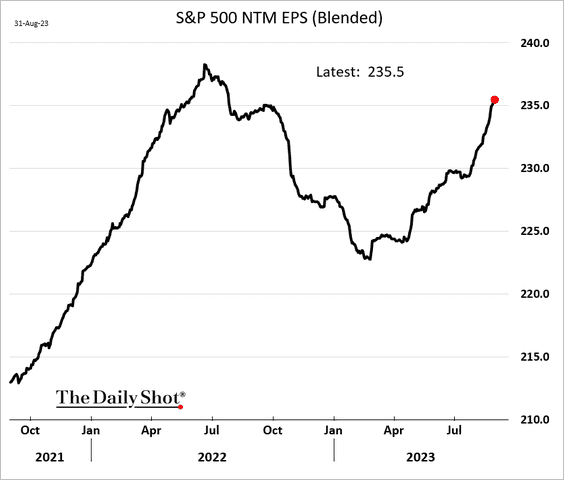
And those earnings projections are seeing a sharp recovery since the first quarter of this year.
Forget what you may have heard about second quarter earnings dropping by 4% compared to last year, or that it was the third consecutive quarter of year-over-year declines.
That news was already reflected by the S&P 500’s bear market last year. What matters now is what lies ahead.
You can see in the chart below that forward earnings estimates for the S&P 500 are on the cusp of making a new high. Analyst estimates will reflect the outlook provided by corporate management teams…and I can’t imagine anyone better placed to forecast what’s ahead.
I anticipate that new highs for both forward earnings and the S&P 500 are in store, and that comes down to the message coming from the stock market’s leading indicators.
After taking a pause since late July, key cyclical sectors that are sensitive to business conditions are turning up and nearing breakouts to new highs.
That includes the semiconductor industry, which has led the stock market all year. While Nvidia’s exposure to artificial intelligence (AI) gets a lot of the attention, electronic content is permeating the things we use in our daily lives.
So the performance of the chip sector delivers important clues on the economic outlook, and look at what’s happening in the SMH semiconductor ETF below. After marginally surpassing the prior highs around $155, SMH is pulling back since late July.
But that pullback reset the MACD, with recent price action retaking the 50-day moving average (MA – black line). If SMH can breakout to new highs, that’s sending an important message about the market and economic outlook.
The same can be said for the housing market. The residential housing market is a $43 trillion industry that has a far reaching impact on various industries. While the housing market is much maligned this year with the jump in mortgage rates, it’s hard to argue that good times aren’t ahead with the performance of the ITB housing construction ETF.
You can see in the chart below that after breaking out to new all time highs, the ITB housing construction ETF is recently back testing the breakout level which is now support. A bounce is underway off that level, with ITB trading just below the high. A struggling housing market would spell bad news for the broader economy, but it’s hard to make that conclusion with housing-linked stocks on the brink of new highs.
That means two economically-sensitive sectors are still demonstrating relative strength and I believe could lead the S&P 500 to new all-time highs if they follow through on breaking out. But the positive signs don’t end there.
Now What…
I’m not cherry-picking chip and housing stocks to support a bullish view on the economy and stock market. Other cyclical sectors are holding up as well. Just last week I discussed the setups across the energy and commodity space.
I highlighted the setup in the IXC global energy ETF along with refining stocks and commodities in general. And just over the past week, all three are breaking above the key levels that I discussed in my last report. You can see that below with IXC moving over the $40 level to new all time highs.
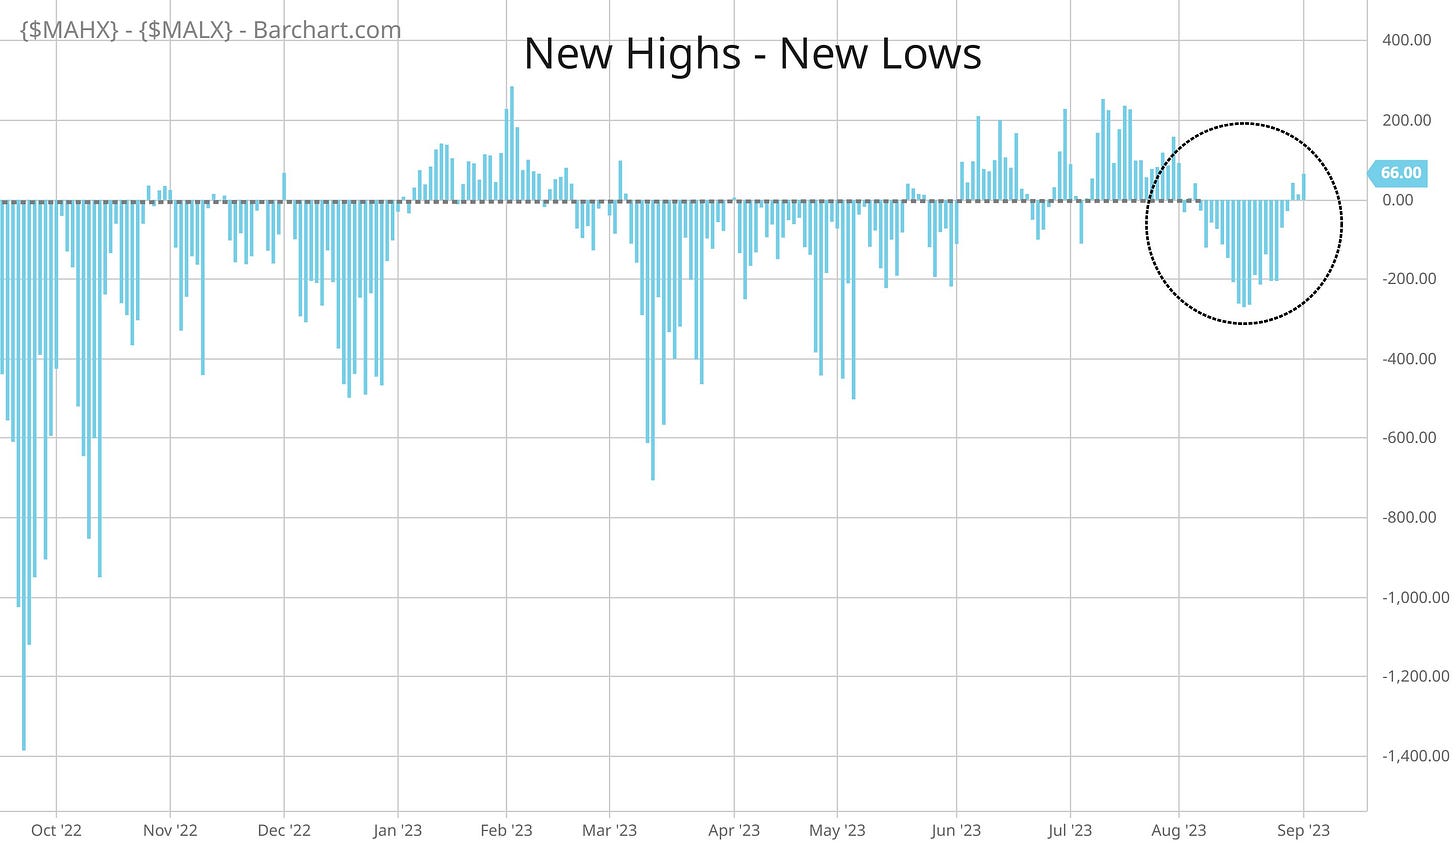
The average stock continues doing better as well. Following a modest expansion in net new 52-week lows on the pullback since July, the stock market shifted back to net new highs last week as you can see below.
And I would also point out that the McClellan Summation Index just fired off a new buy signal. I highlighted here how I utilize this indicator, and that it’s usually the last near-term breadth metric to generate a positive signal. But that signal is important confirmation of the improvement in other breadth metrics seen over the past week.
With the ETFs and setups covered above, it shouldn’t come as a surprise that I’m targeting new breakouts in those sectors for new long trades. The setup in BKR is a great example, where many stocks in the energy sector are breaking from consolidations after testing their highs from last year. I will have plenty more setups this week in Mosaic Chart Alerts.
That’s all for this week. This coming week will be fairly light on the economic calendar, and is a holiday-shortened week for trading (Happy Labor Day!). I will be paying close attention to follow through with performance of the average stock, while also keeping in mind the next couple weeks are favorable for S&P 500 seasonality as well.
I hope you’ve enjoyed The Market Mosaic, and please share this report with your family, friends, coworkers…or anyone that would benefit from an objective look at the stock market.
And make sure you never miss an edition by subscribing here:
For updated charts, market analysis, and other trade ideas, give me a follow on Twitter: @mosaicassetco
And if you have any questions or feedback, feel free to shoot me an email at mosaicassetco@gmail.com
Disclaimer: these are not recommendations and just my thoughts and opinions…do your own due diligence! I may hold a position in the securities mentioned in this report.


Great stuff! Thanks for your work