The Market Mosaic 9.25.22
The stock market is on the brink of new lows. Three indicators that will signal an end to the bear market.
Welcome back to The Market Mosaic, where I gauge the stock market’s next move by looking at trends, market internals, and the mood of the crowd. I’ll also highlight one or two trade ideas using this information.
If you find this content helpful please hit that “like” button, share this post, and become a subscriber to this always free newsletter if you haven’t already done so!
Also, be sure to check out Mosaic Chart Alerts. It’s a midweek update covering my best chart setups among long and short ideas in the stock market, along with specific levels that would trigger a trade.
Now for this week’s issue…
A double dose of bad news was delivered to the stock market this week.
First, the Federal Reserve clearly took note of the most recent consumer inflation report that showed rising core prices becoming more entrenched. So in their latest meeting, the rate-setting FOMC delivered a 0.75% increase in short-term rates as expected and also laid the foundation for more outsized rate hikes.
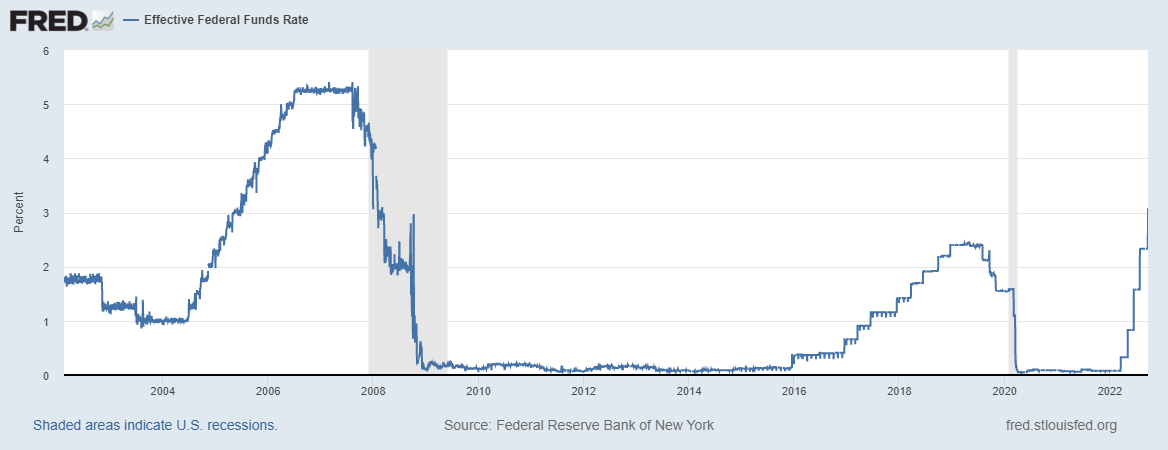
The chart below of the federal funds rate shows how big and quickly the Fed has moved in this tightening cycle relative to the past. And based on the “dot plot”, which are projections by the Fed’s own members, expect another rate hike of 0.75% before year-end.
During his press conference Fed Chairman Jerome Powell also acknowledged that the fight against inflation will inflict some pain, which goes against the prior messaging of a soft landing.
And that fits squarely with another economic report that I covered last week, and that is with the Conference Board’s Leading Economic Index (LEI). The most recent release came out Thursday, which showed a worse than expected decline and officially triggered a recession signal on the six-month rate of change.
Recall that a negative and falling LEI has historically translated to plunging stock prices. So a combination of a Federal Reserve that is only becoming more aggressive on rate hikes, along with economic indicators pointing to a sharp deceleration in activity…
It’s no wonder why stocks have continued to lose ground, with the S&P 500 falling another 4.6% this past week that tested 2022’s lows. But as new lows in this bear market seem likely, it’s time to highlight how you can use investor panic to spot the bottom.
How to Spot Panic Selling
During the last major leg lower into mid-June, there was a lot of talk around capitulation and if stocks had truly seen the bottom. My opinion at that time was that the bottom was not reached due to a lack of panic signals.
So this week, I want to review three signs of capitulation to signal the type of panic selling that accompanies the bottom.
#1 Volatility Index
Get ready to hear a lot of talk about the volatility index (VIX) if this selloff picks up. I’ve been tracking an interesting pattern over the last couple of weeks, where the VIX couldn’t get above the 28 level even as stocks sold off. But now it’s finally starting to breakout, so watch for a true spike higher.
Recall that VIX is just the implied volatility in S&P 500 options, and a spike in the VIX is typically a sign that investors are panic-buying protection via put options. I’ve included a chart of the VIX below going back three years. The last several bear markets were ended with a VIX over 40, which is my capitulation trigger. And we have yet to move over that level in this bear market.
#2 High Yield Spreads
I know…I discuss high yield spreads often but that’s because of the information embedded in the level and direction of spreads. I also use this metric to spot panic among the fixed income crowd. It’s also a sign that investors are becoming seriously concerned about financial distress in the economy, which can mark a turning point in Fed policy to a move dovish stance.
Here’s a chart of spreads going back to the late 1990s. You can see that we’re still well below levels seen during past major bottoms like in 2002, 2009, and 2020. I would like to see spreads above 7.5% to signal capitulation.
#3 Put/Call Ratio
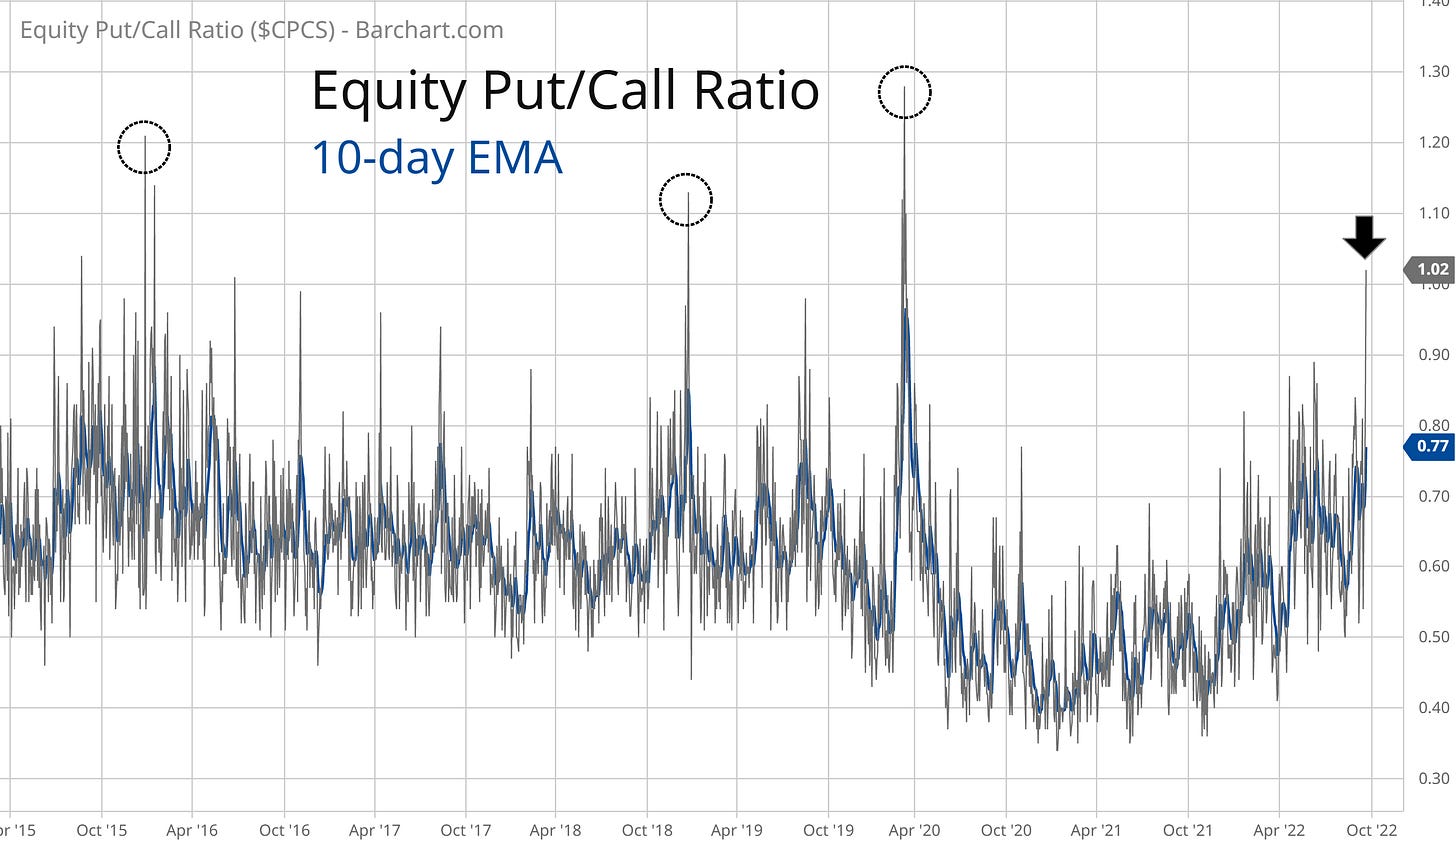
If you’ve been on Twitter this weekend, you have surely heard about the put/call ratio. This is another way to track bearishness among investors, with a spike in in put volume relative to calls signaling panic.
The ratio crossed above 1.0 this past week, which is now becoming elevated. The chart below shows the ratio going back to 2015. While prior sell-offs were accompanied by an even higher ratio as I’ve circled in the chart, this developing spike has my attention.
Now What…
Of the capitulation indicators reviewed in this newsletter, put/call ratios are the only metric showing any signs of panic (and even then, it’s not a very strong sign relative to past bottoms).
That’s why I continue to carry a heavy cash position and size less aggressively when taking a trade. I noted in last week’s update that I was already carrying a large cash allocation due to a lack of follow through with my watchlist of setups, and that certainly remains the case now.
The only patterns that have completed this past week have been on the short side. That includes several ideas that I’ve highlighted in Mosaic Chart Alerts, including recent addition M along with UAL (shown below) and CCL. That follows other recent successes on the short side with WDC and WU. It really says something about this market environment when our best trades recently have come from downside plays.
I’m showing the four-hour chart of another airline with HA below, which is a good example of my prime short trade setup. The combination of a failed support level (the bottom trendline break) just when the MACD has a negative reset at the zero line are important components of my strategy to profit from falling stock prices.
There really isn’t anything worth noting from my watchlist of long setups. With the carnage in the energy sector on Friday, many patterns that I’ve been tracking are now invalidated. But that again highlights how breakout trading helps keep me out of difficult markets. If a setup doesn’t trigger, I’m left sitting in cash.
I hope you’ve enjoyed this edition of The Market Mosaic, and please share this newsletter with anyone you feel could benefit from an objective look at the stock market.
And make sure you never miss an edition by subscribing here:
For updated charts, market analysis, and other trade ideas, give me a follow on twitter: @mosaicassetco
And if you have any questions or feedback, feel free to shoot me an email at mosaicassetco@gmail.com
Disclaimer: these are not recommendations and just my thoughts and opinions…do your own due diligence! I may hold a position in the securities mentioned in this newsletter.


Would you mind going into detail a bit more about VIX?
As someone that loves to research markets, I am often skeptical of arguments such as: traders are witnessing the signal and they are now putting or calling options. Who are those sellers? Do actually so many individuals that trade stocks regularly read about the markets that they make such quick decisions? Or is it the power of the investment funds that witness economic news and immediatelly sell or buy, thus they are the ones making the market a bear or a bull?
Still at the beginning, so excuse me if it all doesn’t make sense!
Thank you!