The Market Mosaic 9.22.24
S&P 500: The Fed’s unleashing the next bull market phase.
Welcome back to The Market Mosaic, where I gauge the stock market’s next move by looking at macro, technicals, and market internals. I’ll also highlight trade ideas using this analysis.
If you find this content helpful please hit that “like” button, share this post, and become a subscriber if you haven’t already done so!
And be sure to check out Mosaic Chart Alerts. It’s a midweek update covering chart setups among long and short trade ideas in the stock market, along with levels I’m watching.
Now for this week’s issue…
When the Federal Reserve concluded their September meeting last week, the central bank caught almost everyone by surprise.
While the Fed was widely expected to cut interest rates for the first time in four years, a poll by Reuters found that 92 out of 101 economists were expecting a 0.25% reduction.
Instead, the Fed cut by 0.50% which hasn’t happened since the economy was in freefall during the pandemic. Progress on inflation is enabling a larger cut as various measures of price pressures are falling far below the fed funds rate (chart below).
Fed Chair Jerome Powell made it clear that the Fed is focused on not repeating policy errors from the past when it left rates too high for too long. Powell even stated that the larger cut could be taken “as a sign of our commitment not to get behind.”
Other Fed officials are also shifting their focus away from fighting inflation and toward boosting the labor market. The chart below plots how many Fed officials see risks to unemployment versus rising core inflation.
Even though core inflation as measured by the Consumer Price Index (CPI) is still running at 3.2% year-over-year in the most recent report for August, the concern is now achieving a soft landing for the economy.
But based on precedent from a previous easing cycle, the current backdrop can help usher in the next phase of the bull market as the Fed pivots toward rate cuts. Here are the conditions that can keep the stock market rally going as the Fed cuts rates.
Party Like It’s 1995
"As a result of the monetary tightening initiated in early XXXX, inflationary pressures have receded enough to accommodate a modest adjustment in monetary conditions.”
You might think that’s a quote from Powell following the Fed’s meeting last week. But the XXXX is actually 1994, and that quote was from Alan Greenspan in 1995.
And like the rally in the S&P 500 following rate cuts in 1995, a similar set of circumstances can help propel the stock market following the latest rate cut.
One catalyst simply comes down to the earnings picture. A Fed that’s cutting interest rates should be stimulative for the economy and help boost corporate earnings.
Earnings for the S&P 500 have recovered from the drawdown in 2022 following rate hikes, with forward estimates picking up into the end of 2025. Based on current estimates, analysts see S&P 500 earnings growing by another 18% into the end of next year (chart below).
The earnings outlook is also receiving confirmation from the action in cyclical stock market sectors. In recent reports, I’ve commented on the setups with charts in housing market stocks.
Several homebuilders are breaking out from new basing patterns, including bullish pennant patterns. That’s keeping their uptrend intact, while the chart setups in home goods retailers like Home Depot (HD) and Lowe’s (LOW) are providing additional cyclical confirmation.
You can add small-cap stocks to the sectors showing constructive action as well. The chart below shows the IWM exchange-traded fund (ETF) that tracks the Russell 2000 Index of small-cap stocks.
Small-caps have good reason to rally. Approximately 33% of small-cap companies have floating rate debt on their balance sheet compared to 6% of companies in the S&P 500. But that breakout wouldn’t happen if the earnings outlook from smalls weren’t constructive.
Finally, the Fed is cutting interest rates despite financial conditions already being loose. Financial conditions reflects the availability and cost of credit. When credit is cheap and plentiful, that tends to be a tailwind for economic activity (and hence earnings).
The Fed’s Chicago district keeps an index of financial conditions that takes into account money market, debt, and equity market indicators. Similar to 1995, the Fed is cutting interest rates with financial conditions already looser than average as you can see in the chart below.
Also note in the chart that financial conditions were tighter than average heading into or during each of the past seven recessions. Interest rates are part of determining financial conditions, where rate cuts should help keep conditions looser than average.
The Fed opted for an outsized rate cut as progress on inflation collided with evidence that the labor market is starting to soften when you look at recent payrolls reports. But given signs that the economy is holding up just fine, similar circumstances are emerging compared to the stock market rally that unfolded after the Fed started cutting rates in 1995.
Now What…
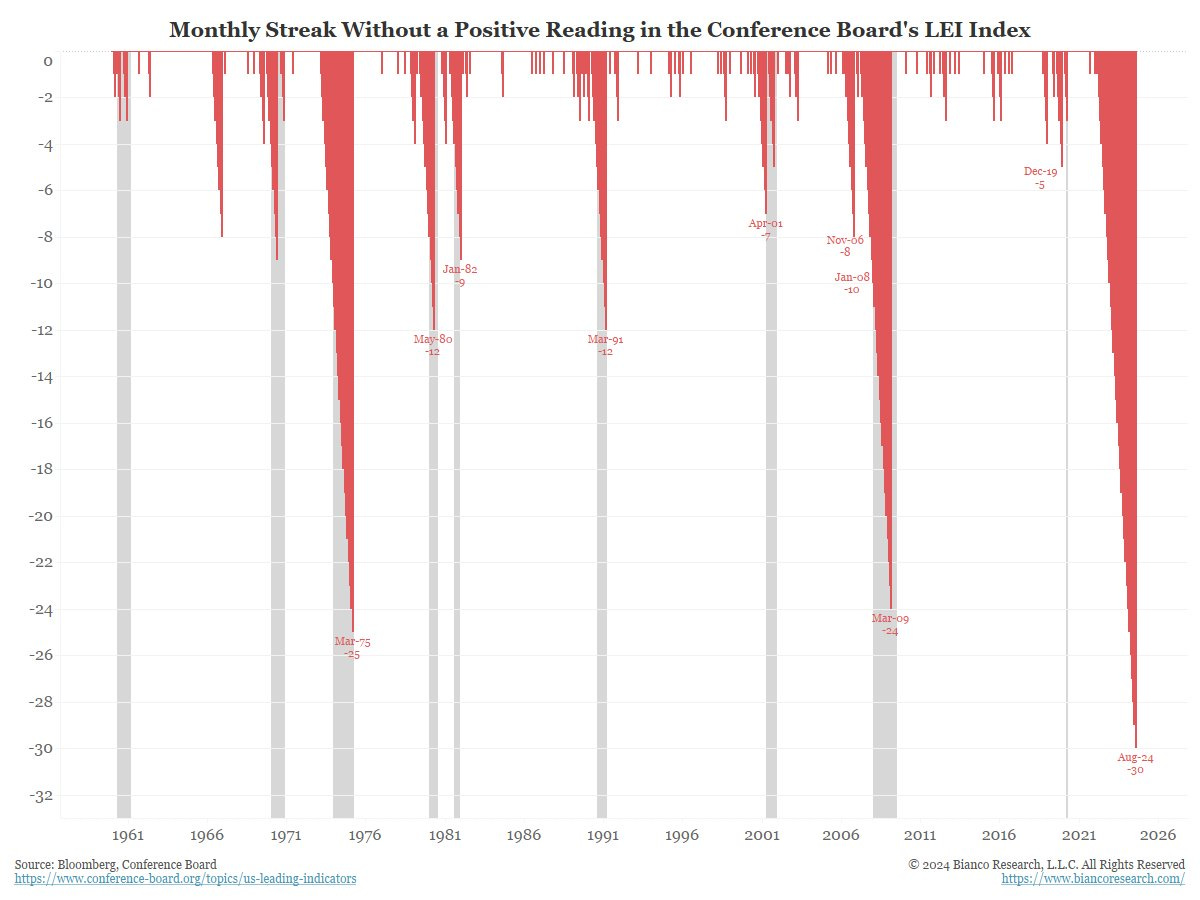
Conflicting reports on the health of the economy are confusing investors and economists. Last week, the Conference Board’s Leading Economic Index (LEI) registered another negative reading and has gone 30 consecutive months without a positive figure. That’s the longest negative streak as you can see in the chart below.

But other incoming data does not support the view that a recession is imminent. Initial jobless claims remain near historic lows, while retail sales gained 2.1% year-over-year in August following a 2.9% gain in July.
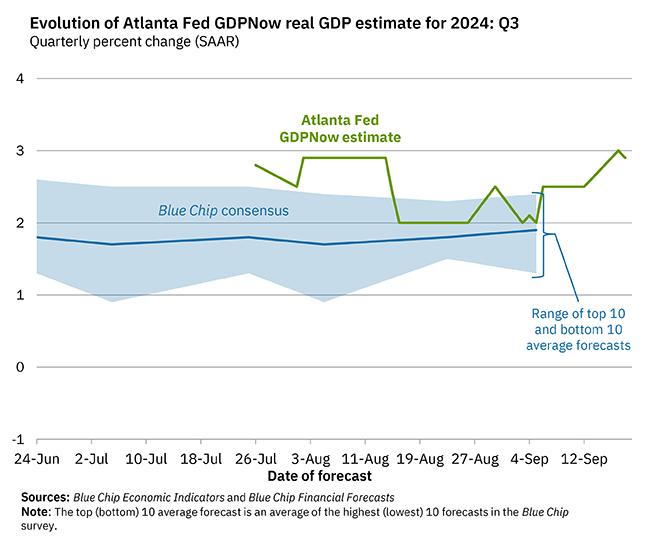
The Fed’s Atlanta district keeps an updated estimate on current quarter gross domestic product (GDP). In response to things like strong consumer spending, their GDPNow estimate currently stands at 2.9% and is well above consensus estimates as you can see below.
Fed rate cuts when the S&P 500 is near all-time highs also has a track record of positive forward returns. The table below looks at when the Fed has cut rates with the S&P 500 within 2% of the all-time highs.
Across 20 prior instances, the S&P 500 is higher every time 12 months later with an average gain of 13.9%.

And another chart development can help boost risk-on sentiment if a key level gives way, which is with the U.S. Dollar Index (DXY). The dollar index is testing a key support level at 100. A recent rally off that level is resetting the MACD from below zero while the RSI in the bottom panel encountered resistance at 50. Those are bearish momentum resets.
A turn lower and break below 100 would be another catalyst for corporate earnings (since profits earned abroad are worth more in dollar terms) and for commodities like gold and silver as well.
If the economy is on track and consumer spending is strong, then I’m watching the setup in Royal Caribbean Group (RCL). After peaking around the $170 level in July, the stock has tested that level while making smaller pullbacks. The relative strength line is holding near the high while the stock is turning higher following a MACD reset above zero. The stock is now starting to move over the $170 level.
That’s all for this week. The coming week features a slew of Fed speakers, who will be under the spotlight following the recent rate cut. We’ll also get an updated look at the Fed’s preferred inflation gauge with PCE data. But I’ll be watching the action in cyclical sectors for signs that the economic outlook remains bright.
I hope you’ve enjoyed The Market Mosaic, and please share this report with your family, friends, coworkers…or anyone that would benefit from an objective look at the stock market.
And make sure you never miss an edition by subscribing here:
For updated charts, market analysis, and other trade ideas, give me a follow on X: @mosaicassetco
And if you have any questions or feedback, feel free to shoot me an email at mosaicassetco@gmail.com
Disclaimer: these are not recommendations and just my thoughts and opinions…do your own due diligence! I may hold a position in the securities mentioned in this report.


Thanks! Can you comment semiconductor's group weakness, which are cyclicals too?
Commodities are rallying, XLU, XLV RALLY. How can the outlook be +ve ?