

👋Welcome back to The Market Mosaic, where I gauge the stock market’s next move by looking at macro, technicals, and market internals. I’ll also highlight trade ideas using this analysis.
If you find this report helpful please hit that “like” button, share this post, and become a subscriber if you haven’t already done so!
🚨And be sure to check out Mosaic Traders Hub. It’s a members-only platform to alert trade ideas, track a model portfolio of open positions, and further analyze the message coming from the capital markets.
Now for this week’s issue…
For the first time in over three years, the Federal Reserve hiked interest rates by a quarter point with the fed funds target now in a range of 3.75%-4.0%.
Following the meeting, Fed Chair Kevin Warsh indirectly signaled there could be additional increases ahead. Warsh acknowledged that economic and labor market activity aren’t cause for concern while the meeting statement reiterated that the Fed will “deliver price stability”.
Warsh also described the action as removing “a dose of accommodation”, which implies that the central bank still sees the current stance of monetary policy as being stimulative to the economy rather than being restrictive.
If the Fed views policy as being accommodative, then recent data supports additional hikes ahead. The August payrolls report blew past expectations with 162,000 jobs created during the month while initial jobless claims trend near historically low levels.
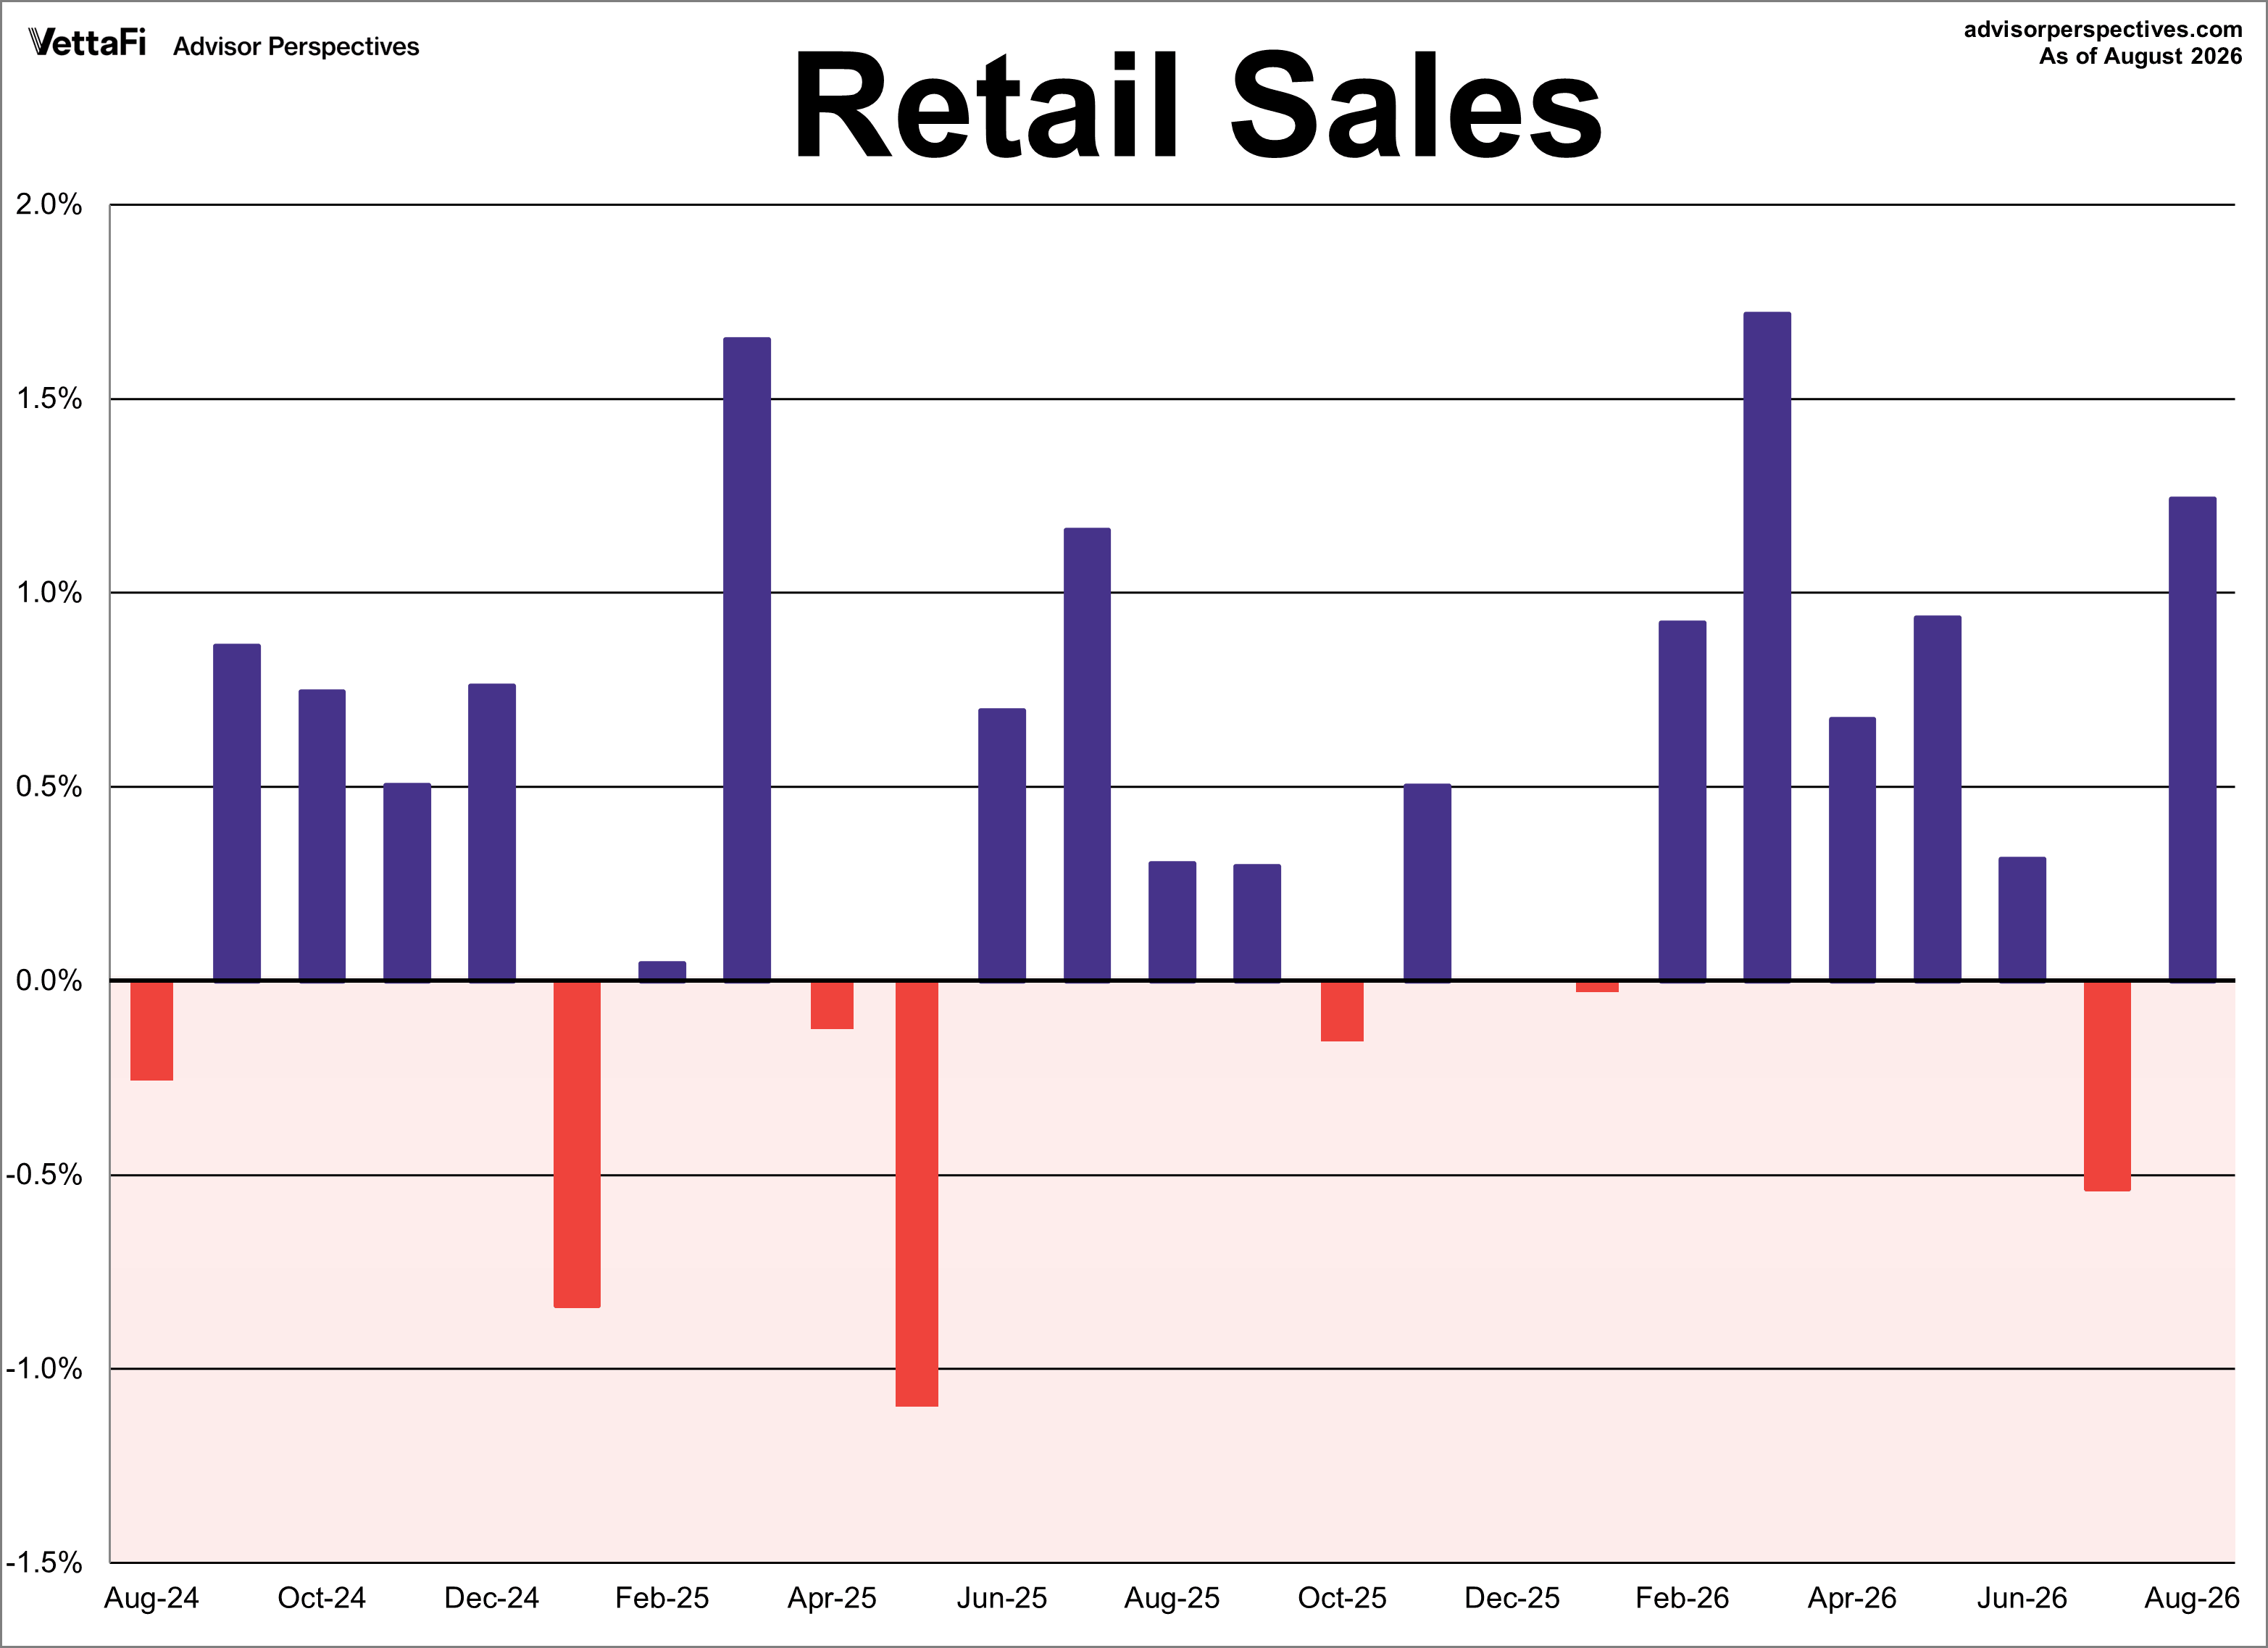
The August report on retail sales increased by 1.2% month-over-month, which was the strongest report in five months (chart below). Evidence of a strong consumer is boosting current quarter estimates of GDP growth.
While the Fed turned more hawkish as investors feared heading into the meeting, major indexes posted strong gains during the following trading session. Measures of stock market breadth were nearing extremely oversold levels which is supportive of a bounce.
The rebound in equities could also reflect the measured pace of rate hikes being priced in. A slow tightening cycle that doesn’t derail recent strong economic activity supports the earnings outlook and thus the bull market.
This week, let’s look at why Fed rates hikes aren’t over and how evidence of a strong economy could present another challenge for the central bank. We’ll also look at the key variable that matters for the economy and stock market, and why breadth is signaling an oversold bounce could develop.
The Chart Report
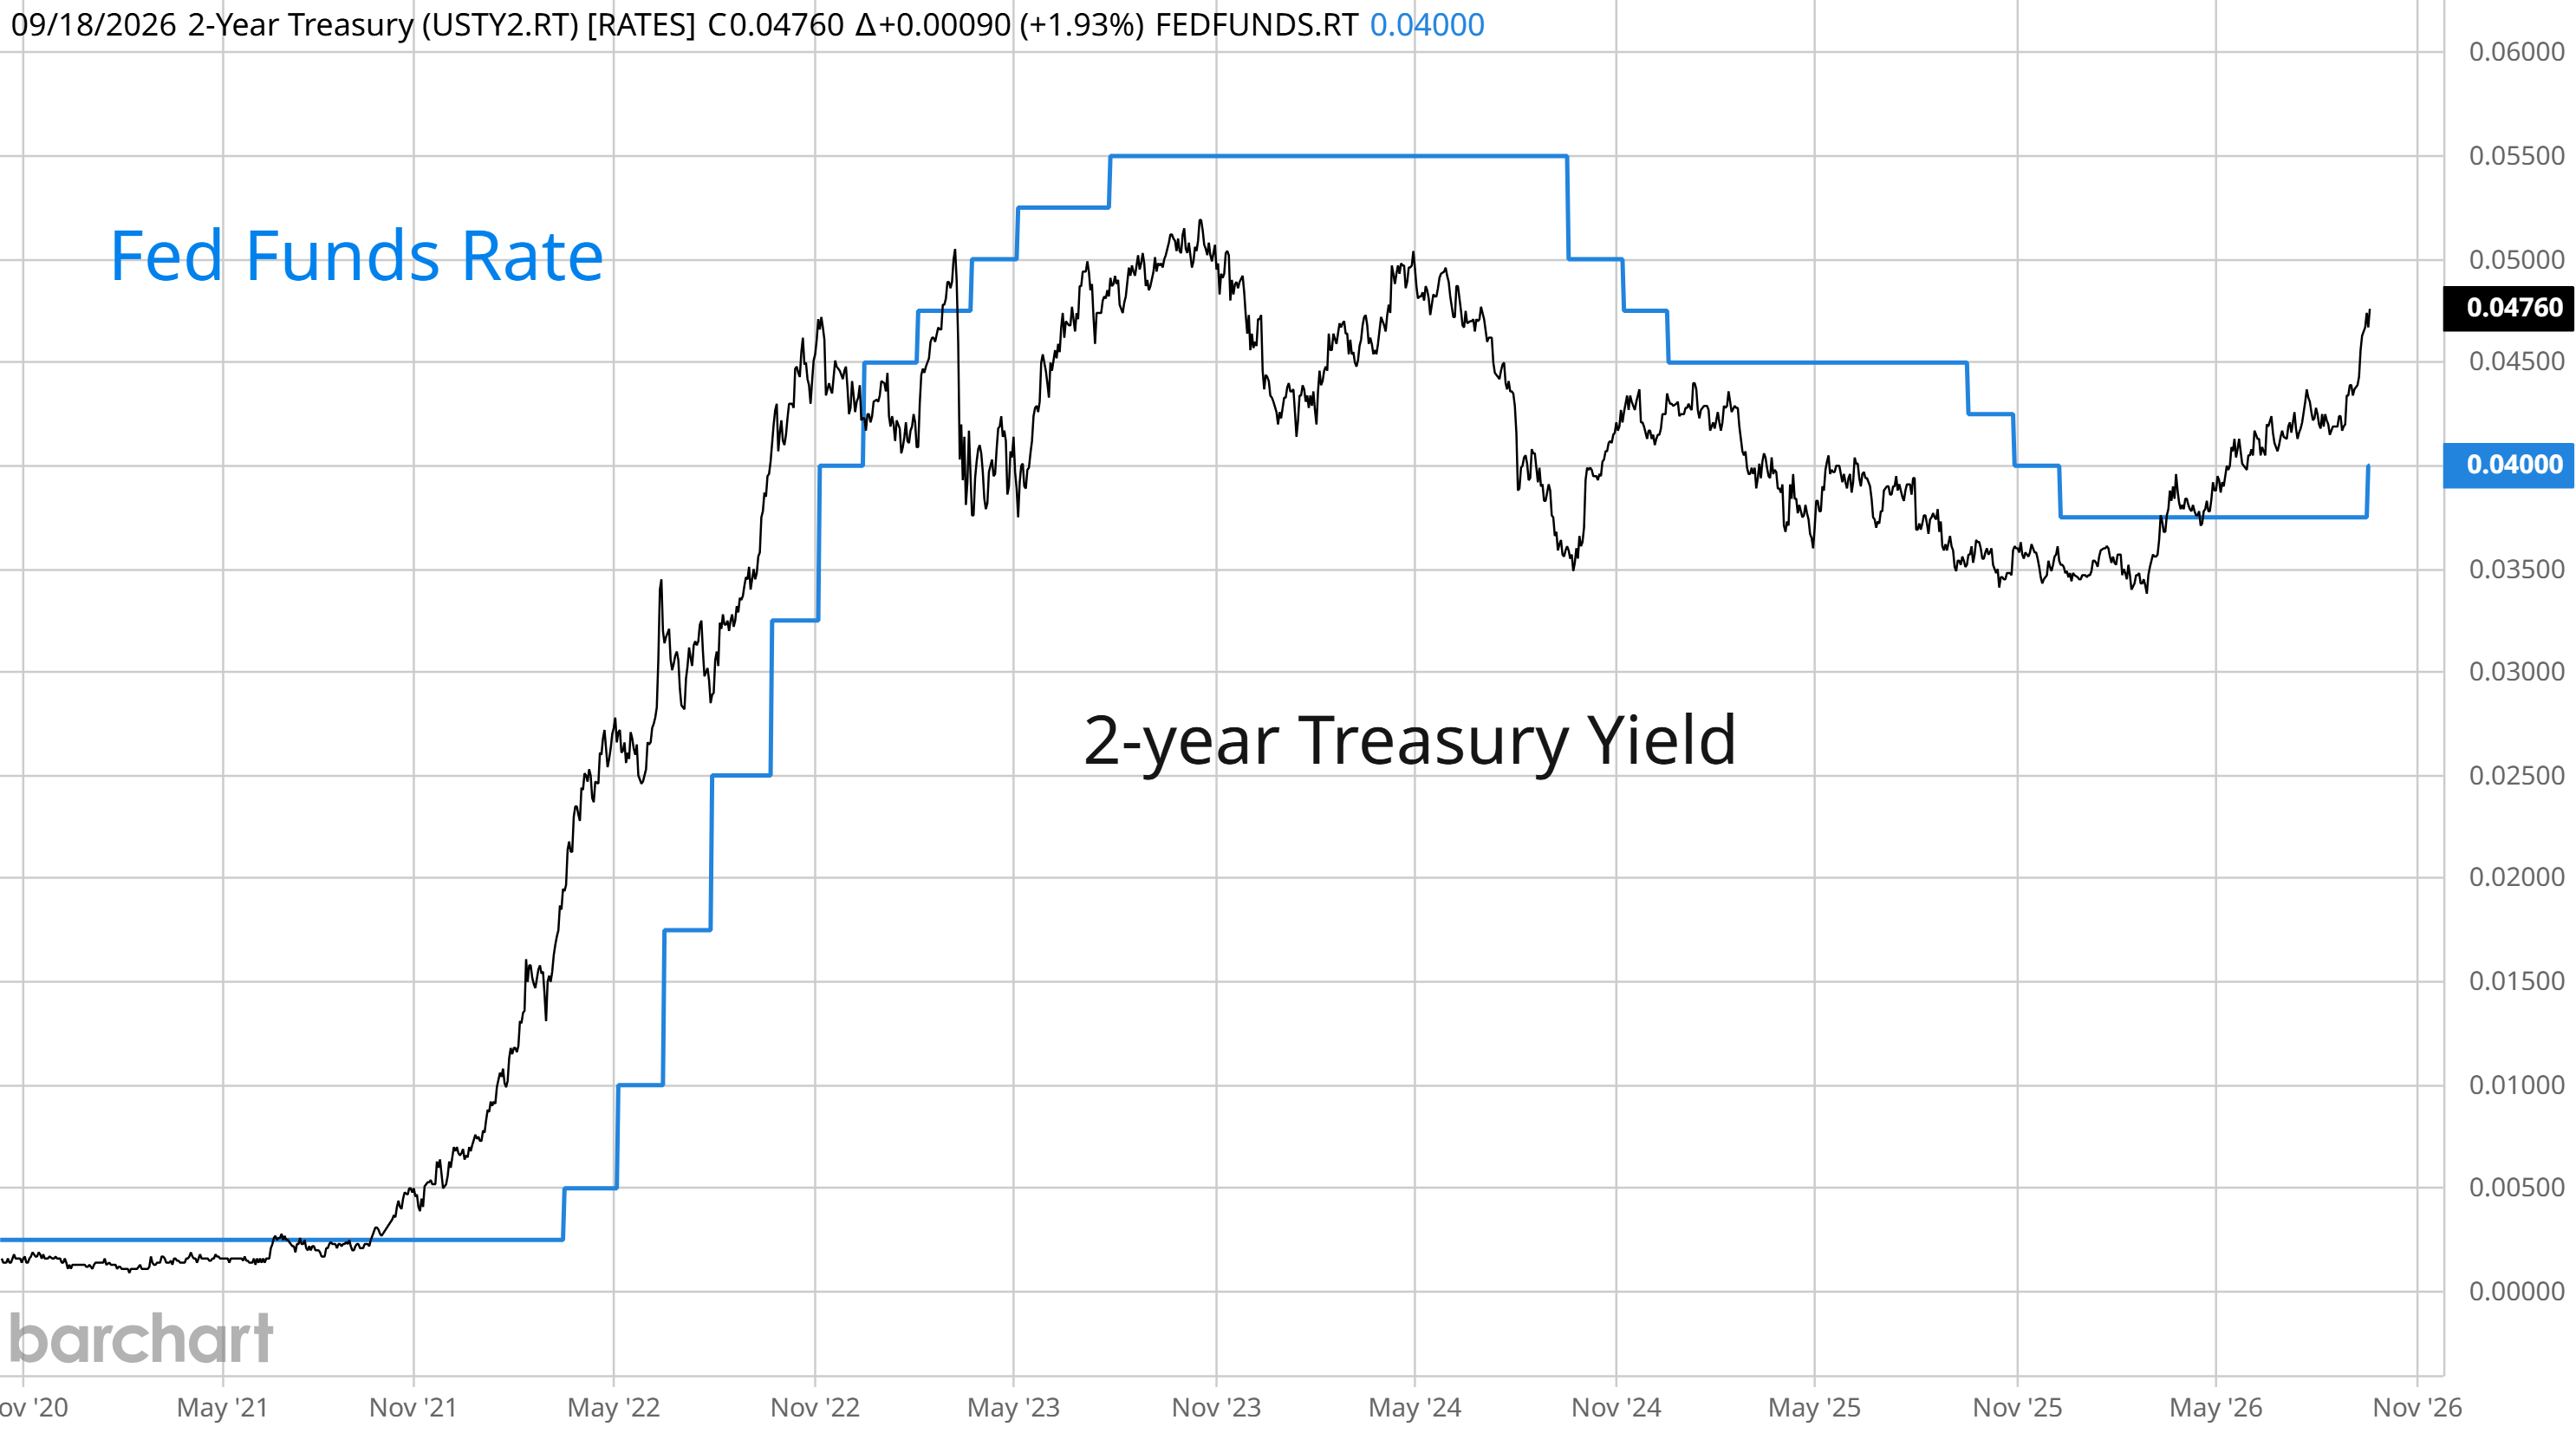
In recent weeks, speculation grew that the Fed would hike interest rates. But market based signals were warning of a tightening cycle several months ago. The 2-year Treasury yield tends to lead changes in the fed funds rate, though it’s not a precision indicator on when a hiking cycle will commence. As inflationary pressures grew following a breakout in commodity prices earlier this year, the 2-year yield crossed above fed funds in March for the first time in over three years. That’s the bond market’s way of warning of rate hikes, with more potentially in store. Despite the hike last week, the 2-year rate sits 76 basis points above the fed funds upper target (chart below), implying three more quarter point rate hikes ahead.
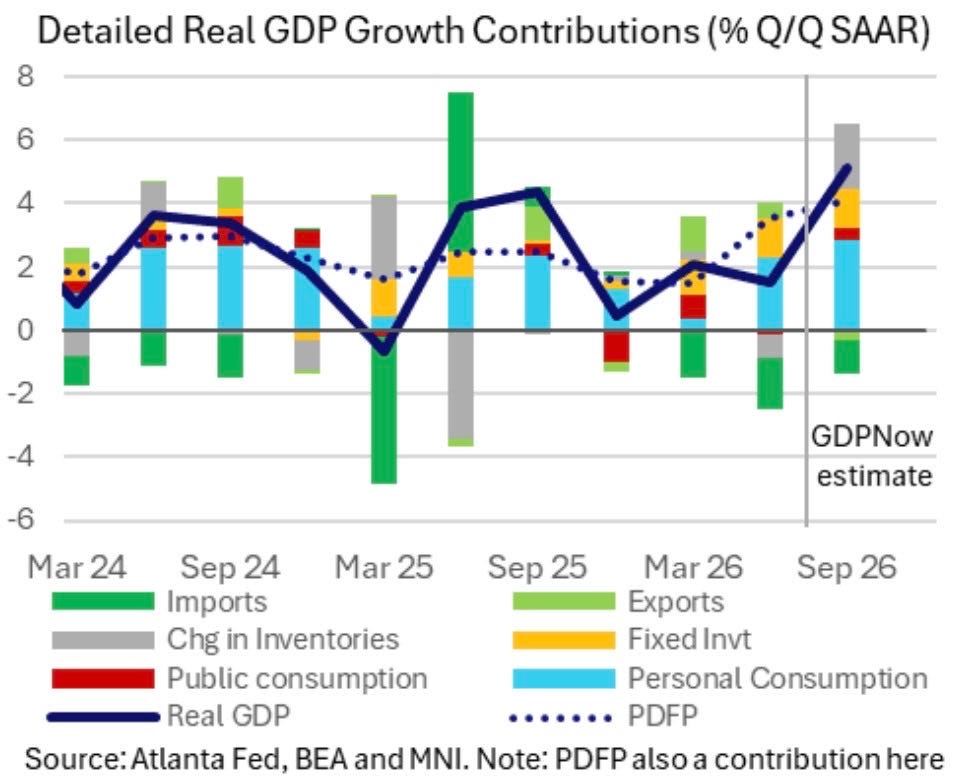
The Fed is missing badly on the price stability portion of its mandate, with consumer inflation running above the Fed’s 2% target for over five years. Fed Chair Kevin Warsh has made returning inflation to the Fed’s 2% target a focus of recent keynote speeches and meeting statements. But another challenge to the fed funds rate could come in the form of strong economic growth. Following last week’s meeting, Warsh characterized monetary policy as accommodative for the economy which promotes growth. The pace of economic growth could come under scrutiny if the Atlanta Fed’s GDPNow estimate holds up, which is running at 5.1% annualized for the third quarter (chart below). The estimate is also receiving a boost from evidence of strong consumer spending along with inventory restocking. A strong economy coupled with high inflation will keep the pressure on the Fed to hike rates.
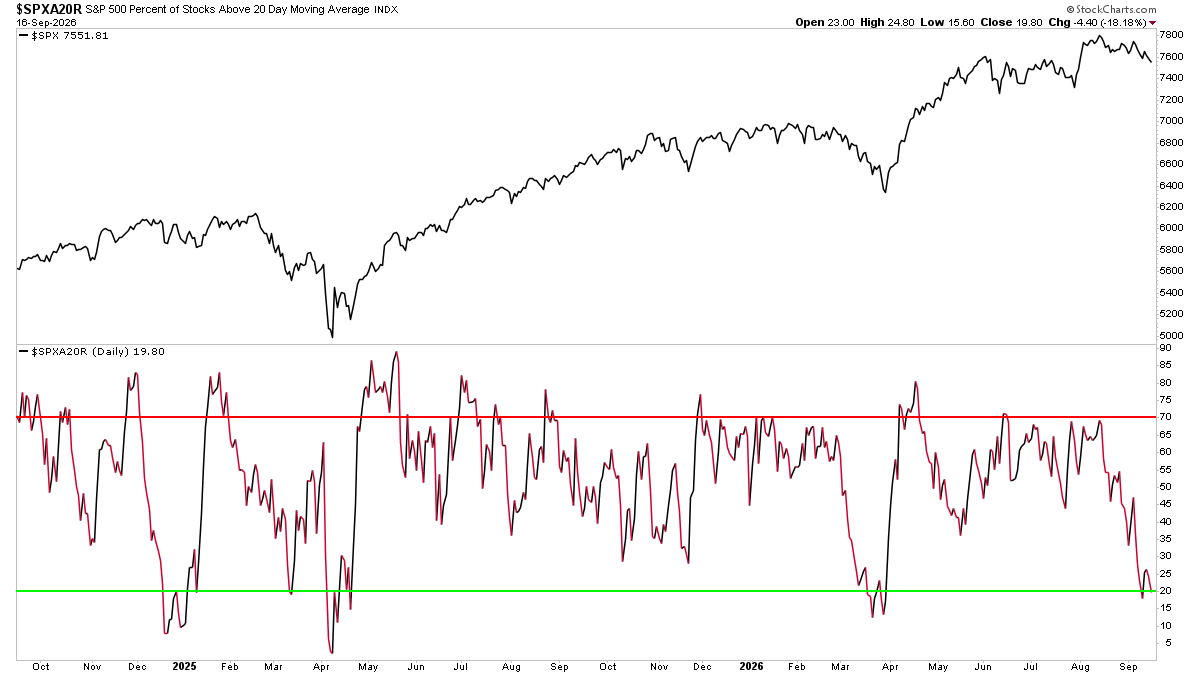
While investors were anticipating a hawkish Fed pivot, the price action in the S&P 500 made it look like stocks were grinding sideways since the start of August. But that masks deteriorating breadth under the hood as the average stock has pulled back in recent weeks. The chart below shows the percent of stocks in the S&P 500 that are trading above their 20-day moving average (MA). That’s a way of measuring how many stocks are trading in short-term uptrends, which stands at just 20% for the S&P. Various other breadth metrics show an oversold breadth condition developing across the market. While the S&P could “catch down” to the average stock, it’s worth noting that breadth measures are hitting oversold levels that have sparked past rallies.
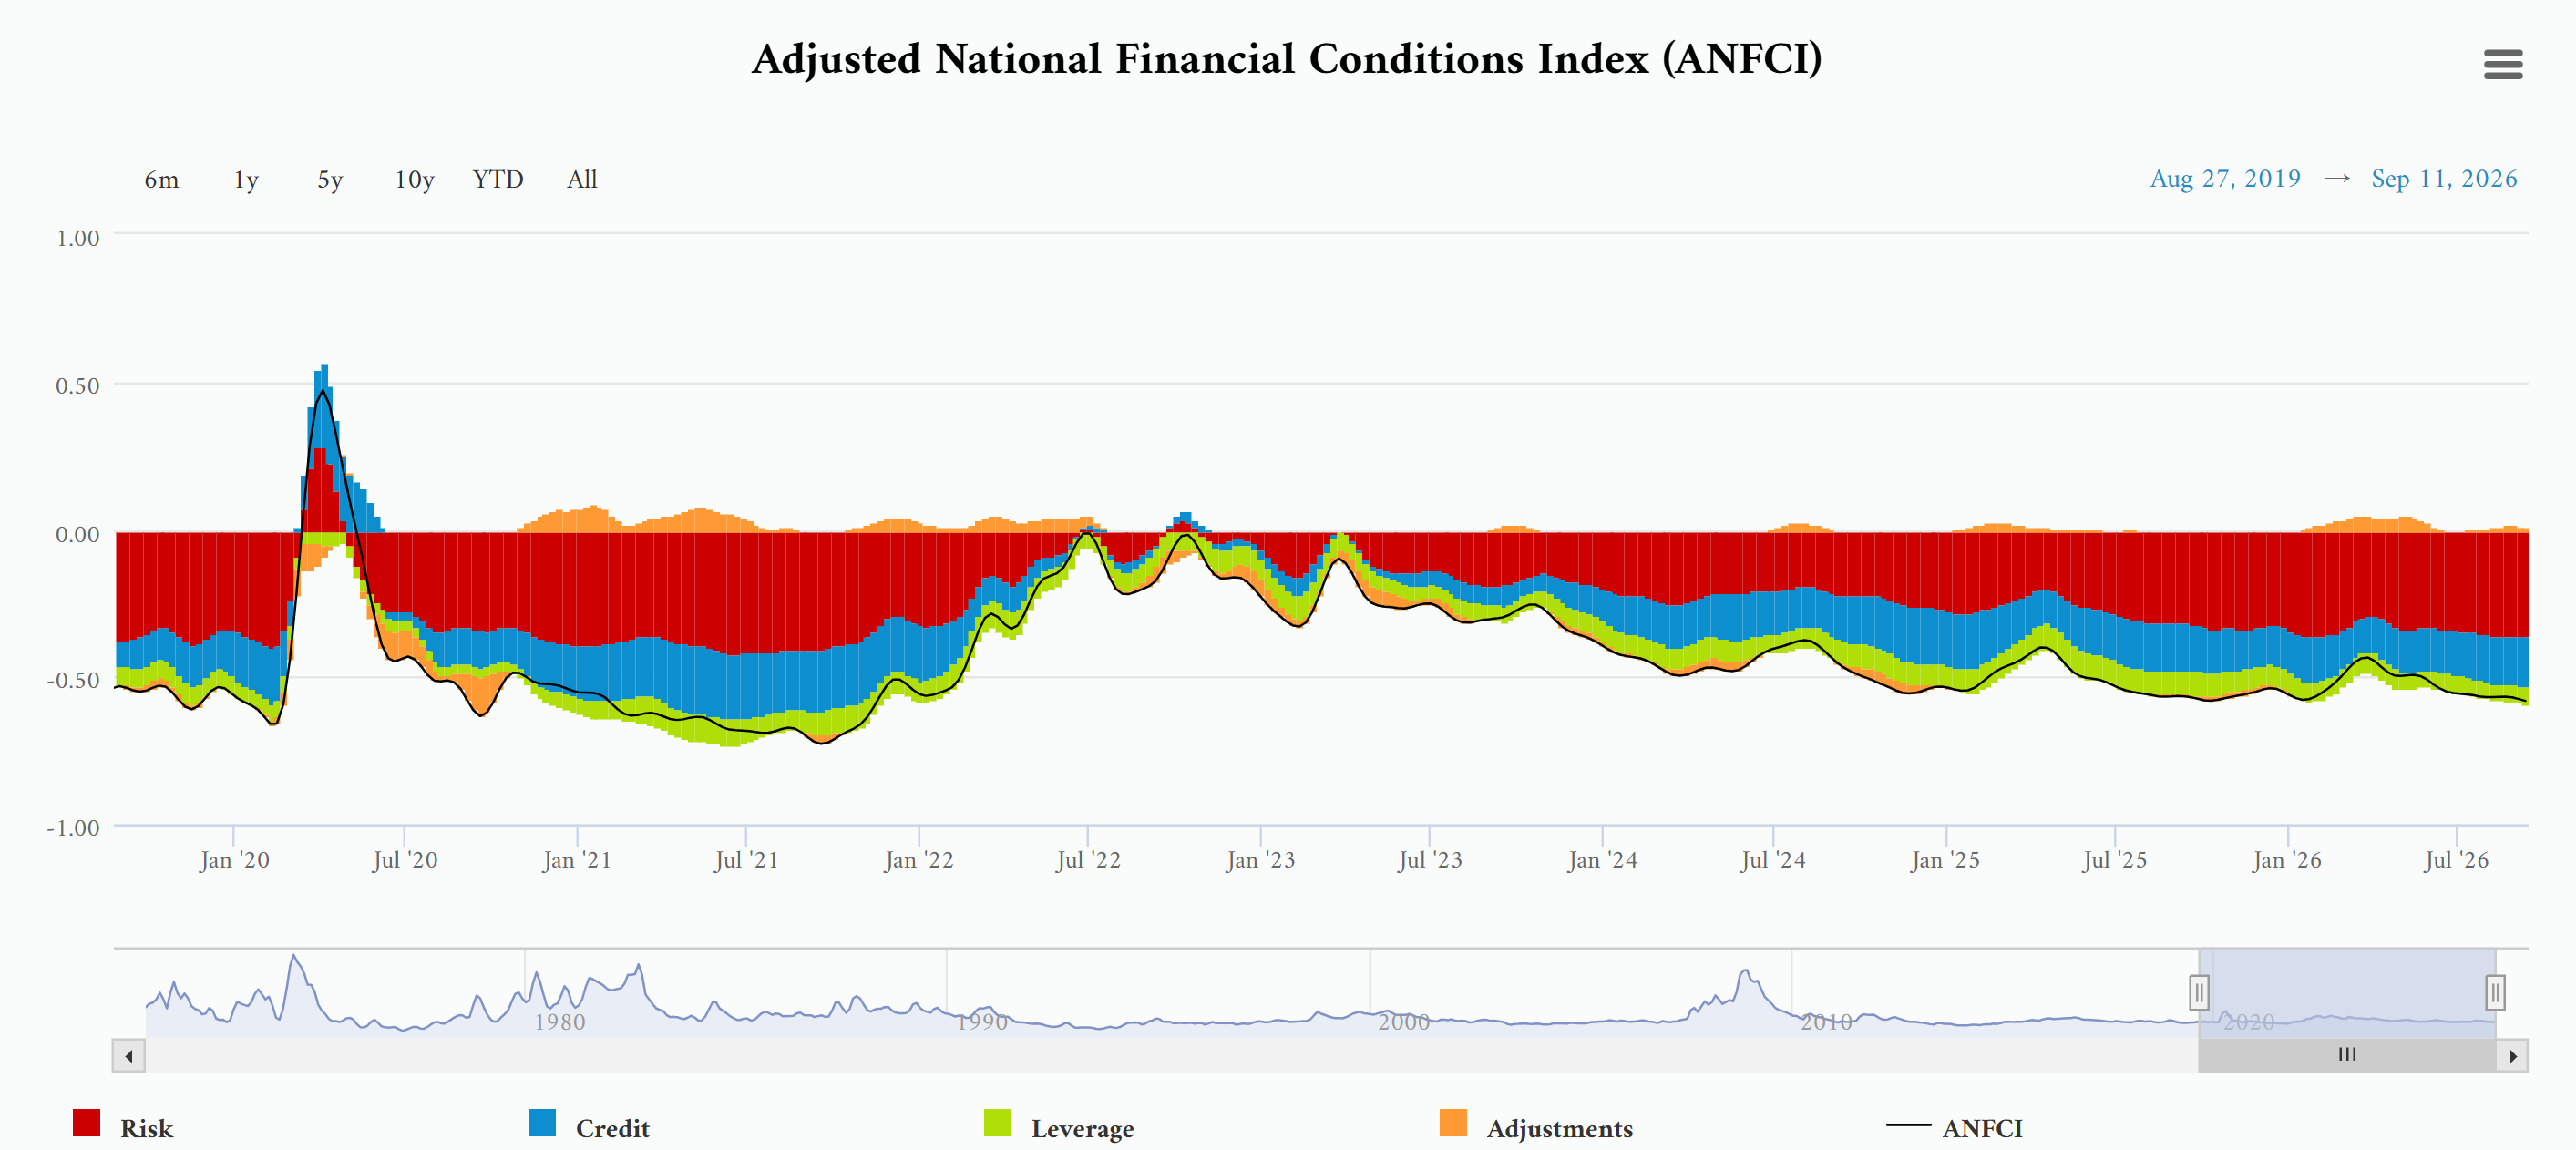
With the pullback in the average stock into a hawkish Fed pivot, investors are now questioning if the bull market is on borrowed time. While the Fed is often a catalyst to bring about the end of the business cycle expansion, it often follows an overall tightening of financial conditions. Financial conditions refers to the cost and availability of credit, where loose conditions and easy credit are supportive of the economy and thus the corporate earnings outlook. While the Fed is a key driver of conditions, other variables like credit spreads and capital market volatility can lead to changes in conditions as well. The chart below shows a measure of conditions from the Fed’s Chicago district, which remains extremely loose compared to the long-term average (the zero line represents the average). Overall loose conditions remains supportive of the economy and bull market.
Heard in the Hub
The Traders Hub features live trade alerts, market update videos, and other educational content for members.
Here’s a quick recap of recent alerts, market updates, and educational posts:
The first Fed rate hike in over three years.
Estimates of economic growth running hot.
What determines the S&P 500’s path from here.
Are the market’s biggest stocks about to breakout?
A boost to GDP estimates from inventory restocking.
You can follow everything we’re trading and tracking by becoming a member of the Traders Hub.
By becoming a member, you will unlock all market updates and trade alerts reserved exclusively for members.
Trade Idea
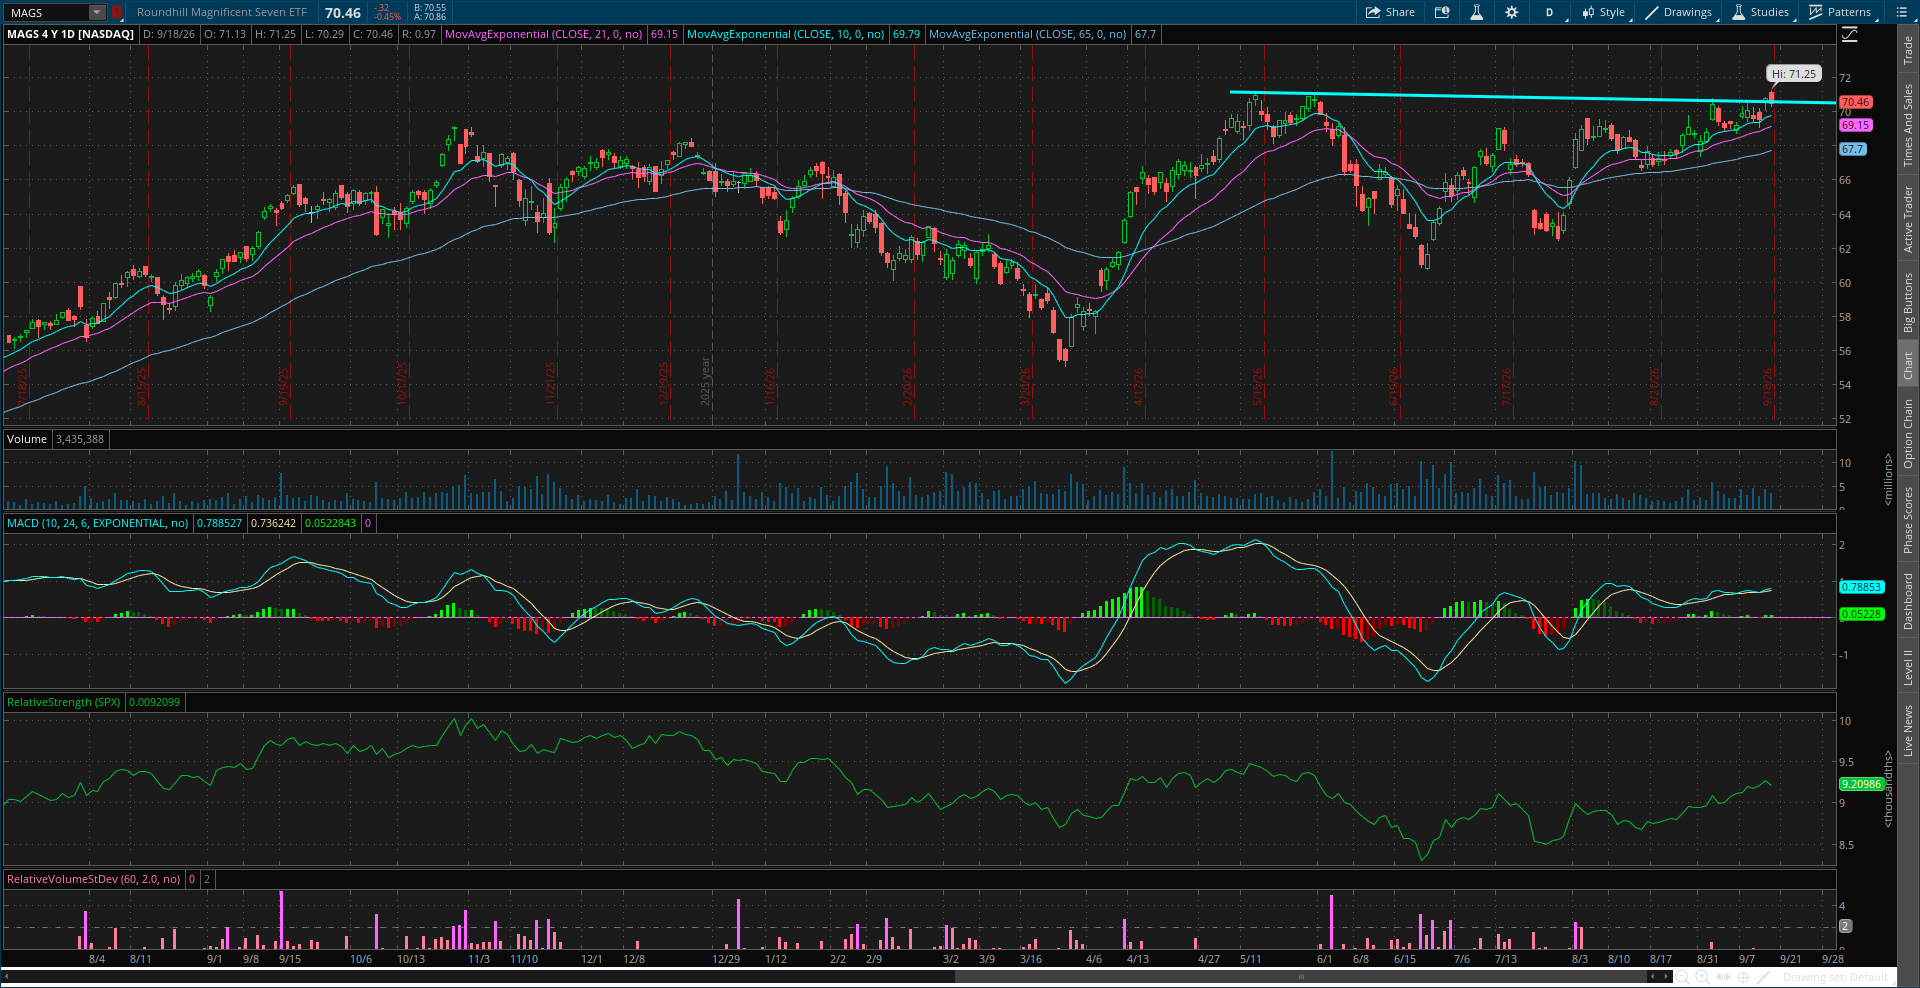
Roundhill Magnificent Seven ETF (MAGS)
The Mag 7 ETF is making a series of higher lows since June while testing the prior highs from May recently. Turning back higher following a MACD hook with weekly momentum indicators supporting a breakout. I’m watching for a move over $72.
Key Upcoming Data
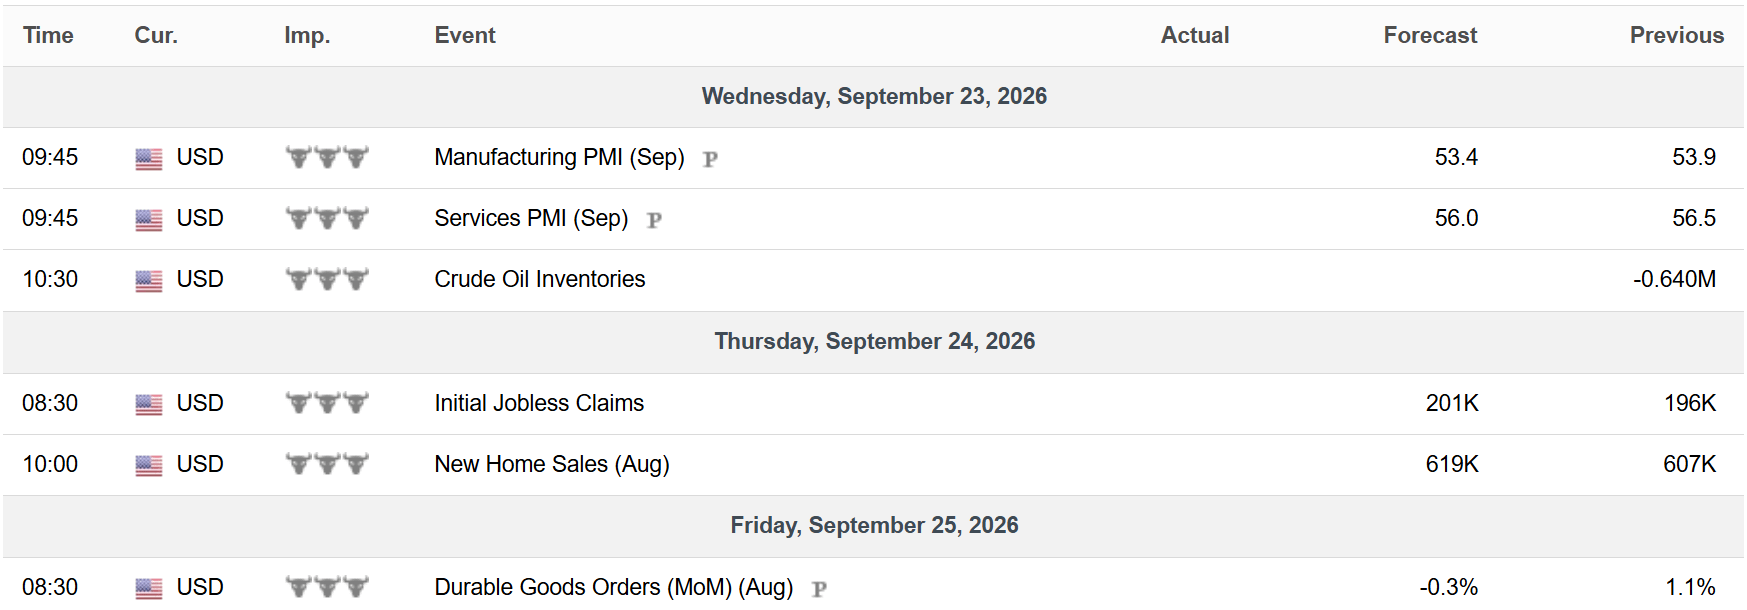
Economic Reports
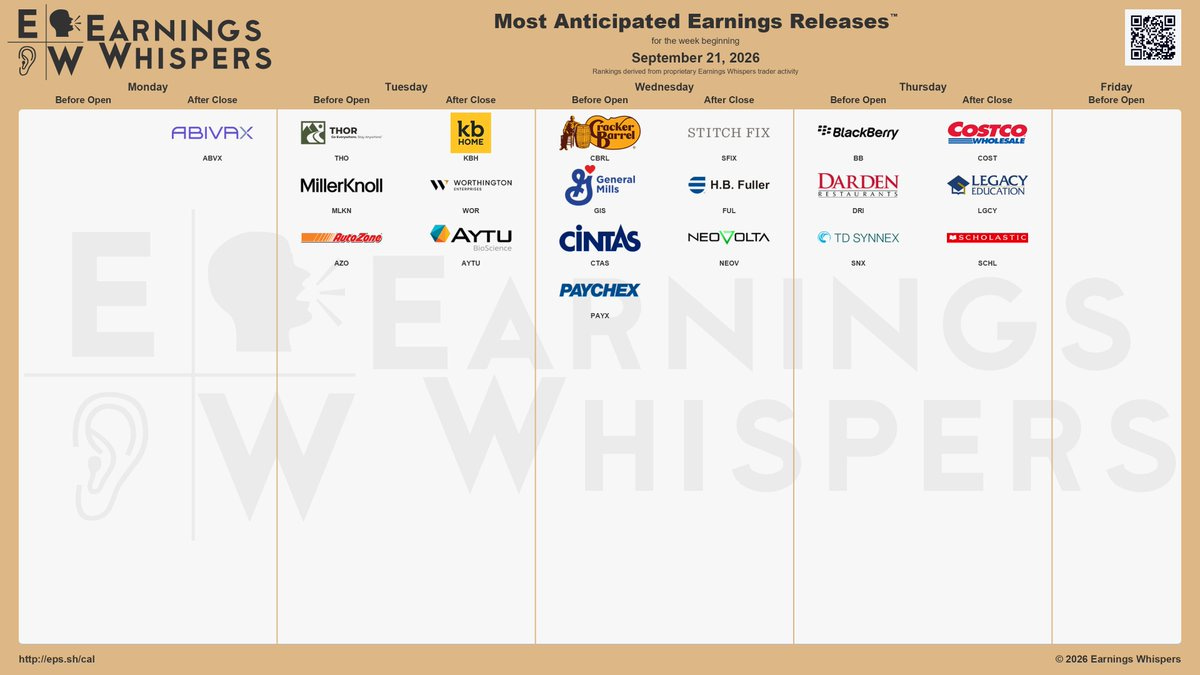
Earnings Reports
I hope you’ve enjoyed The Market Mosaic, and please share this report with your family, friends, coworkers…or anyone that would benefit from an objective look at the stock market.
Become a member of the Traders Hub to unlock access to:
✅Model Portfolio
✅Members Only Chat
✅Trade Ideas & Live Alerts
✅Mosaic Vision Market Updates + More
Our model portfolio is built using a “core and explore” approach, including a Stock Trading Portfolio and ETF Investment Portfolio.
Come join us over at the Hub as we seek to capitalize on stocks and ETFs that are breaking out!
And if you have any questions or feedback, feel free to shoot me an email at mosaicassetco@gmail.com
Disclaimer: these are not recommendations and just my thoughts and opinions…do your own due diligence! I may hold a position in the securities mentioned in this report.