The Market Mosaic 9.18.22
FedEx's profit warning is just the tip of the iceberg for the next phase in stock prices.
Welcome back to The Market Mosaic, where I gauge the stock market’s next move by looking at trends, market internals, and the mood of the crowd. I’ll also highlight one or two trade ideas using this information.
If you find this content helpful please hit that “like” button, share this post, and become a subscriber to this always free newsletter if you haven’t already done so!
Also, be sure to check out Mosaic Chart Alerts. It’s a midweek update covering my best chart setups among long and short ideas in the stock market, along with specific levels that would trigger a trade.
Now for this week’s issue…
The August CPI report on consumer prices was bad all around. Most notably, the core index that strips out volatile food and energy components gained more than expected in a sign that inflationary pressures are becoming more entrenched.
And with investors fixated on inflation and what that means for interest rate policy, it probably comes as no big surprise that the S&P 500 plunged more than 4% the day CPI was released.
Based on the market reaction, you would think the inflation data was the most important thing to hit the tape last week.
But it wasn’t.
The most consequential news last week actually came from FedEx. On Thursday, the company announced that preliminary fiscal 1Q earnings would badly miss estimates and that it was withdrawing full year guidance. That was enough to see FedEx shed over one-fifth of its market capitalization following the release (FDX chart below).
Now based on what I’ve shown you and discussed in these newsletters, the company’s announcement should come as no surprise. And unfortunately, I think it’s just the beginning of the next phase for stocks.
Prepare for the Next Catalyst
I can think of only a few companies better positioned than FedEx to serve as a barometer of macroeconomic conditions. Retailers like Walmart and Target generate insight into the consumer. Lennar and Home Depot can tell you about the housing market.
FedEx has exposure to all of it. And their announcement is a stark warning that we’re embarking on the next phase that could drive stocks lower.
Back in early July, I discussed how rising interest rates and the impact to valuations drove the first leg of this bear market. I also highlighted that earnings revisions would drive the next one.
FedEx’s comments specifically blamed the macro environment, and measures of future macro activity remain concerning. Like with yield curves that I’ve discussed frequently and updated here:
I’ve also shown you here how to use components of purchasing manager indexes to construct leading indicators of activity (which is also predictive of future stock market returns). Those surveys continue to indicate contracting activity.
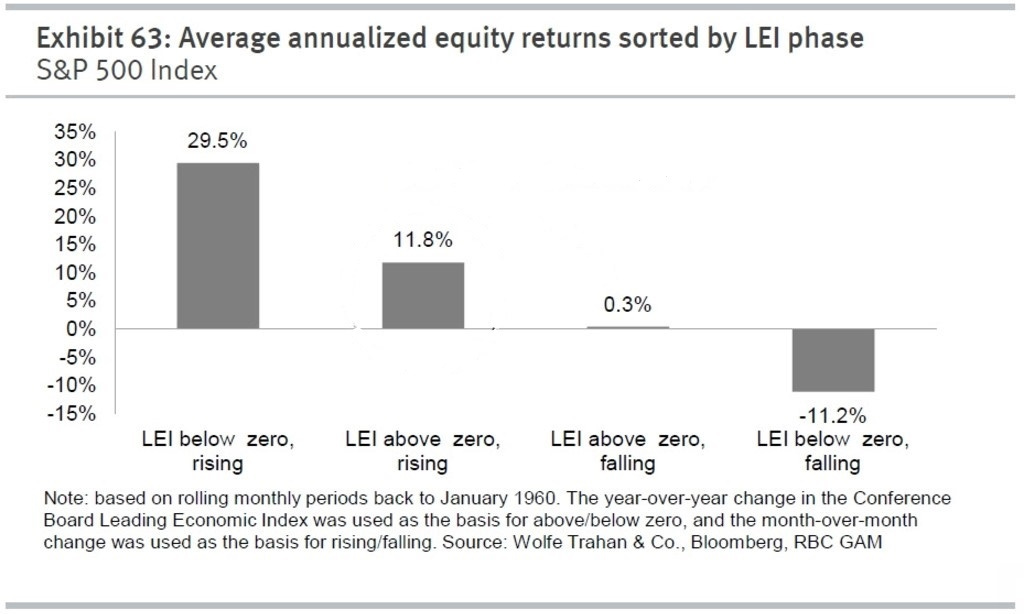
Then there’s also the Conference Board’s Leading Economic Index (LEI) of indicators, where year-over-year growth (blue line) is on the cusp of turning negative as you can see below.
Not only is that another bad signal about economic activity, but a year-over-year change in LEI that is below zero and falling is associated with the worst regime for stock market returns.
Now What…
Breaking down macroeconomic data can generate insights about where the stock market could be headed. The weight of the evidence is that negative earnings revisions are still in the early innings as measures of economic activity continue to worsen.
But while things look bleak, the stock market doesn’t follow a linear path to arrive at its destination. That’s why it’s important to remain objective and adaptive as conditions unfold.
The stock market’s performance last week and loss of key support levels is a major concern. But going into the Federal Reserve’s highly anticipated meeting this week, the stock market is once again extremely oversold especially on breadth measures. That includes the McClellan Oscillator that I showed you here among others. I also noted this positive divergence unfolding with another breadth metric I mention often:
This doesn’t mean I’m loading up on long positions. After all, I only take a position once my breakout level is achieved, and this market action is creating a lack of triggers. But I’m still keeping my short list of opportunities to buy should the stock market find its footing.
That now includes HLIT, which surged higher with a jump in volume on Friday. That has the stock testing the $12 resistance level from the start of the year.
I’m also adding names to my watchlist of short setups, where I’m monitoring for a break of major support levels. That includes AI, which is again testing the $14 support level for the third time since May. The more often a level is tested, the more likely it will give way.
The market action has certainly been frustrating ever since the S&P tested and pulled back from its 200-day moving average, but I did want to highlight one advantage of my trading methodology.
Given the lack of follow through on my breakout setups covered here or in Mosaic Chart Alerts, I’ve carried a heavy cash position during this pullback. I expect to maintain that position over the near-term, especially since many of the prime setups in the energy space are now weakening as well.
I hope you’ve enjoyed this edition of The Market Mosaic, and please share this newsletter with anyone you feel could benefit from an objective look at the stock market.
Make sure you never miss an edition by subscribing here.
For updated charts, market analysis, and other trade ideas, give me a follow on twitter: @mosaicassetco
And if you have any questions or feedback, feel free to shoot me an email at mosaicassetco@gmail.com
Disclaimer: these are not recommendations and just my thoughts and opinions…do your own due diligence! I may hold a position in the securities mentioned in this newsletter.


