
The Market Mosaic 9.14.25
S&P 500: Climbing the Wall of Worry.

👋Welcome back to The Market Mosaic, where I gauge the stock market’s next move by looking at macro, technicals, and market internals. I’ll also highlight trade ideas using this analysis.
If you find this report helpful please hit that “like” button, share this post, and become a subscriber if you haven’t already done so!
🚨And be sure to check out Mosaic Traders Hub. It’s a members-only platform to alert trade ideas, track a model portfolio of open positions, and further analyze the message coming from the capital markets (👇be sure to check out our special offer below).
Now for this week’s issue…
Core consumer inflation continues running hot, but it wasn’t enough to derail hopes for an interest rate cut by the Federal Reserve this week.
The Consumer Price Index (CPI) rose by 2.9% in August compared to last year. The core figure that strips out food and energy prices increased by 3.1%. Both measures remain well above the Fed’s 2% inflation target.
The disinflation trend off the last inflation wave that peaked in mid-2022 has continued stalling out. You can see in the chart below that core CPI (orange line) has stayed around the 3.0% level for 14 months now, and is also moving higher recently.
, peaking around mid-2022. The yellow line represents year-over-year changes in core CPI, also peaking around the same time. The x-axis shows dates from 2020 to 2023, and the y-axis ranges from 0.0 to 8.0. A watermark reads \"Bloomberg Finance LP, 13-Sep-2023 06:55.\"")
While inflation remains a problem for the Fed, the central bank’s focus has clearly shifted toward supporting the labor market. The August payrolls report missed estimates with just 22,000 jobs created during the month.
Negative revisions to prior data keeps stacking up as well with a massive downward revision to the initial payrolls estimate for the 12 month period ended in March. The Bureau of Labor Statistics made a preliminary benchmark payrolls revision that reduced job growth by a record 911,000.
That has the market pricing several rate cuts ahead. Market-implied odds point to five quarter-point rate cuts over the coming the year. The 2-year Treasury yield suggests around three to four cuts.
There’s a 100% chance the Fed will reduce rates when it meets this week…the only question is by how much.
Either way, a new rate cutting cycle is set to begin at a time when financial conditions are already loose and the stock market is signaling a positive growth outlook.
This week, let’s look at evidence in the CPI report that inflationary pressures are continuing to build and why the fed funds rate backdrop is eerily similar to the 1990s. We’ll also look at why the stock market is continuing to climb a wall of worry, and the conditions in place to spark more upside in the bull market despite recession fears.
The Chart Report
A lack of upside surprises in the CPI report relative to economist estimates has investors breathing a sigh of relief on the outlook for rate cuts. But underlying core CPI components show inflationary pressures continuing to build which could lead to rising inflation in the months ahead. The chart below shows how core goods tends to move first and is inflecting higher. Core services ex-housing (i.e. supercore) tends to move next, followed by housing. The disinflation trend across those three core inflation components is either stalling out or already moving higher.

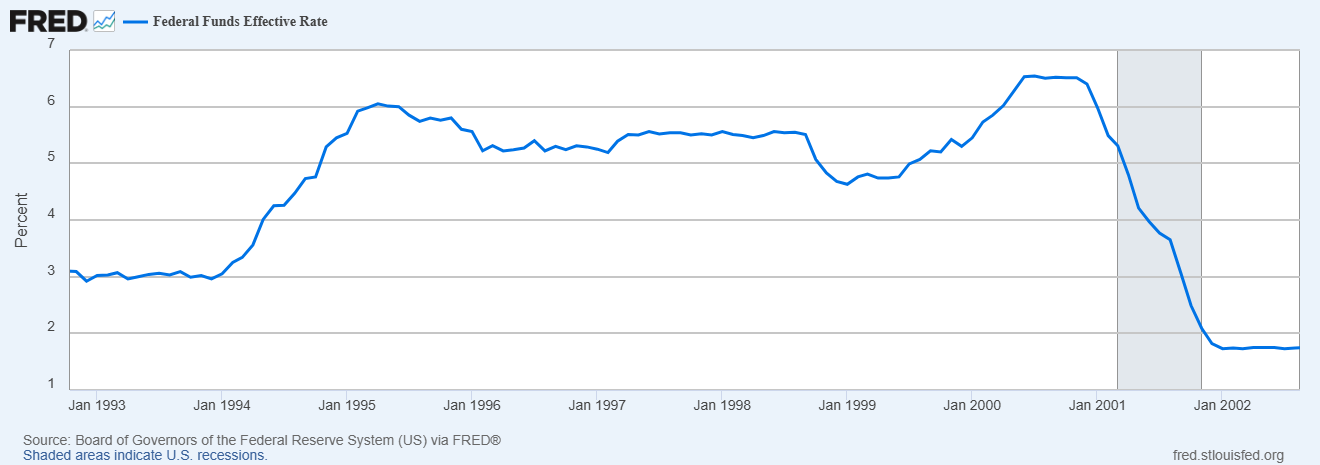
The back drop for the fed funds rate shares remarkable similarities to what unfolded into the late 1990s economic boom and internet bubble in the stock market. Back then, the Fed cut interest rates by 1.0% in 1995 and proceeded to hold rates steady for an extended amount of time (chart below). The Fed also cut by 1.0% late last year and has held rates steady since then. In 1998, the Fed resumed rate cuts with about another 1.0% reduction until it was forced to reverse course in 1999 which helped caused a recession and pop the internet bubble. A similar scenario could unfold this time around if inflationary pressures build into next year and the economy avoids recession, which would limit rate cuts and lead to a fresh round of tightening.
The Fed is about to start cutting interest rates at a time when financial conditions are running much looser than average. Financial conditions reflect the availability and cost of credit. When credit is cheap and plentiful, that tends to be a tailwind for economic activity (and can help the earnings picture as well). The Chicago Fed’s measure of financial conditions is at the loosest level since 2022. Goldman Sachs tracks a global measure of financial conditions, which has eased to the lowest level in 12 months (chart below). Restarting the rate cutting cycle should be another tailwind for easing financial conditions.

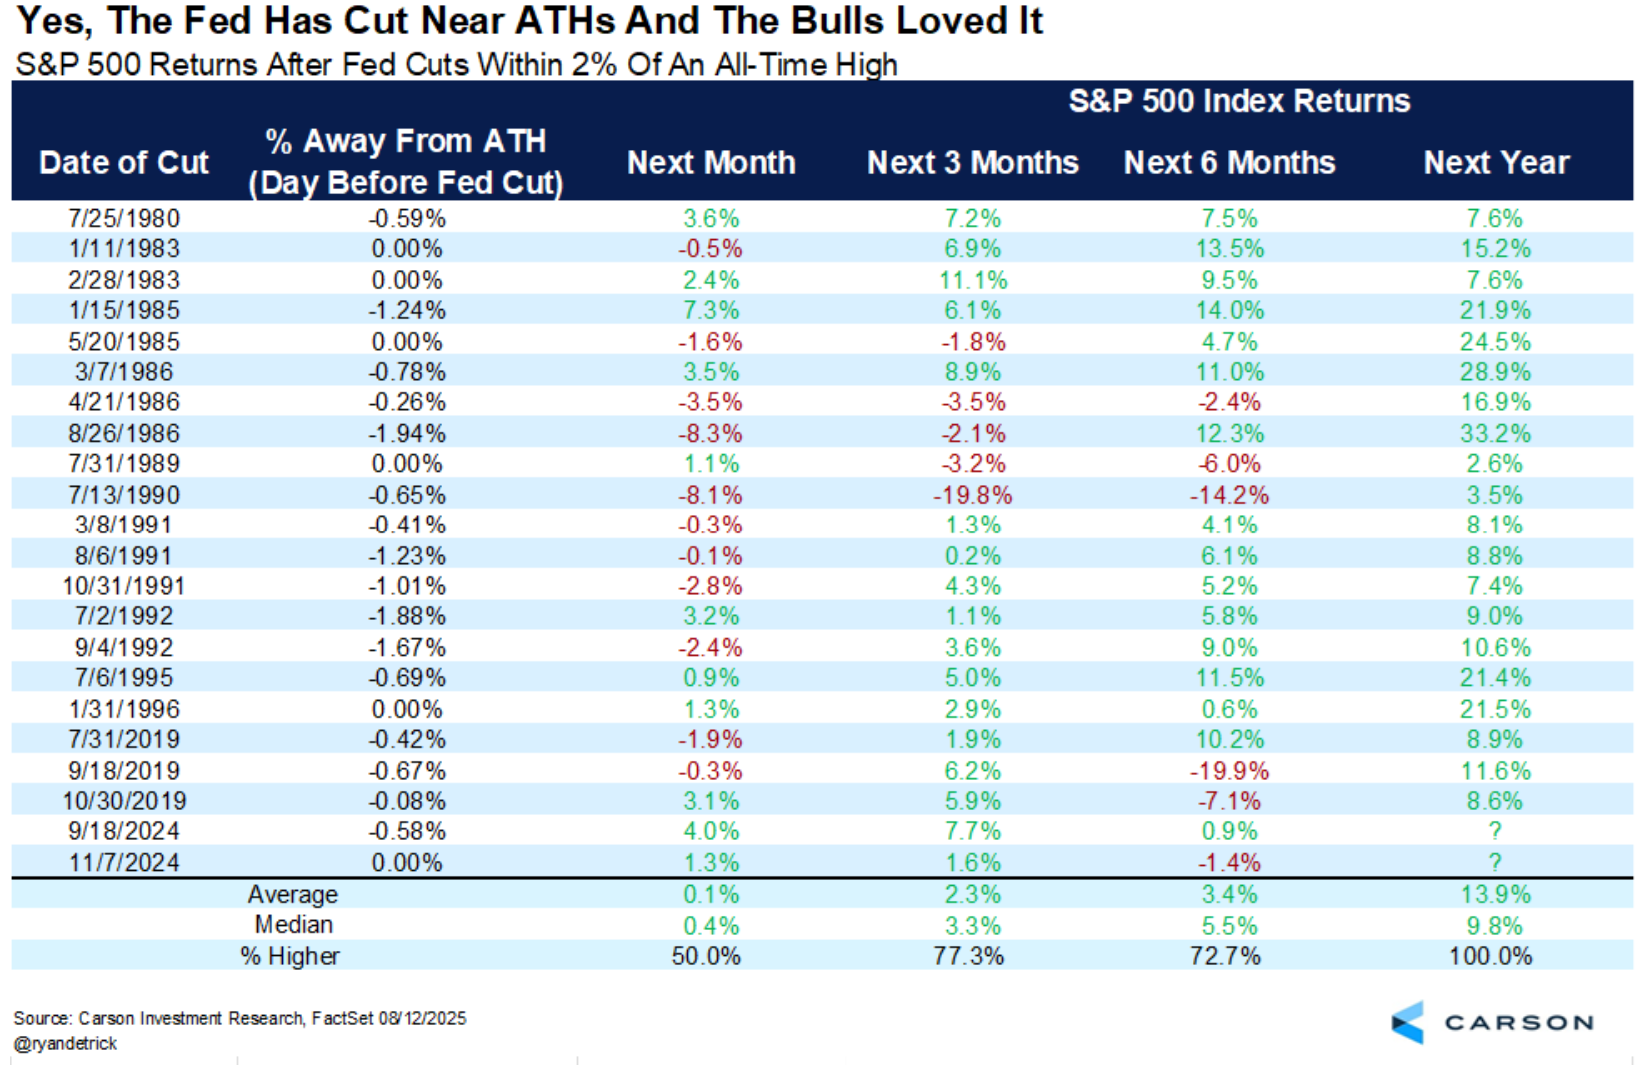
Interest rate cuts by the Fed often precede recession as the central bank acts too late in response to a weakening economy. That’s because the Fed’s mandate spans lagging economic indicators like labor market data. But the stock market tends to lead changes in economic activity, and is often off the peak by the time the Fed starts cutting. But when the Fed cuts and the S&P 500 is within 2% of an all-time high, that tends to see positive forward returns for the S&P 500. While the near-term movements in the index are volatile, forward periods from three- to twelve-months out experiences strong average gains and a high win rate historically (table below).
While the S&P 500 is setting more record closing highs over the past week, investor sentiment is nowhere near bullish extremes. If anything, several measures of sentiment shows that fear is the prevailing emotion. The AAII survey of retail investors showed bearish views at 49.5% last week compared to bullish views at just 28%. Bearish views are also well above the historical average of 31%. Positioning by large speculators in stock index futures is also leaning bearish. You can see in the chart below that large speculators are collectively net short across stock index futures, where positioning in the group is seen as a contrarian signal. Various measures of sentiment are a tailwind for stock prices as the market climbs a wall of worry.

Heard in the Hub
The Traders Hub features live trade alerts, market update videos, and other educational content for members.
Here’s a quick recap of recent alerts, market updates, and educational posts:
Dot-com bubble similarities are stacking up.
The Fed could supercharge the trading backdrop.
The catalyst to trigger a jump in commodity prices.
How to trade breakouts with options to define your risk.
Adding a position on the breakout in quantum computing stocks.
You can follow everything we’re trading and tracking by becoming a member of the Traders Hub.
By becoming a member, you will unlock all market updates and trade alerts reserved exclusively for members.
🚨Hub members were alerted to five new trades last week spanning AI, space, and quantum computing sectors. Check out the special offer below to join the Hub today.
👉You can click here to join now👈
Trade Idea
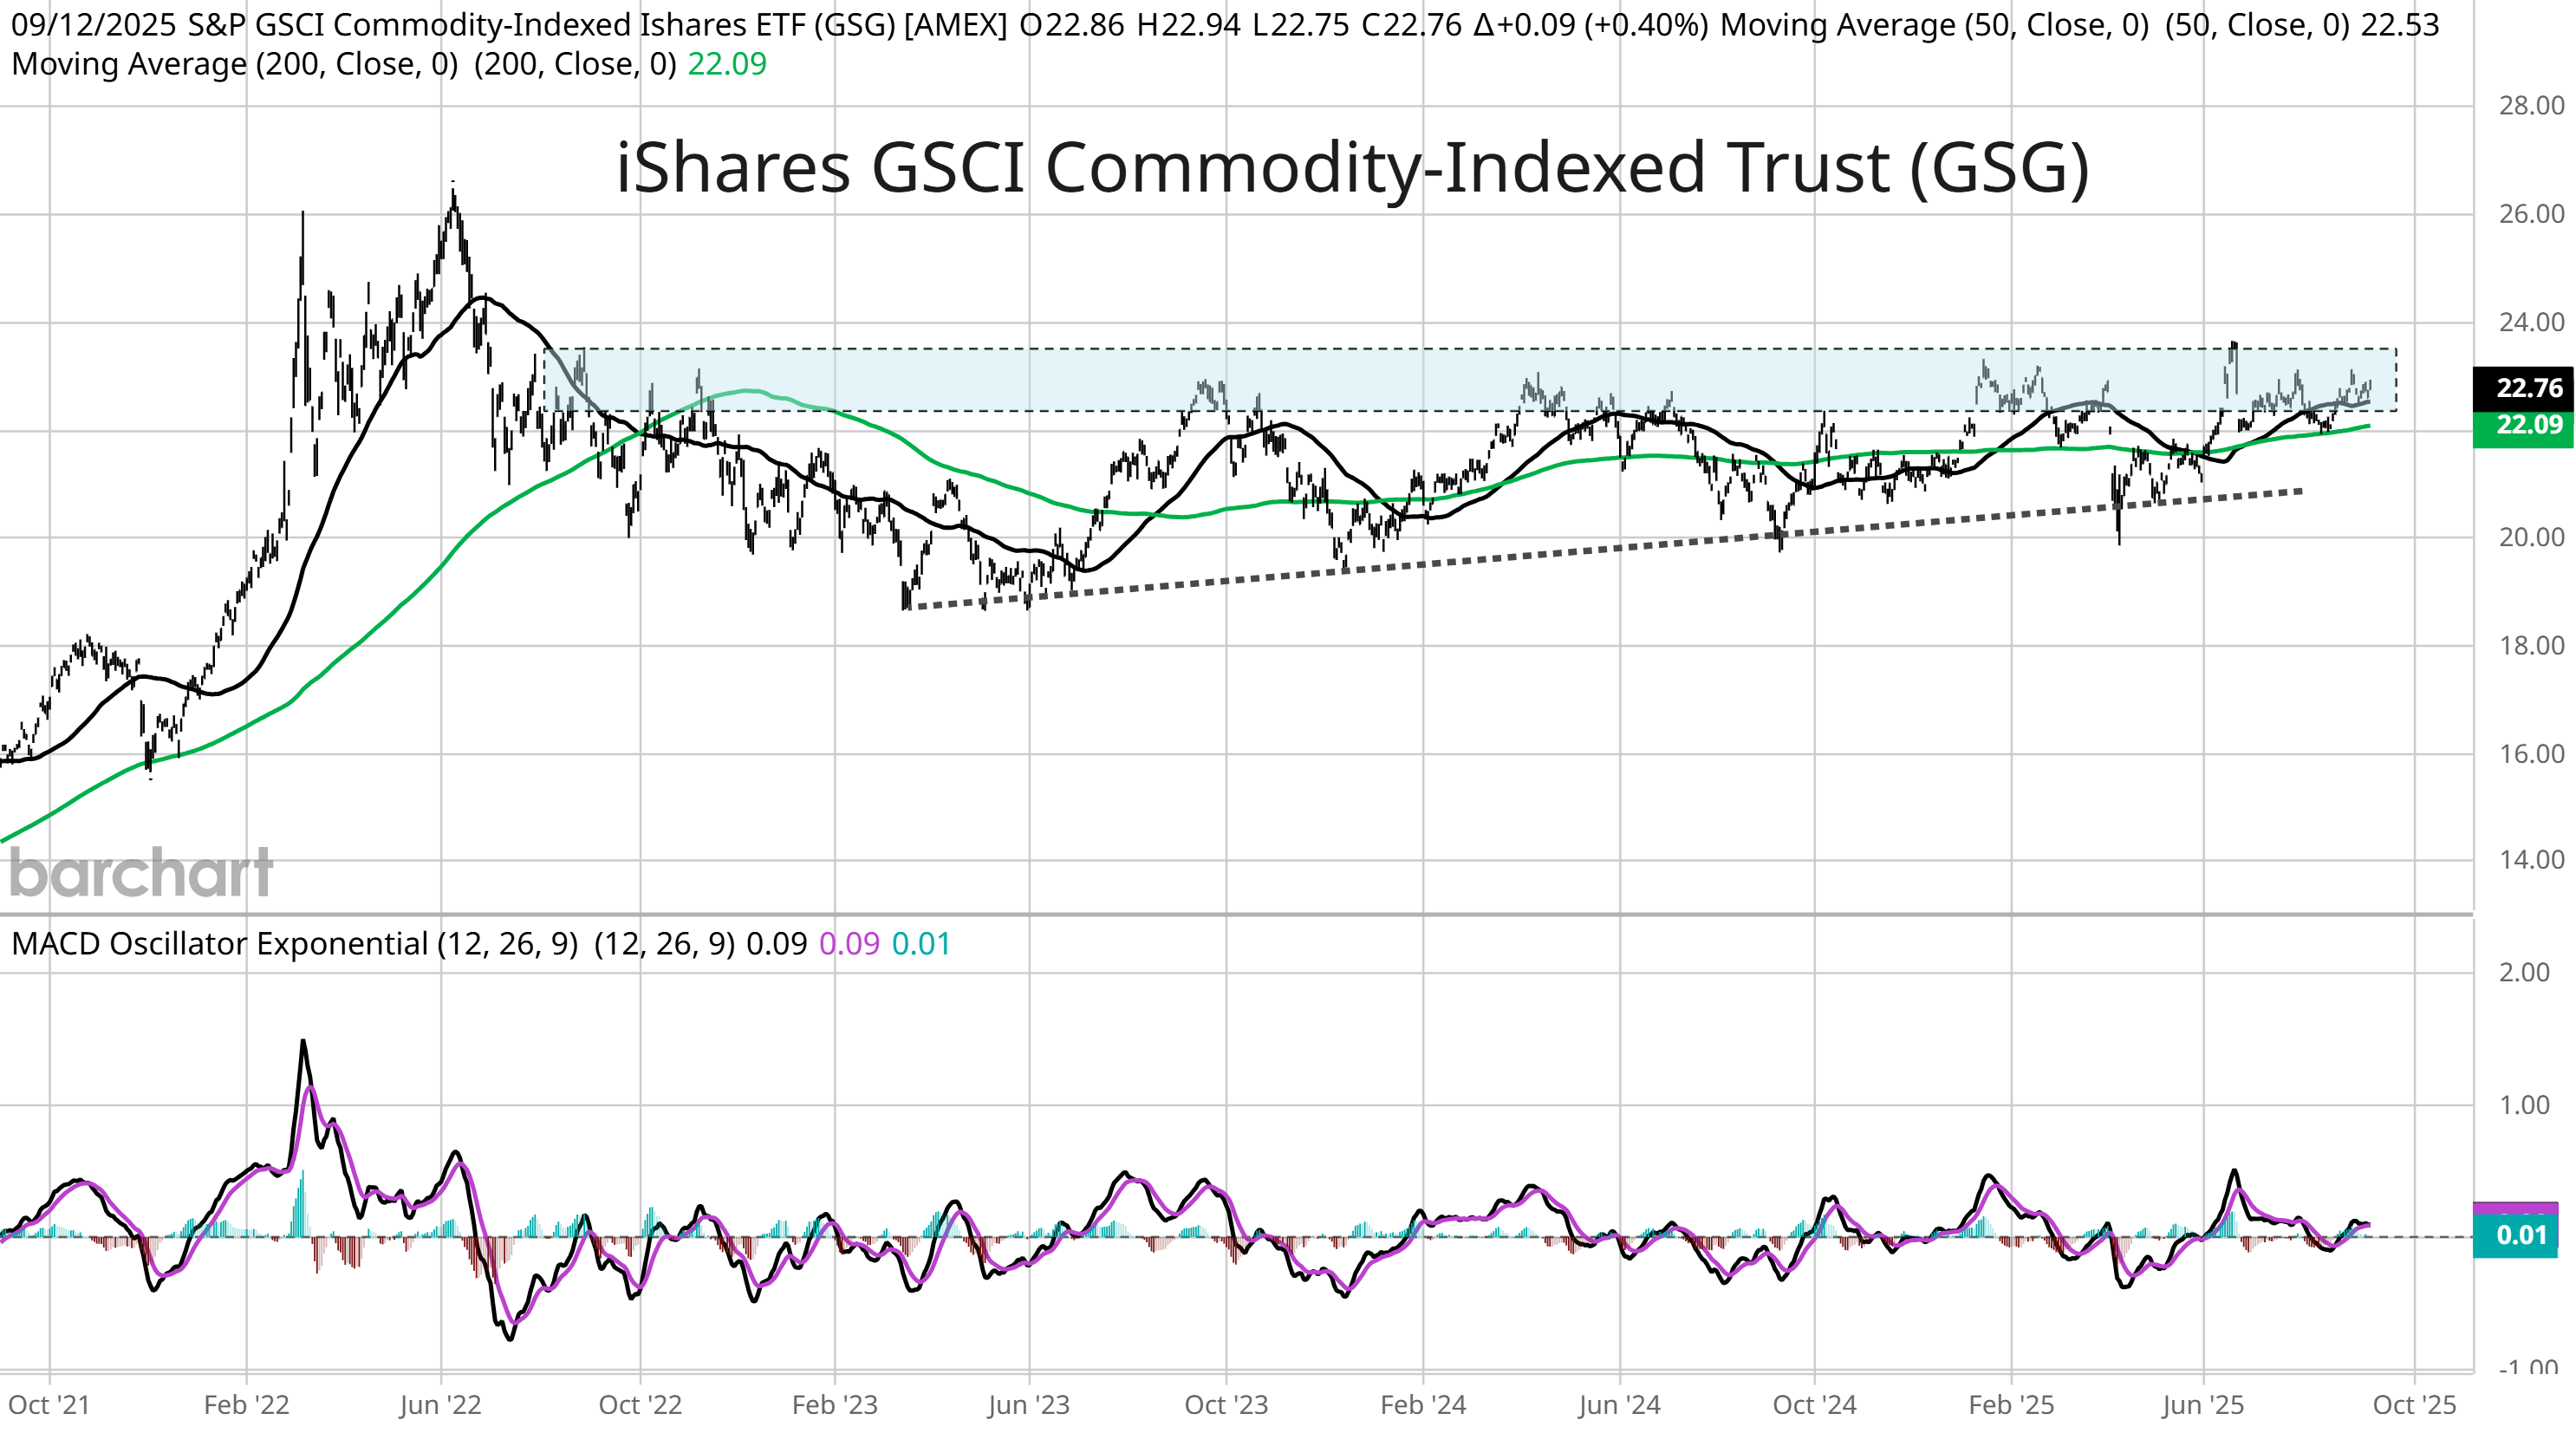
iShares S&P GSCI Commodity-Indexed Trust ETF (GSG)
If asset classes with high inflation-betas are rallying (i.e. gold), then I would expect broad commodity indexes to eventually follow. GSG is back near $24 resistance in a multi-year basing pattern.
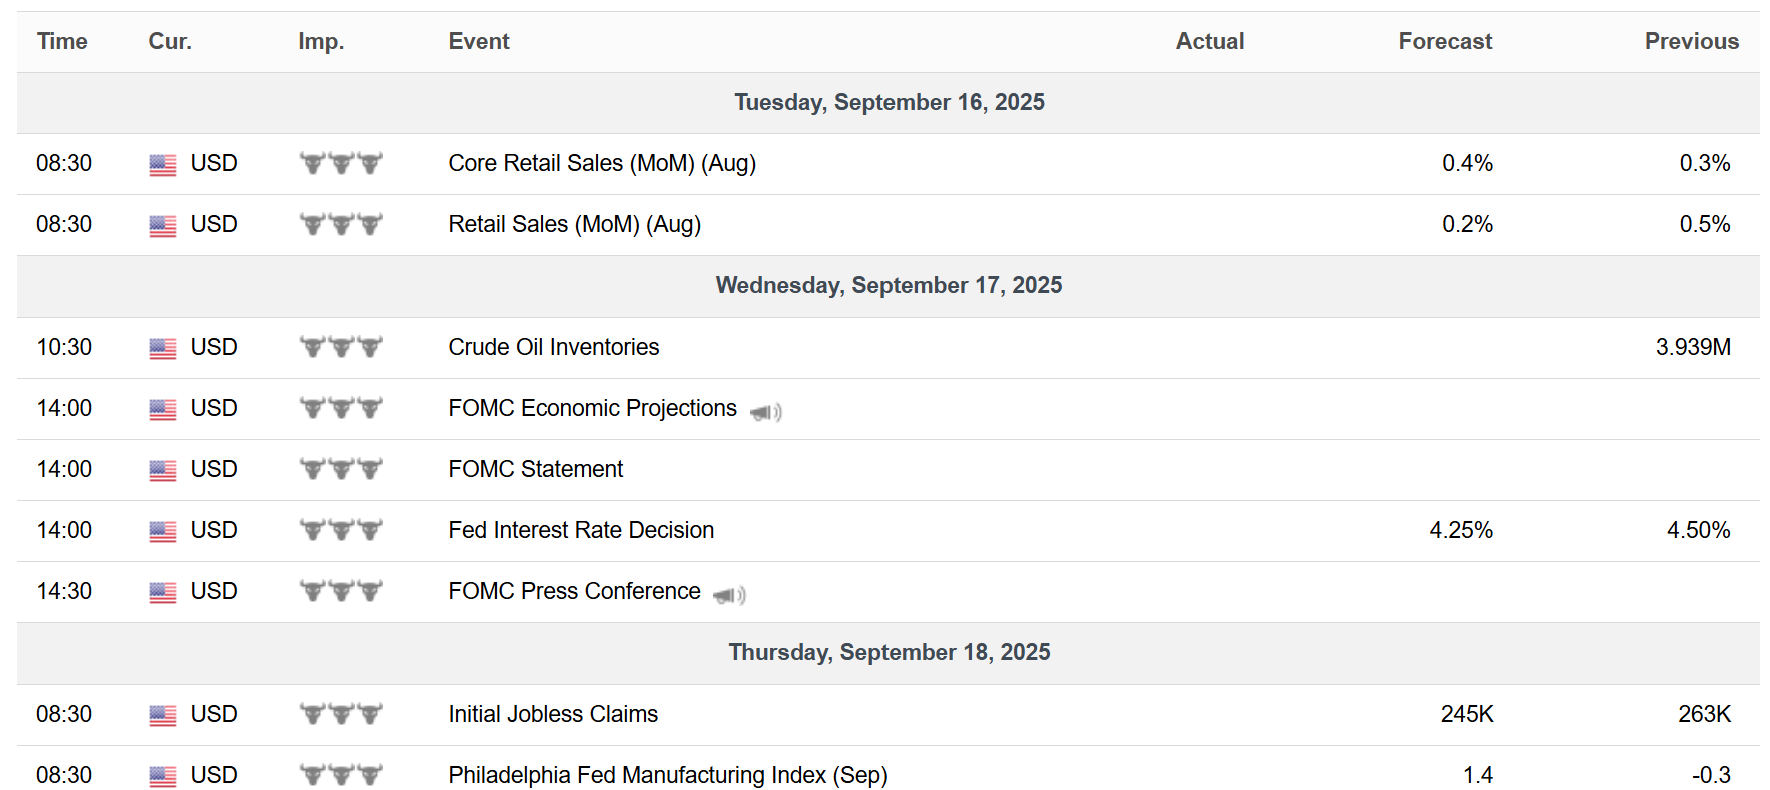
Key Upcoming Data
Economic Reports
Earnings Reports

I hope you’ve enjoyed The Market Mosaic, and please share this report with your family, friends, coworkers…or anyone that would benefit from an objective look at the stock market.
Become a member of the Traders Hub to unlock access to:
✅Model Portfolio
✅Members Only Chat
✅Trade Ideas & Live Alerts
✅Mosaic Vision Market Updates + More
Our model portfolio is built using a “core and explore” approach, including a Stock Trading Portfolio and ETF Investment Portfolio.
Come join us over at the Hub as we seek to capitalize on stocks and ETFs that are breaking out!
And if you have any questions or feedback, feel free to shoot me an email at mosaicassetco@gmail.com
Disclaimer: these are not recommendations and just my thoughts and opinions…do your own due diligence! I may hold a position in the securities mentioned in this report.