

👋Welcome back to The Market Mosaic, where I gauge the stock market’s next move by looking at macro, technicals, and market internals. I’ll also highlight trade ideas using this analysis.
If you find this report helpful please hit that “like” button, share this post, and become a subscriber if you haven’t already done so!
🚨And be sure to check out Mosaic Traders Hub. It’s a members-only platform to alert trade ideas, track a model portfolio of open positions, and further analyze the message coming from the capital markets.
Now for this week’s issue…
An oversold rally in AI infrastructure stocks is being amplified by growing optimism that tighter monetary policy could be delayed.
A massive rally from a failed pattern breakdown has seen the S&P 500 gain 5.7% in just a four-day period while the Nasdaq-100 Index jumped by 9.3% for its best stretch since rally off the April 2025 tariff-driven selloff.
While the average stock has been gaining, the short-term rally failed to generate any sort of breadth thrust that tends to bode well for forward returns over longer time frames.
At the same time, investors are growing hopeful that interest rate hikes from the Federal Reserve could be on hold following a much weaker than expected payrolls report for the month of July.
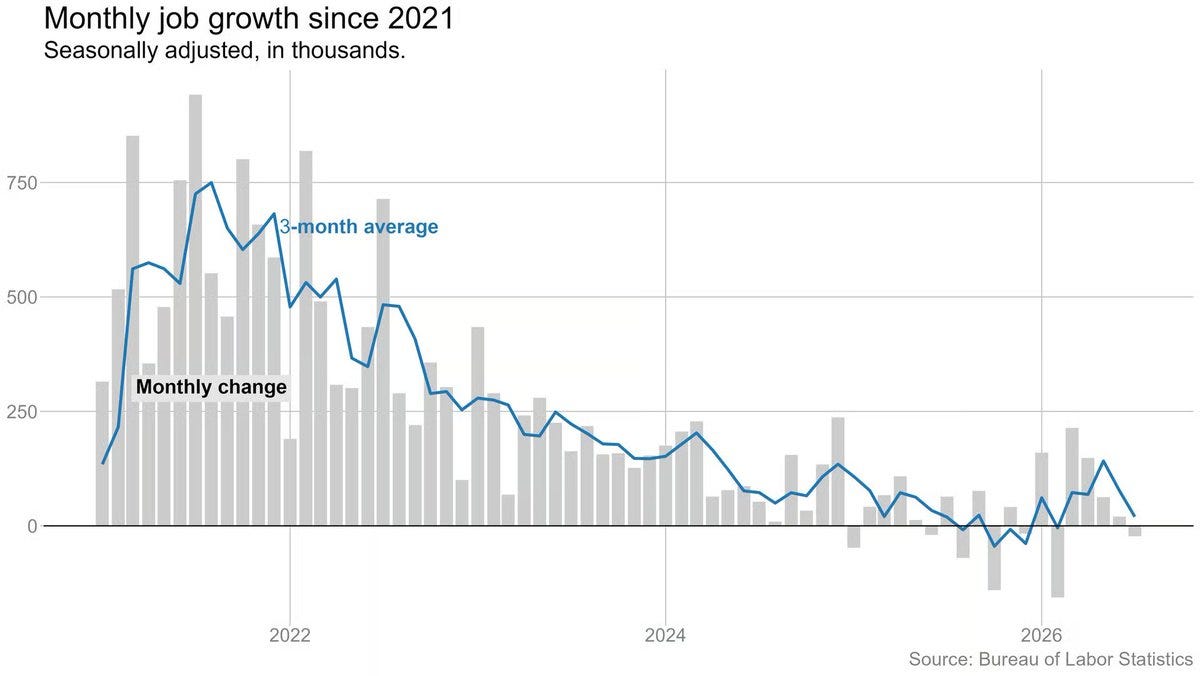
The jobs report showed a loss of 23,000 jobs during July compared to expectations for a gain of 80,000. The prior two months were also revised lower by 103,000 jobs, which brings the three month average job creation to just 20,000 (chart below).
A week ago, market-implied odds strongly favored a rate hike at the Fed’s next meeting in September. Those odds now slightly favor the Fed keeping rates on hold, with just one hike before pausing well into next year.
But not all economic data is showing deceleration. A pair of reports on the manufacturing and services sector of the economy shows accelerating activity, with one indicator suggesting a positive outlook as well.
This week, let’s look at the strong short-term rally in the major indexes and if participation in the trend has been strong enough to trigger breadth thrusts. We’ll also look at a key sector behind the rally, and if the broader economy is really as weak as July payrolls suggests.
The Chart Report
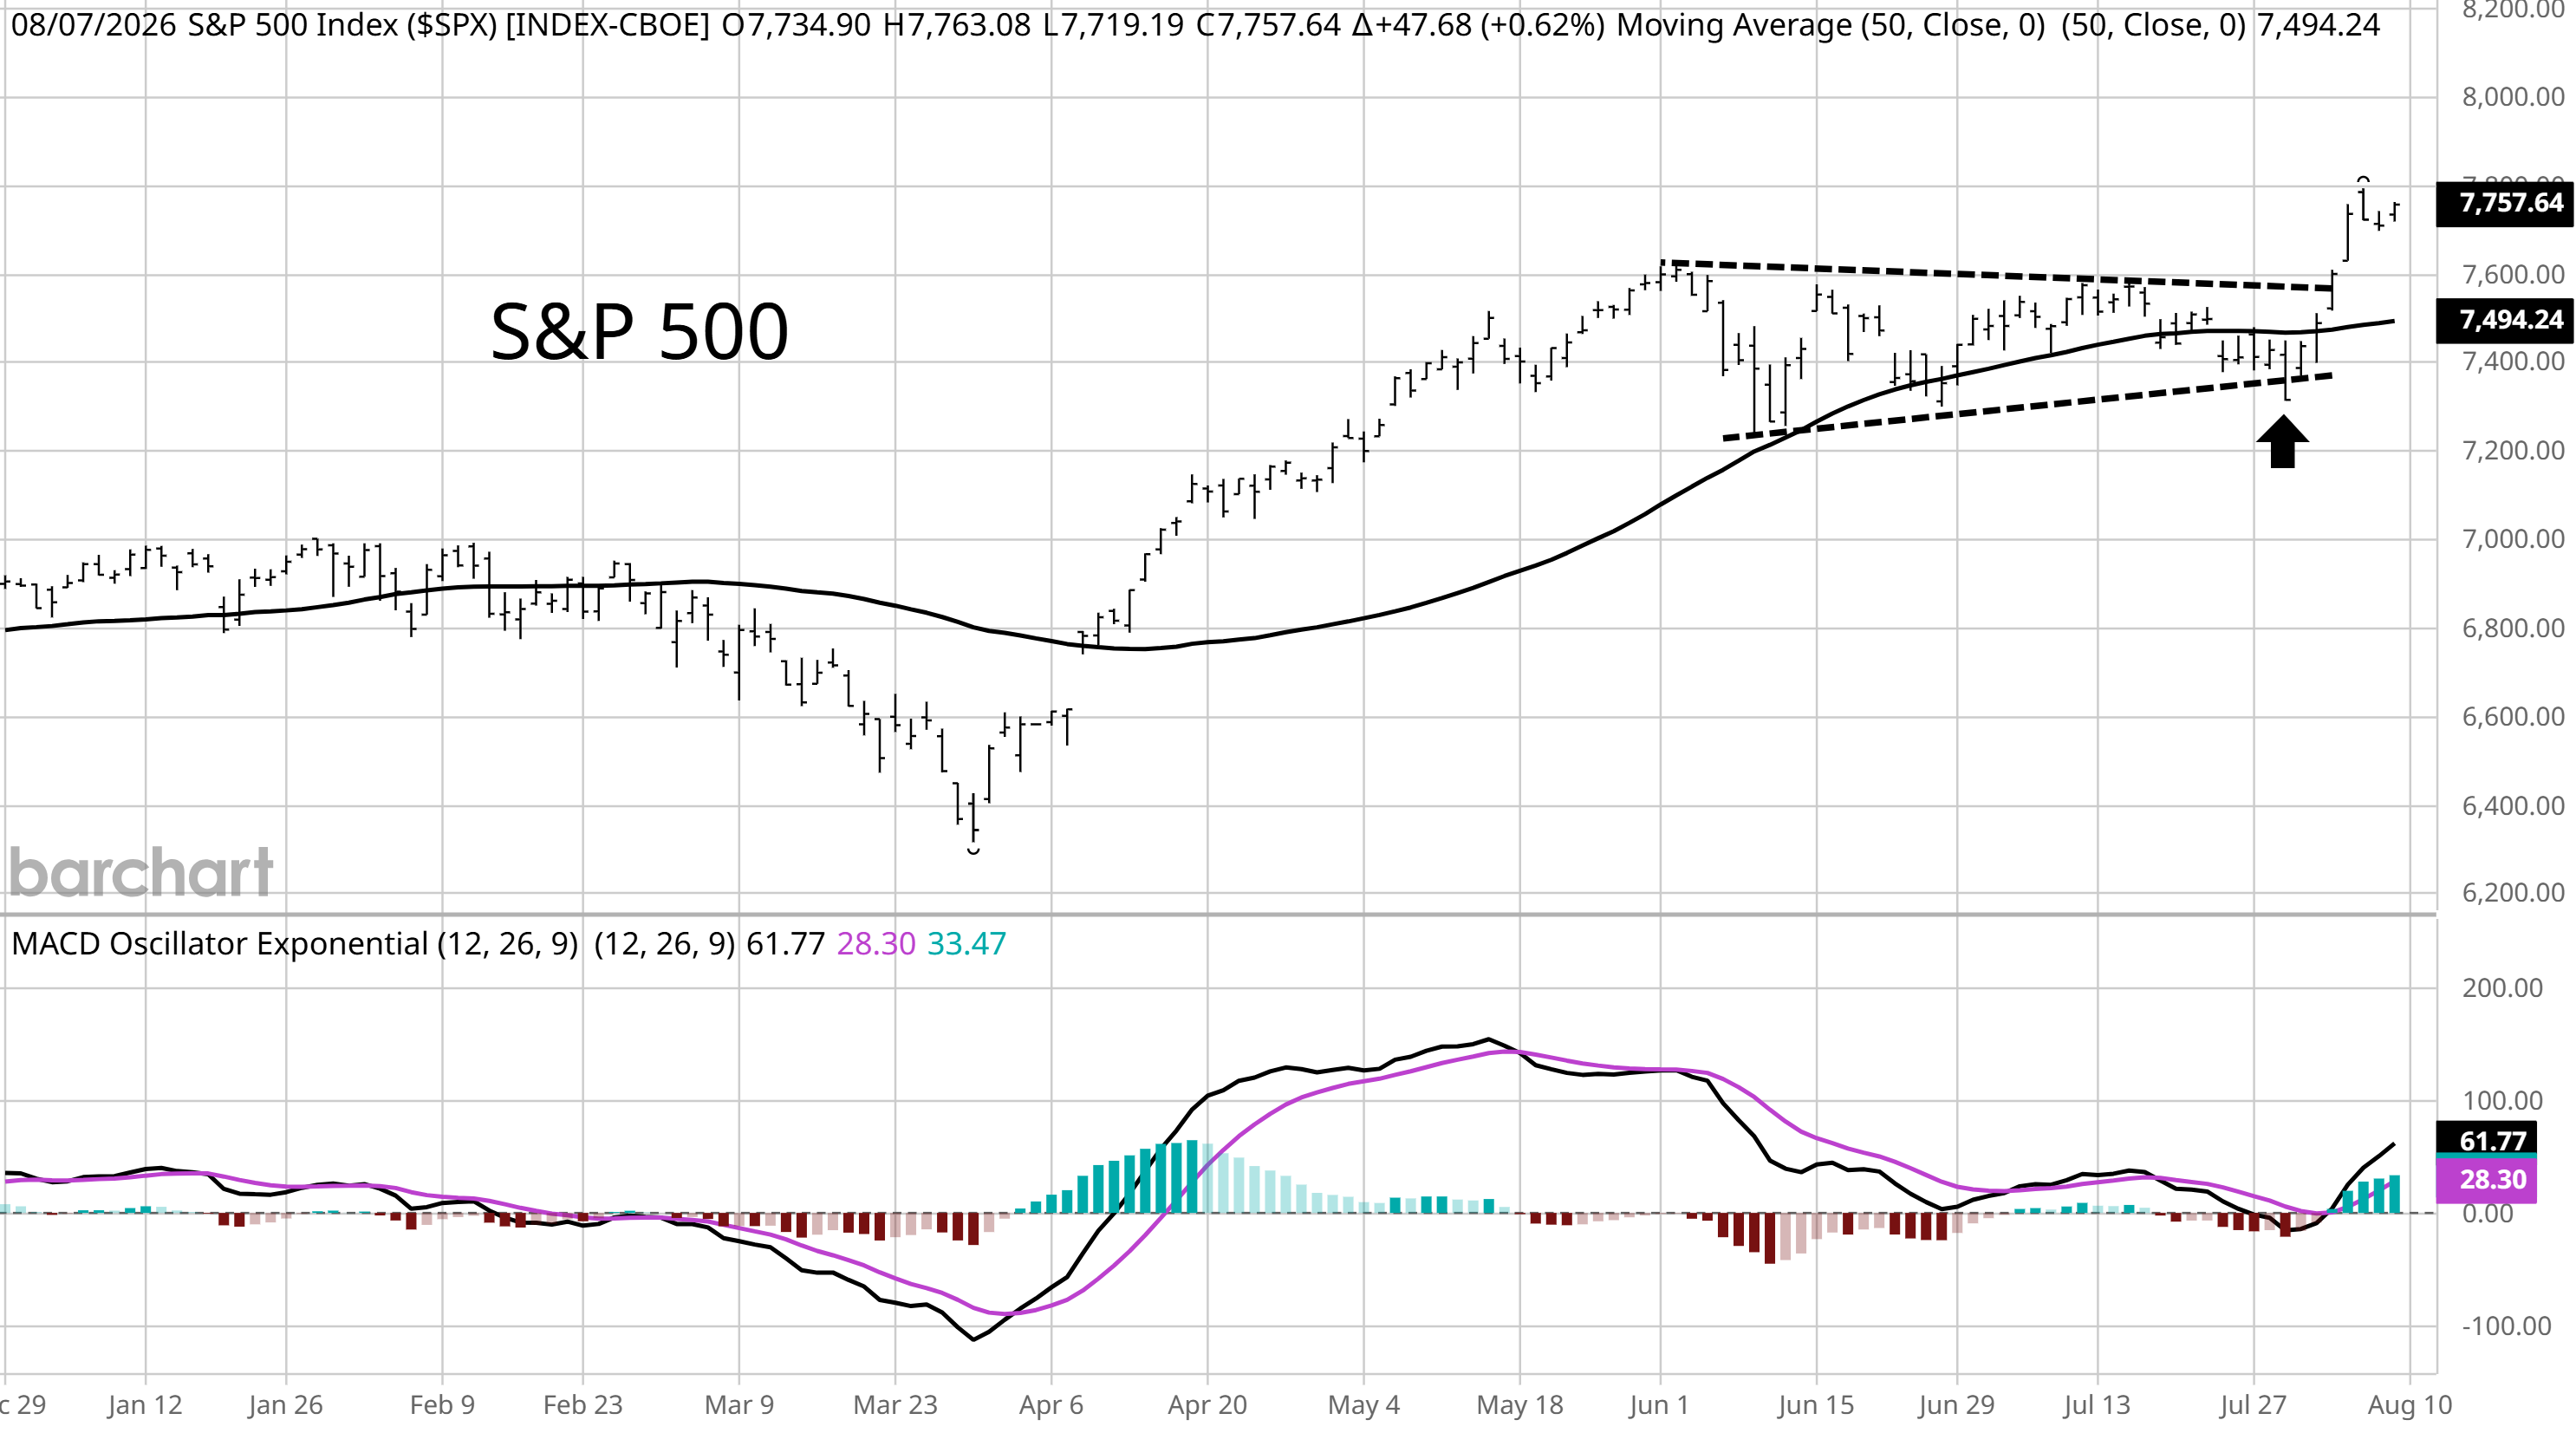
A failed breakdown sparked a massive move in the S&P 500. The chart below shows a symmetrical triangle pattern for the S&P, which had been forming since the last peak in the index in early June. Narrowing price action are shown with the dashed lines, where a symmetrical triangle often resolves in the direction preceding the pattern. But a one day breakdown looked like the S&P was losing support, which was strongly reversed in the next trading session. Failed moves can often see a strong reversal in the opposite direction, with the index subsequently rallying 5.7% in just four days to jump to new record highs.
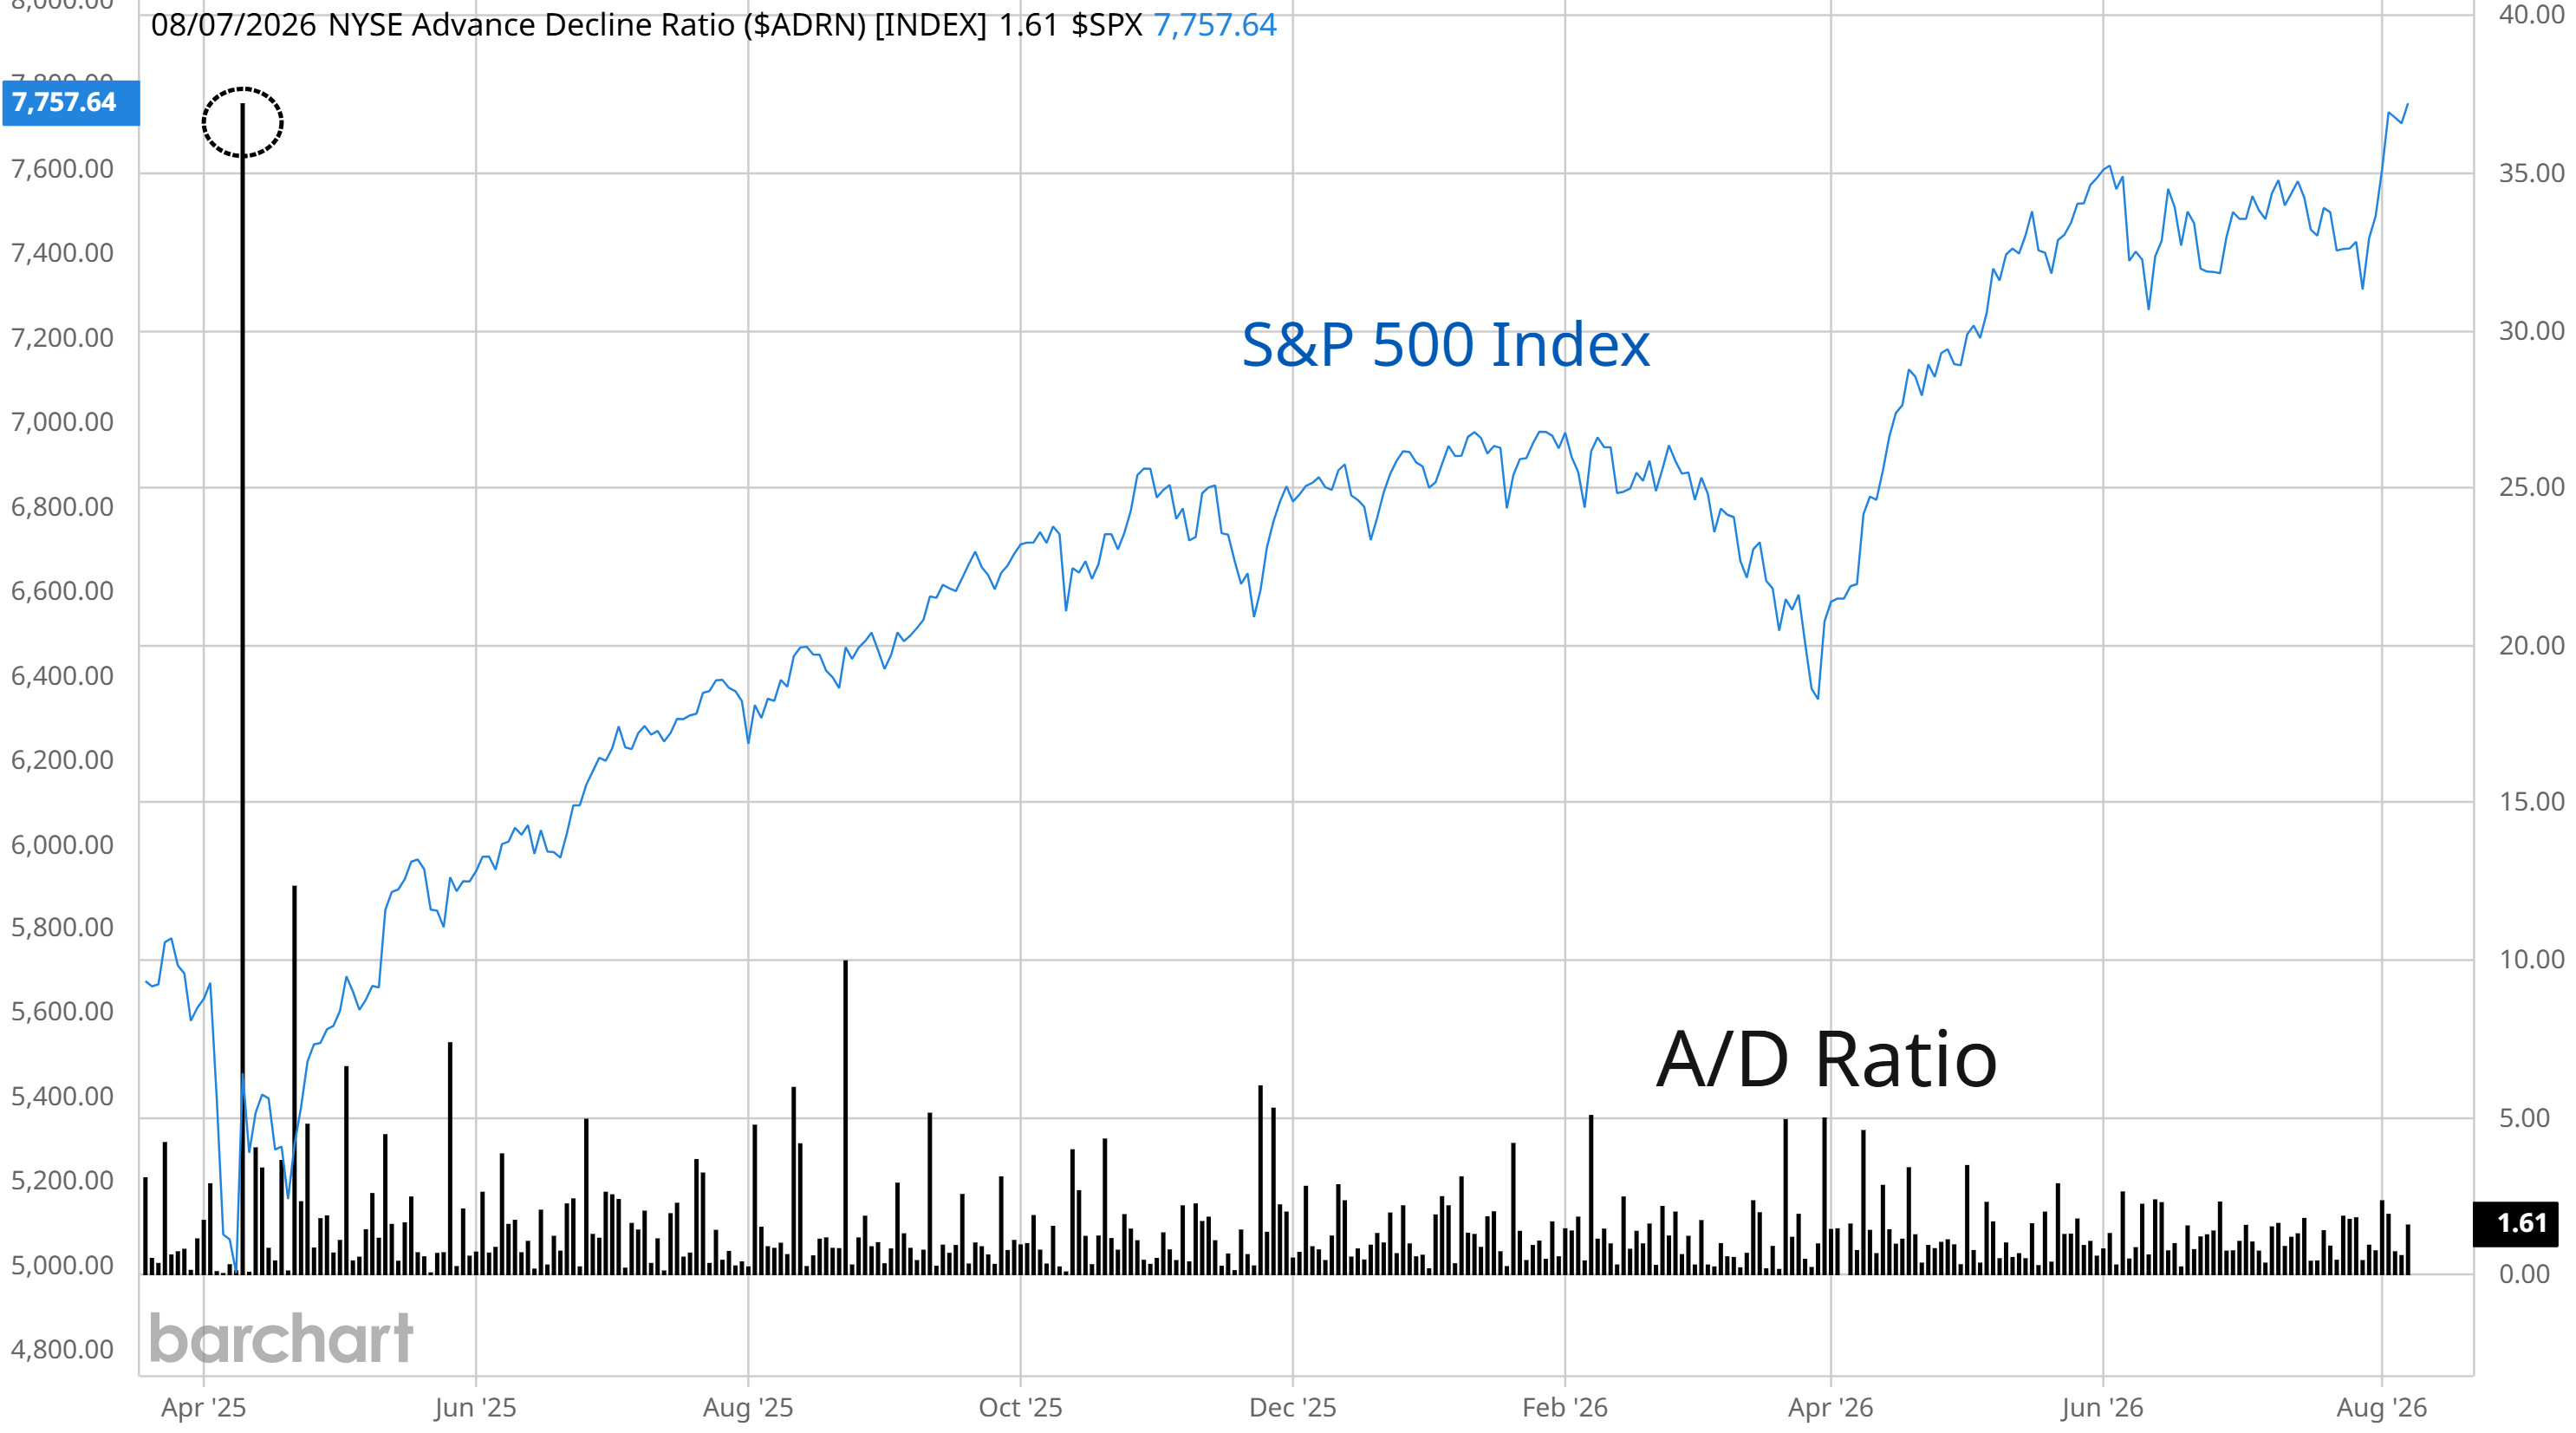
Any time the major indexes see a short-term burst to the upside, you should be on the lookout for breadth thrusts that can lead to strong forward returns over longer periods. Thrusts indicate the presence of institutional investors which are needed to sustain an advance. But breadth around the recent gains in the S&P 500 has been lackluster at best. The chart below shows the ratio of advancing stocks to declining issues on the NYSE. The best reading for the A/D ratio during the S&P’s strong stretch was 2.4, which you can see is nothing special and nowhere near the best reading of the year. I kept the A/D thrust from last April in the chart for context.
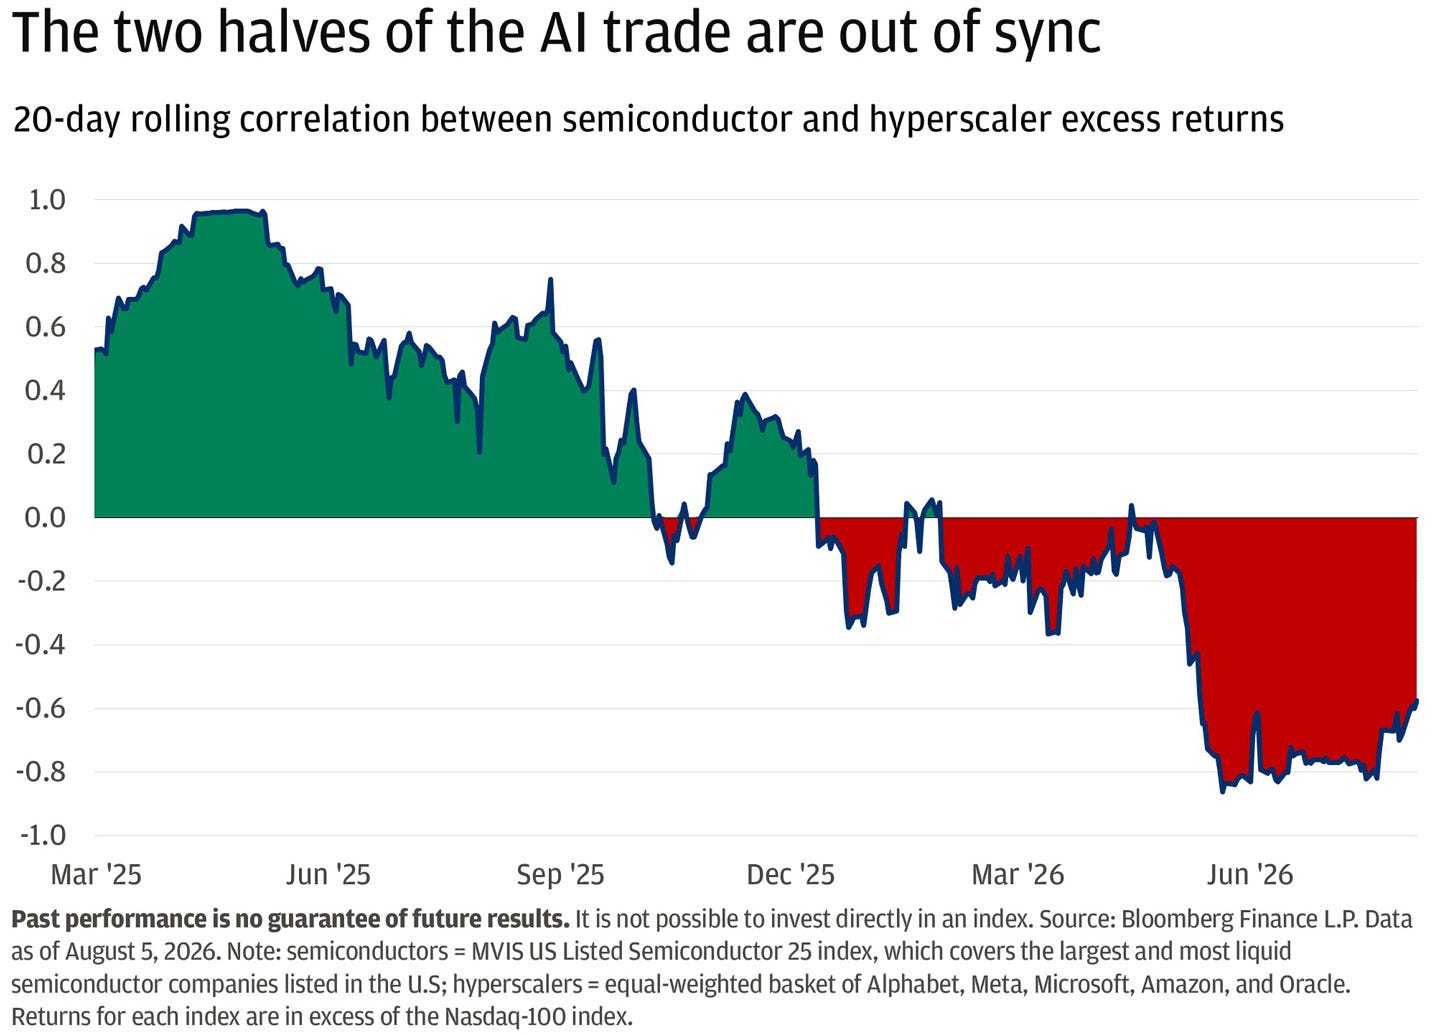
The lack any breadth thrusts during the recent gains points to a rally driven by beaten up AI infrastructure stocks. Companies leveraged to AI capex, particularly semiconductors, saw massive gains into late June driven by optimism over earnings by an ever increasing capex spend by hyperscalers. Optimism quickly soured and sharp drawdowns were seen across the sector, which has seen a mean-reverting rally from a deeply oversold condition to start the month. The AI trade has become very bifurcated between chip stocks and hyperscalers. The chart below shows a 20-day rolling correlation between hyperscaler and semiconductor excess returns, which used to be strongly correlated. But that started changing especially during 2026, where the correlation has now become strongly negative.
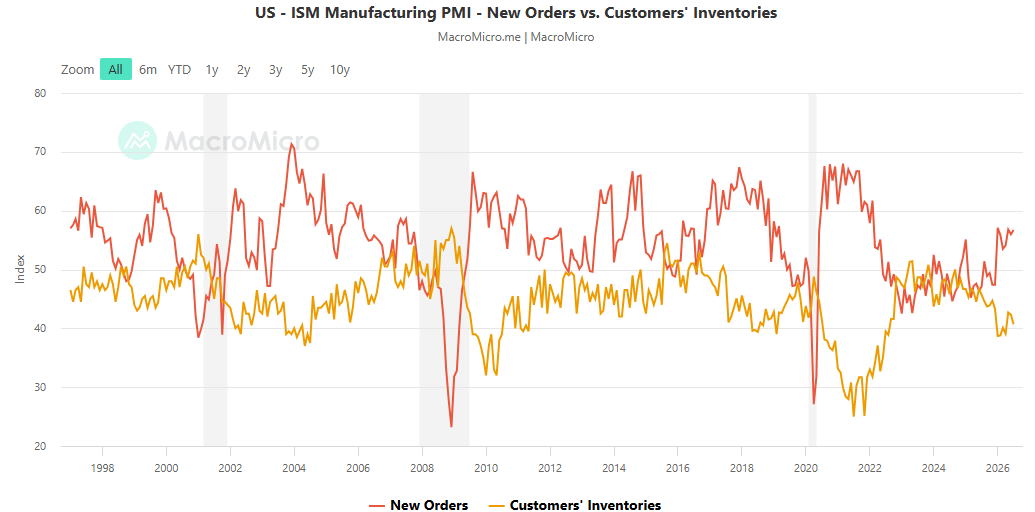
While concerns over the underlying health of the economy are ramping higher following the disappointing July payrolls report, weakening data isn’t being seen in other key reports. For instance, initial jobless claims were reported at just 199,000 last week, which has remained near historically low levels. Other data released last week from the ISM shows both the manufacturing and service sector of the economy holding up just fine, while the leading new orders components in each report remains in expansionary territory. In the ISM’s manufacturing report, the spread between new orders and inventories is widening (chart below), which tends to be a good sign for future economic activity.
Heard in the Hub
The Traders Hub features live trade alerts, market update videos, and other educational content for members.
Here’s a quick recap of recent alerts, market updates, and educational posts:
A pattern to tip the S&P 500’s next move.
How we’re surviving the momentum massacre.
Why return dispersion is signaling a major transition.
How to use relative strength to find new momentum leaders.
Breaking down two chart patterns emerging in new trade ideas.
You can follow everything we’re trading and tracking by becoming a member of the Traders Hub.
By becoming a member, you will unlock all market updates and trade alerts reserved exclusively for members.
Trade Idea
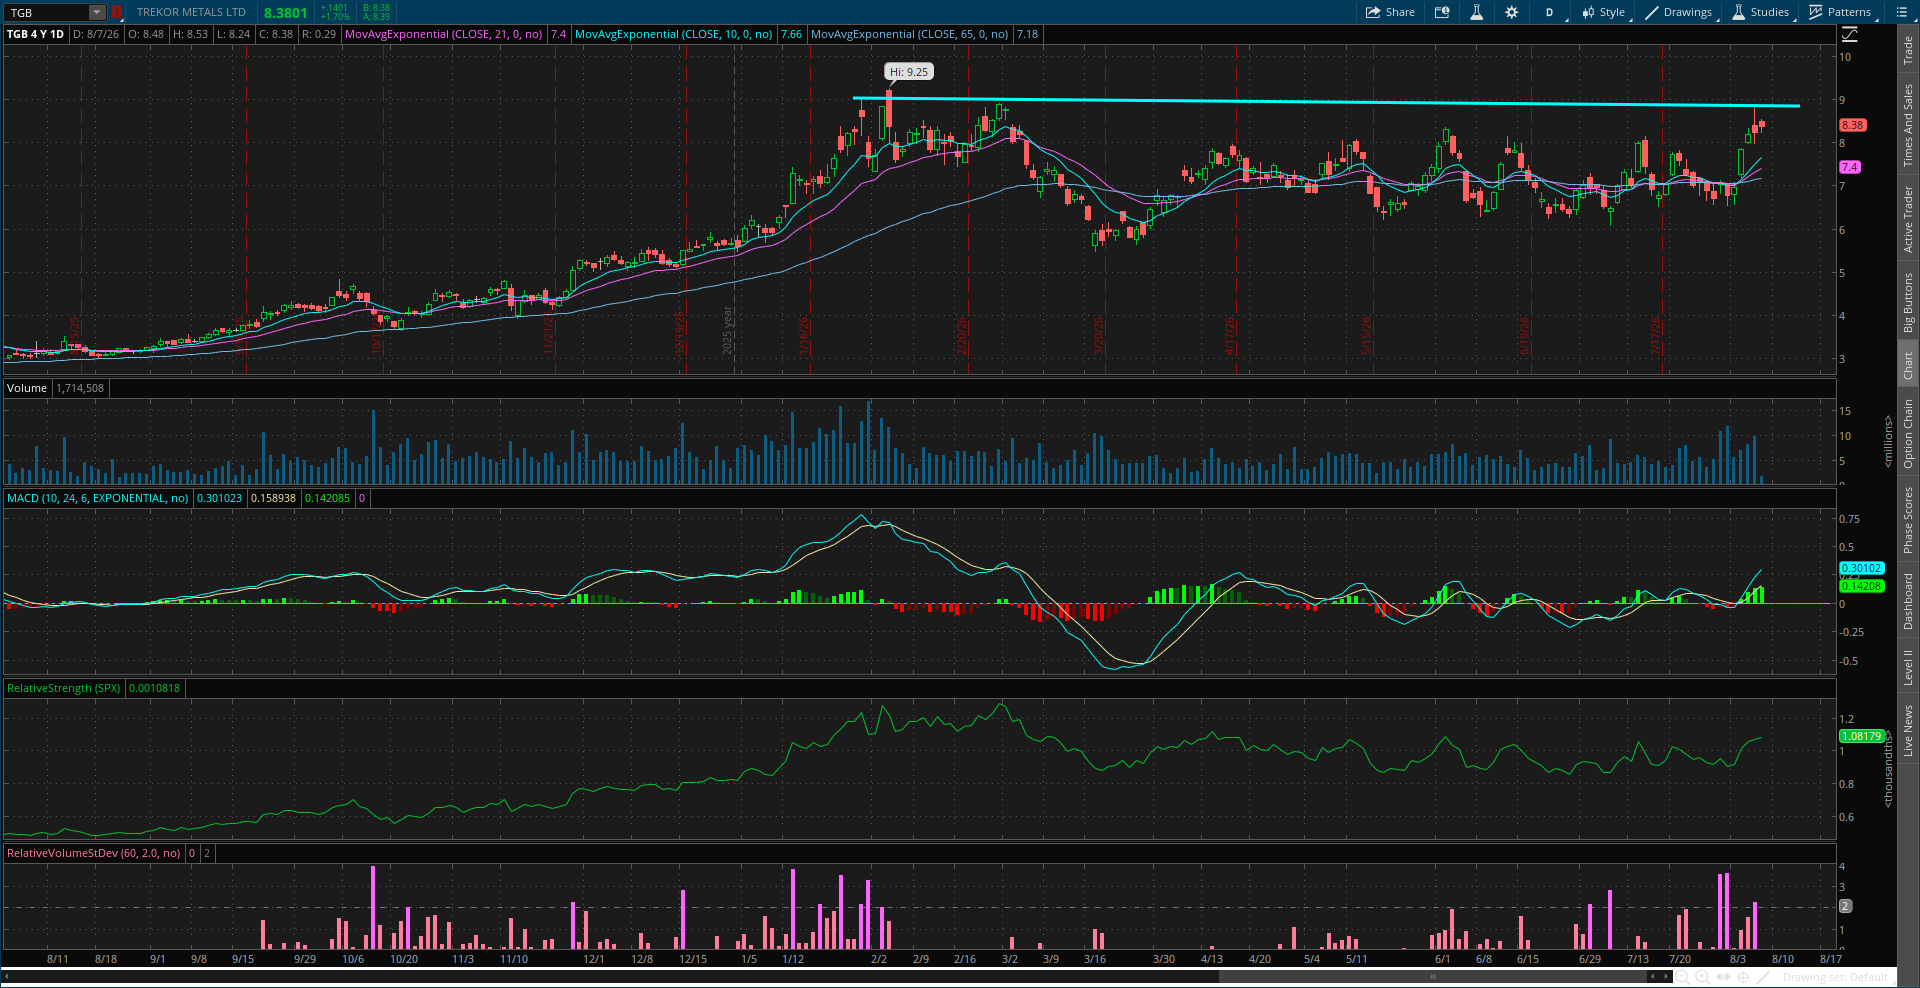
Trekor Metals (TGB)
The stock peaked near the $9 level back in February and now recently testing resistance. The setup needs one more smaller pullback off that level followed by a move over $9 with confirmation by the relative strength line.
Key Upcoming Data
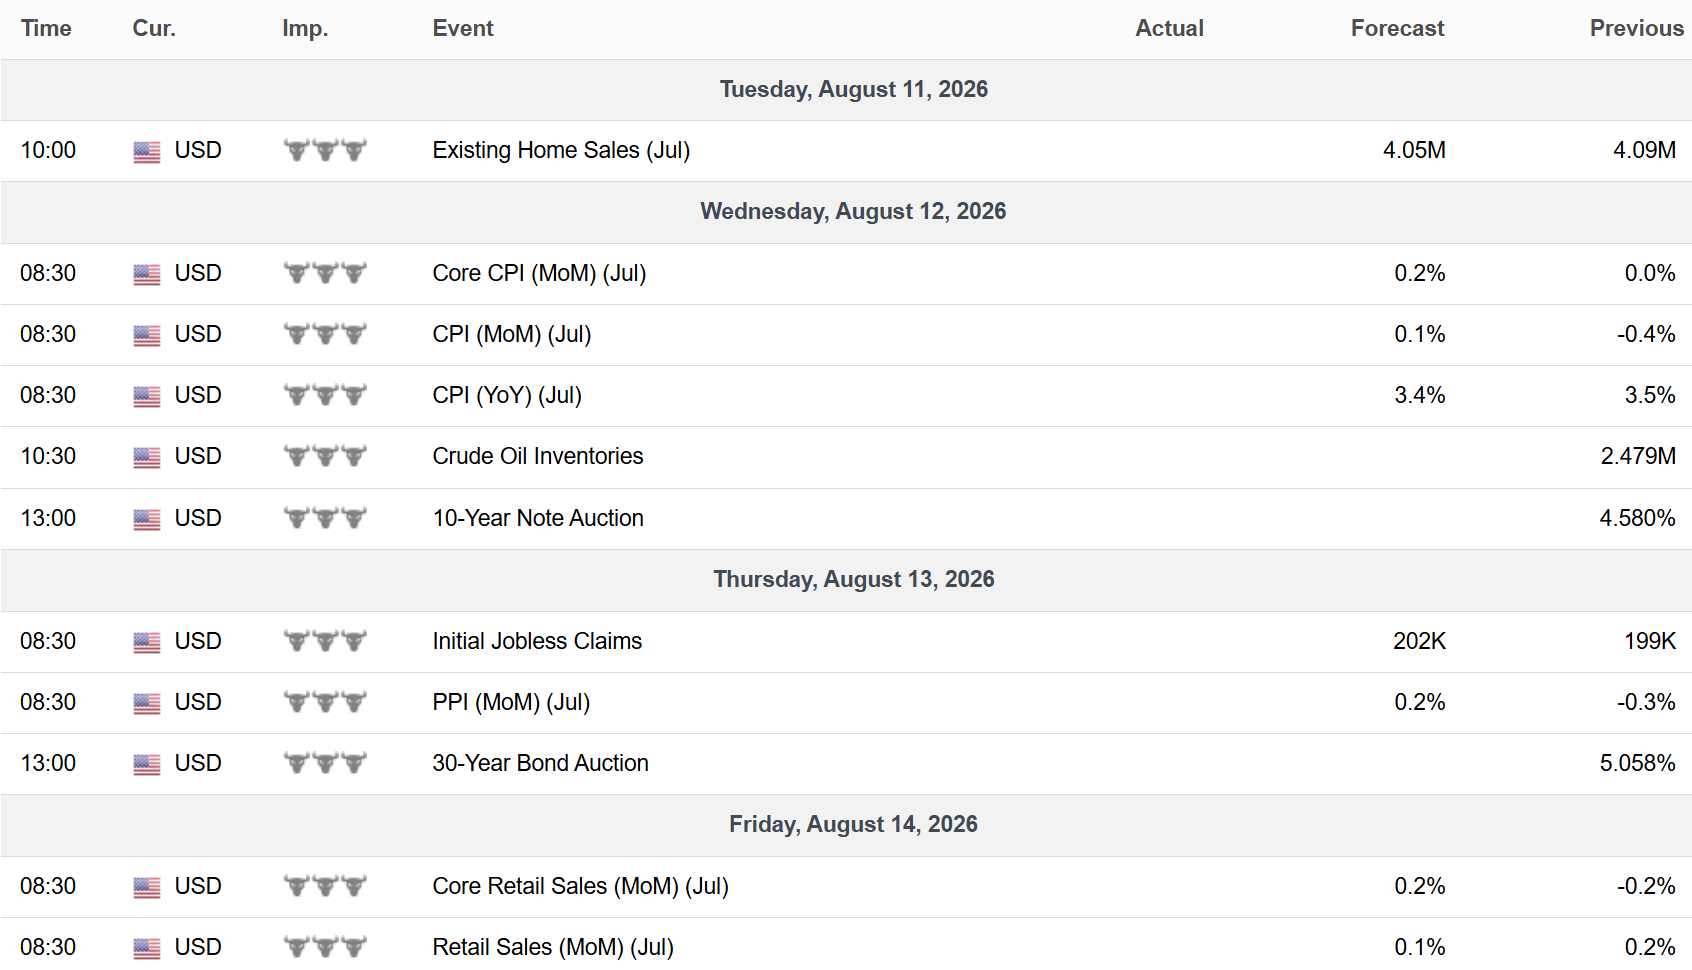
Economic Reports
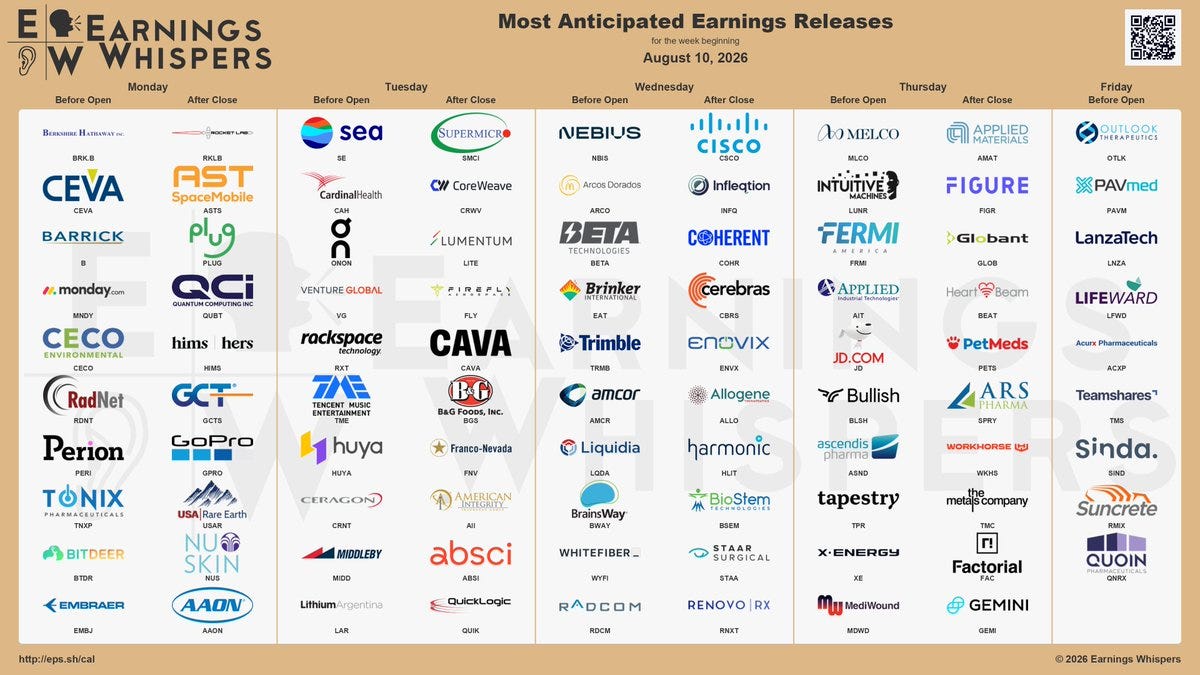
Earnings Reports
I hope you’ve enjoyed The Market Mosaic, and please share this report with your family, friends, coworkers…or anyone that would benefit from an objective look at the stock market.
Become a member of the Traders Hub to unlock access to:
✅Model Portfolio
✅Members Only Chat
✅Trade Ideas & Live Alerts
✅Mosaic Vision Market Updates + More
Our model portfolio is built using a “core and explore” approach, including a Stock Trading Portfolio and ETF Investment Portfolio.
Come join us over at the Hub as we seek to capitalize on stocks and ETFs that are breaking out!
And if you have any questions or feedback, feel free to shoot me an email at mosaicassetco@gmail.com
Disclaimer: these are not recommendations and just my thoughts and opinions…do your own due diligence! I may hold a position in the securities mentioned in this report.