The Market Mosaic 8.6.23
Is the stock market rally over?
Welcome back to The Market Mosaic, where I gauge the stock market’s next move by looking at macro, technicals, and market internals. I’ll also highlight trade ideas using this analysis.
If you find this content helpful please hit that “like” button, share this post, and become a subscriber to this always free report if you haven’t already done so!
And be sure to check out Mosaic Chart Alerts. It’s a midweek update covering chart setups among long and short trade ideas in the stock market, along with levels I’m watching.
Now for this week’s issue…
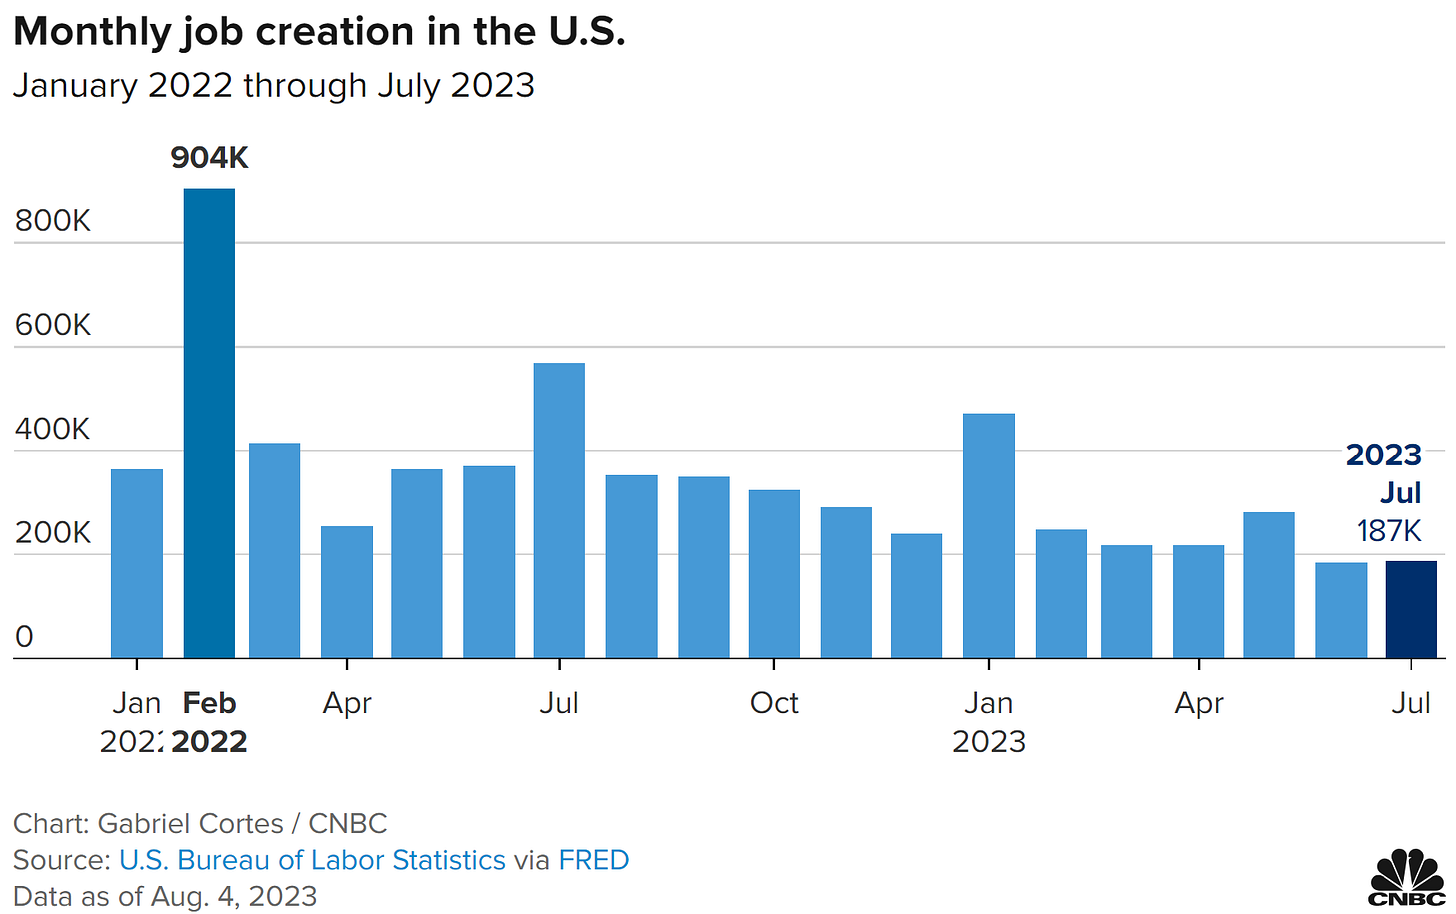
When the July jobs report came in weaker than expected, the initial response from investors was to push stocks higher. Nonfarm payrolls added 187,000 jobs last month, which fell short relative to economist expectations and continues a moderating pace of gains.
Investors took that as a sign the Federal Reserve’s rate hiking cycle is having the intended impact of slowing the economy and thus inflation. That lends more weight to the view that the Fed is about finished with this tightening cycle, which explains the jump in stocks on Friday after the labor market data.
But then came the late afternoon rug pull. At one point in the trading session, the S&P 500 was up nearly 1% on the day, but then reversed sharply to finish the session lower (intraday chart below).
Perhaps traders realized that evidence of a slowing economy is actually a bad thing, especially in the context of the corporate earnings outlook. The decline was the fourth consecutive day of losses for the S&P 500, which ultimately finished the week over 2% lower.
That has investors wondering if this is the start of a larger degree pullback, or just a pause in the uptrend. Here’s what I’m watching to answer that question.
Stocks Due for a Pause
While it’s tempting to blame headlines around the jobs report and U.S. credit rating downgrade for the drop, stocks are simply due for a pullback.
Investor sentiment reached bullish extremes, breadth metrics are overbought, momentum is extended, and seasonality is entering a weak period through late August based on 20-year historical trends for the S&P 500 (chart below).
But with the S&P 500 erasing nearly all of 2022’s bear market decline and the transition across the stock market to a regime of persisting net new 52-week highs, my expectation is that we’re simply due for a pause in the uptrend.
So now’s the time to monitor for oversold conditions and signs that the rally is ready to resume. While it’s useful to track sentiment and seasonals, breadth will provide the most reliable signal in my opinion.
Along those lines, I’m watching three metrics in particular to track the presence of oversold conditions in stocks. The first is with the percent of stocks trading above their 20-day moving average (MA). This metric also flashed a warning signal at the end of July, when the S&P 500 made a higher high but wasn’t confirmed as you can below.
Now’s the time to watch for an oversold reading. During a bull market phase, this metric doesn’t pull back as far as what you saw during the bear market. I’m watching for this indicator to hit the 30-40% range to signal an oversold condition.
I’m also tracking the NYSE McClellan Oscillator. This gauge looks at the number of advancing versus declining issues on the NYSE over a trailing period. I monitor for extreme readings and divergences at those extremes. You can see in the chart below that the oscillator is approaching oversold levels, so I’m now watching for a positive divergence relative to the S&P 500.
Finally, the McClellan Summation Index is the cumulative sum of the oscillator values discussed above. Applying a simple 10-day moving average is a useful way to generate signals and monitor the trend. You can see the most recent buy signal created at the start of June when the index crossed above the 10-day MA.
The recent negative cross provides confirmation of the pressure currently facing stocks. Now I will wait for another positive crossover signal, which will likely be the last of the three metrics discussed in this section to generate a bullish signal.
I will read and react to conditions as they unfold, but for now my expectation is that stocks are simply consolidating gains in the bull trend.
Now What…
If the stock market is about to enter a larger degree decline, it will be due to concerns over slowing economic growth and the impact to the corporate earnings outlook.
But it’s hard to put too much weight into one jobs report and declare a looming recession. Trailing measures of activity point to a growing economy, and I’ve recently outlined the massive amount of stimulus from various fiscal spending packages that’s leading to a manufacturing boom.
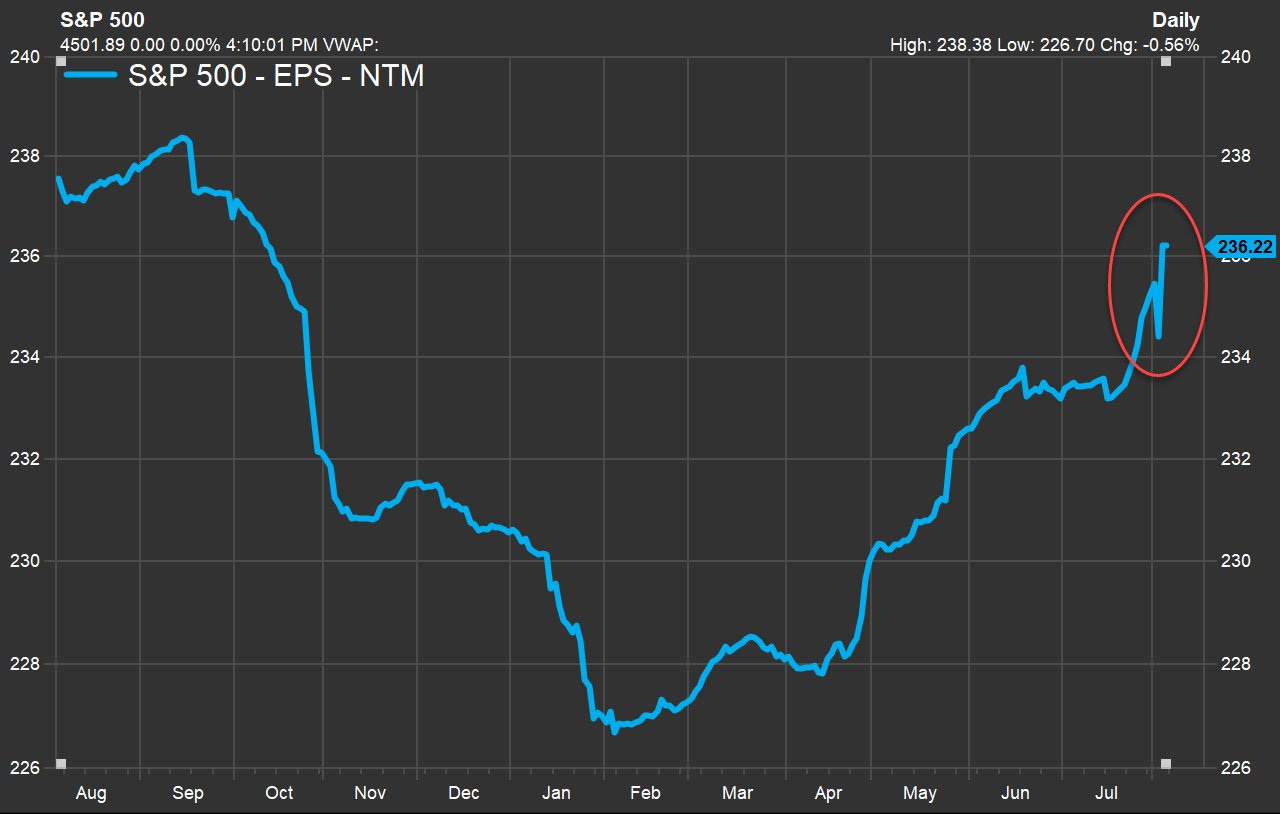
And lost in the various economic headlines last week was an improvement in forward earnings estimates. This is what I’m watching most closely as we work our way through earnings season, which is now 84% complete for the S&P 500.
No one has better insight into business conditions than corporate management teams, and sell-side analysts will adjust their earnings estimates based on the guidance coming from corporate executives as part of earnings reports.
And the good news is that S&P 500 earnings estimate for the next 12 months has seen an increase during the second quarter reporting season as you can see below from FactSet.
Stocks need a breather as I highlighted above. But for now, I will view any pullback as a pause in the new bull market until proven otherwise.
That also means it’s a great time to start compiling an updated watchlist of new breakout setups. This is when I turn to weekly charts to get a better view of how new basing patterns are forming (and tune out the noise of daily charts).
One weekly base that I’m monitoring is with TNK. The stock is leveraged to the commodity trade, and is turning higher recently as part of a basing pattern going back to February. With the MACD and relative strength line in a good position, I’m watching for a move over $47.
That’s all for this week. With major earnings reports in the rearview, focus will turn back to the economic picture and next week’s CPI report on consumer inflation. But against the investor reaction, I’ll be watching breadth metrics for signs of oversold conditions in the stock market.
I hope you’ve enjoyed The Market Mosaic, and please share this report with your family, friends, coworkers…or anyone that would benefit from an objective look at the stock market.
And make sure you never miss an edition by subscribing here:
For updated charts, market analysis, and other trade ideas, give me a follow on Twitter: @mosaicassetco
And if you have any questions or feedback, feel free to shoot me an email at mosaicassetco@gmail.com
Disclaimer: these are not recommendations and just my thoughts and opinions…do your own due diligence! I may hold a position in the securities mentioned in this report.


