
The Market Mosaic 8.3.25
S&P 500: Rising stagflation concerns.

👋Welcome back to The Market Mosaic, where I gauge the stock market’s next move by looking at macro, technicals, and market internals. I’ll also highlight trade ideas using this analysis.
If you find this report helpful please hit that “like” button, share this post, and become a subscriber if you haven’t already done so!
🚨And be sure to check out Mosaic Traders Hub. It’s a members-only platform to alert trade ideas, track a model portfolio of open positions, and further analyze the message coming from the capital markets (👇be sure to check out our special offer below).
Now for this week’s issue…
A double-dose of bad news arrived for investors and threw the interest rate outlook into question as stagflation concerns emerge.
First came a hotter than expected inflation report with a metric closely followed by the Federal Reserve. The personal consumption expenditures (PCE) price index rose by 2.6% in June, which is up from May’s 2.4% pace. The core figure that strips out food and energy prices increased by 2.8% and was higher than expected.
Headline and core PCE are both running well above the Fed’s 2% target. And evidence shows more recent reports are inflecting upwards. The chart below shows the core PCE annualized over three-, six-, and 12-month time frames. The rate of change is starting to pickup following the disinflation trend since mid-2022.

Several inflation gauges are starting to move higher, which is causing alarm among the Federal Reverse. The Fed elected to keep interest rates steady at their meeting last week, and Fed Chair Jerome Powell made it clear the focus is on inflation.
Powell specifically stated that “inflation is further from our goal than employment.” But then came a dismal jobs report with nonfarm payrolls for the month of July. Payrolls increased by 73,000 which was below estimates for 110,000.
But it was negative revisions to the prior two months that really stood out, with May and June collectively revised lower by 258,000 jobs and essentially wiped out gains seen during those months. That puts the three month payrolls average at 35,000, which is the weakest growth since the pandemic.
Higher inflation and a weakening labor market is conjuring up stagflation fears and throwing the outlook for interest rate cuts into question. After the Fed threw cold water on the chances for a September rate cut, odds now favor a cut as Treasury yields plunged following the jobs data.
This week, let’s look at the massive revision in payrolls data and unpack the move in short-term Treasury yields. We’ll also look at signs why you should expect a return of volatility to close out summer, and the key chart level that would tip more market downside ahead.
The Chart Report
Uncertainty caused by the tariffs and trade war have previously shown up in surveys covering consumer sentiment and business activity. But July’s lower-than-expected payrolls report and massive downward revisions to the prior two months of jobs data is fueling concerns that hard economic data is deteriorating as well. The chart below shows the initial release (purple line) of each monthly payrolls report going back two years along with the revised figure (blue line). While revisions are picking up recently, it continues an overall trend of downward revisions. If anything, recent labor market data likely reflects a stalled jobs market where low jobless claims points to a lack of firing and weakening payrolls shows a lack of hiring.

The outlook for interest rate cuts is being thrown into question as market’s digest inflation and labor market data. Following the Fed’s rate-setting meeting last week, Powell made it clear that the Fed is focusing on the inflation side of its mandate. That was followed by the higher than expected PCE inflation report. Evidence of accelerating inflation dashed hopes for a September rate cut, and odds shifted to showing just one quarter point cut by the Fed this year. But July’s payroll data delivered a scare, with market-implied odds now close to favoring three 0.25% cuts this year. The 2-year Treasury yield tends to lead changes in the fed funds rate, and had its largest daily drop in a year (chart below).

Stocks sold off sharply following the payrolls data, with the S&P 500 ending its streak of more than 60 consecutive days trading above its short-term 20-day moving average. But this is also the time that a rise in volatility arrives for the market based on seasonal trends. Looking back, July tends to be one of the best months of the year based on historic calendar seasonality, and this year was certainly no different. But no matter how you look at it, seasonality becomes a headwind over the next couple months. The chart below shows the S&P’s calendar month performance based on various lookback periods. Following strong historical returns in July, August and September tend to be the worst months for seasonality (table below).

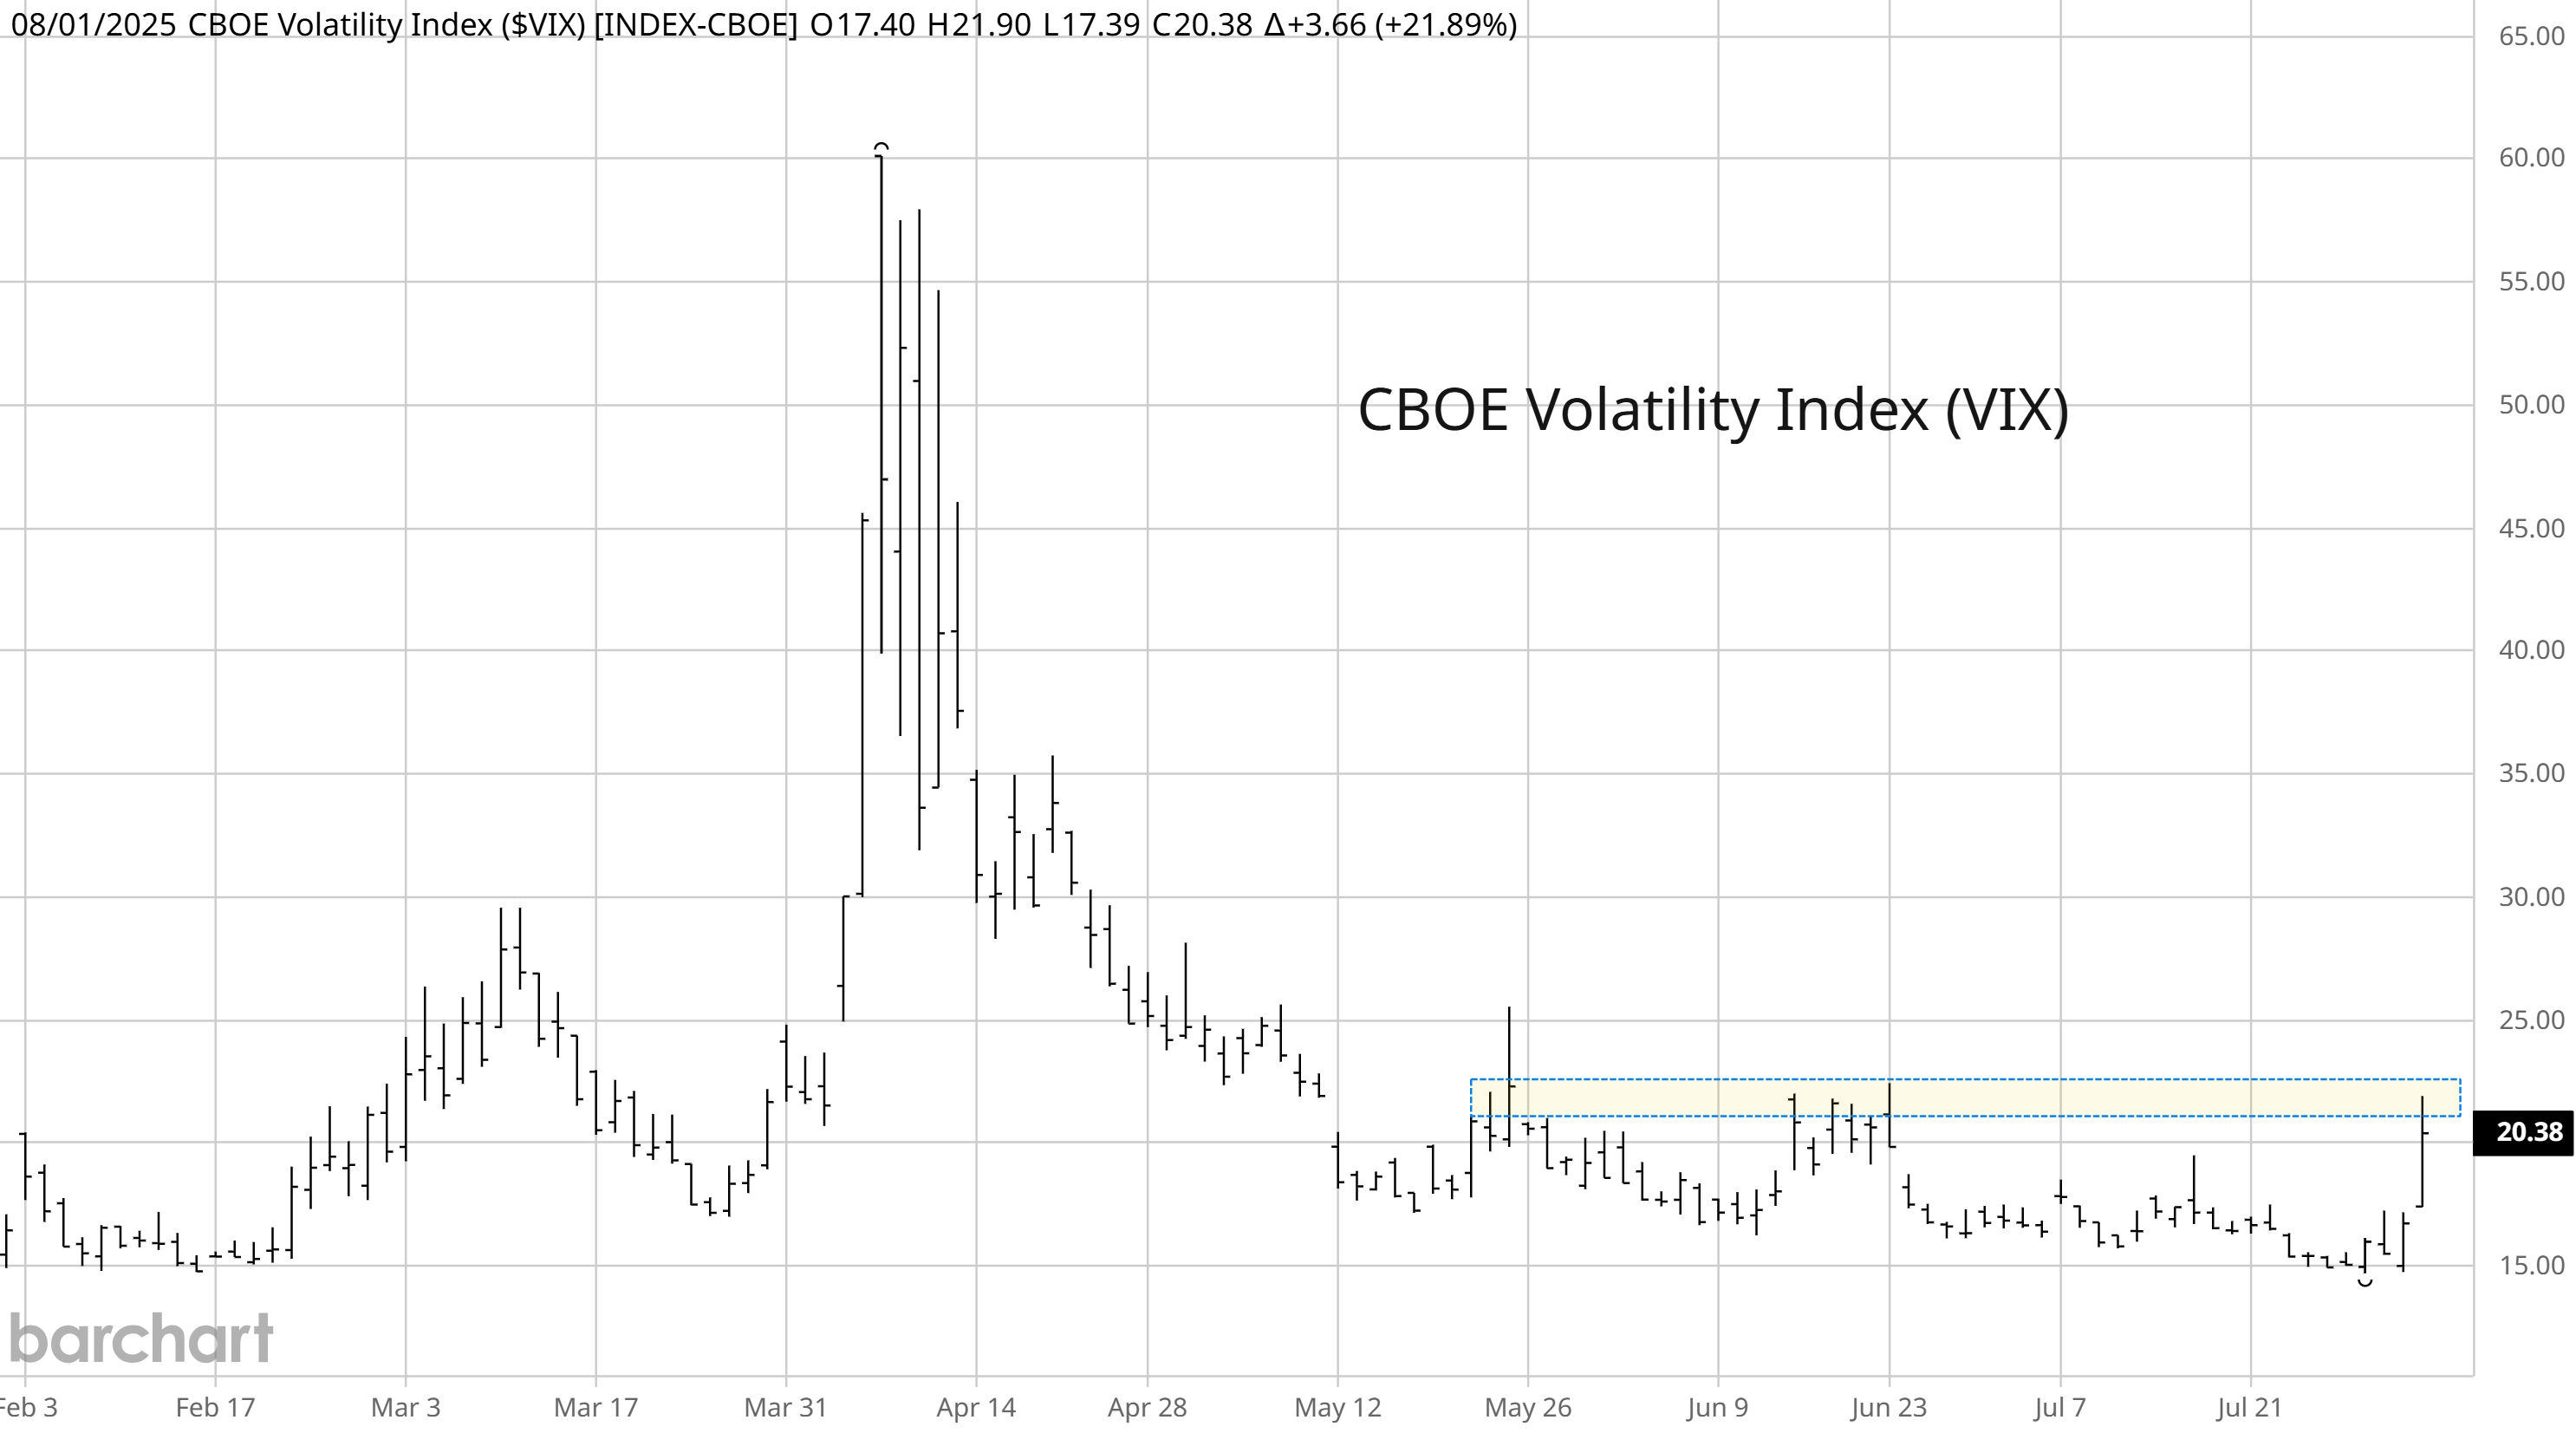
Volatility levels could also play a big roll in market direction over the near-term. Reflecting S&P 500 seasonals, the CBOE Volatility Index (VIX) tends to see median values bottom out in July and move higher over the next couple months. There’s another reason to track VIX, and that’s due to volatility-targeting strategies. Vol-targeting funds tend to reduce stock market exposure when volatility is rising and add exposure when volatility is falling. The decline in VIX off the April peak has been a source of fund flows into equities from vol-targeting funds. Since late May, the 22 level on VIX has held on any pullbacks. A jump above 22 could become a trigger level that leads more vol-targeting strategies to reduce equity exposure and drive further downside.
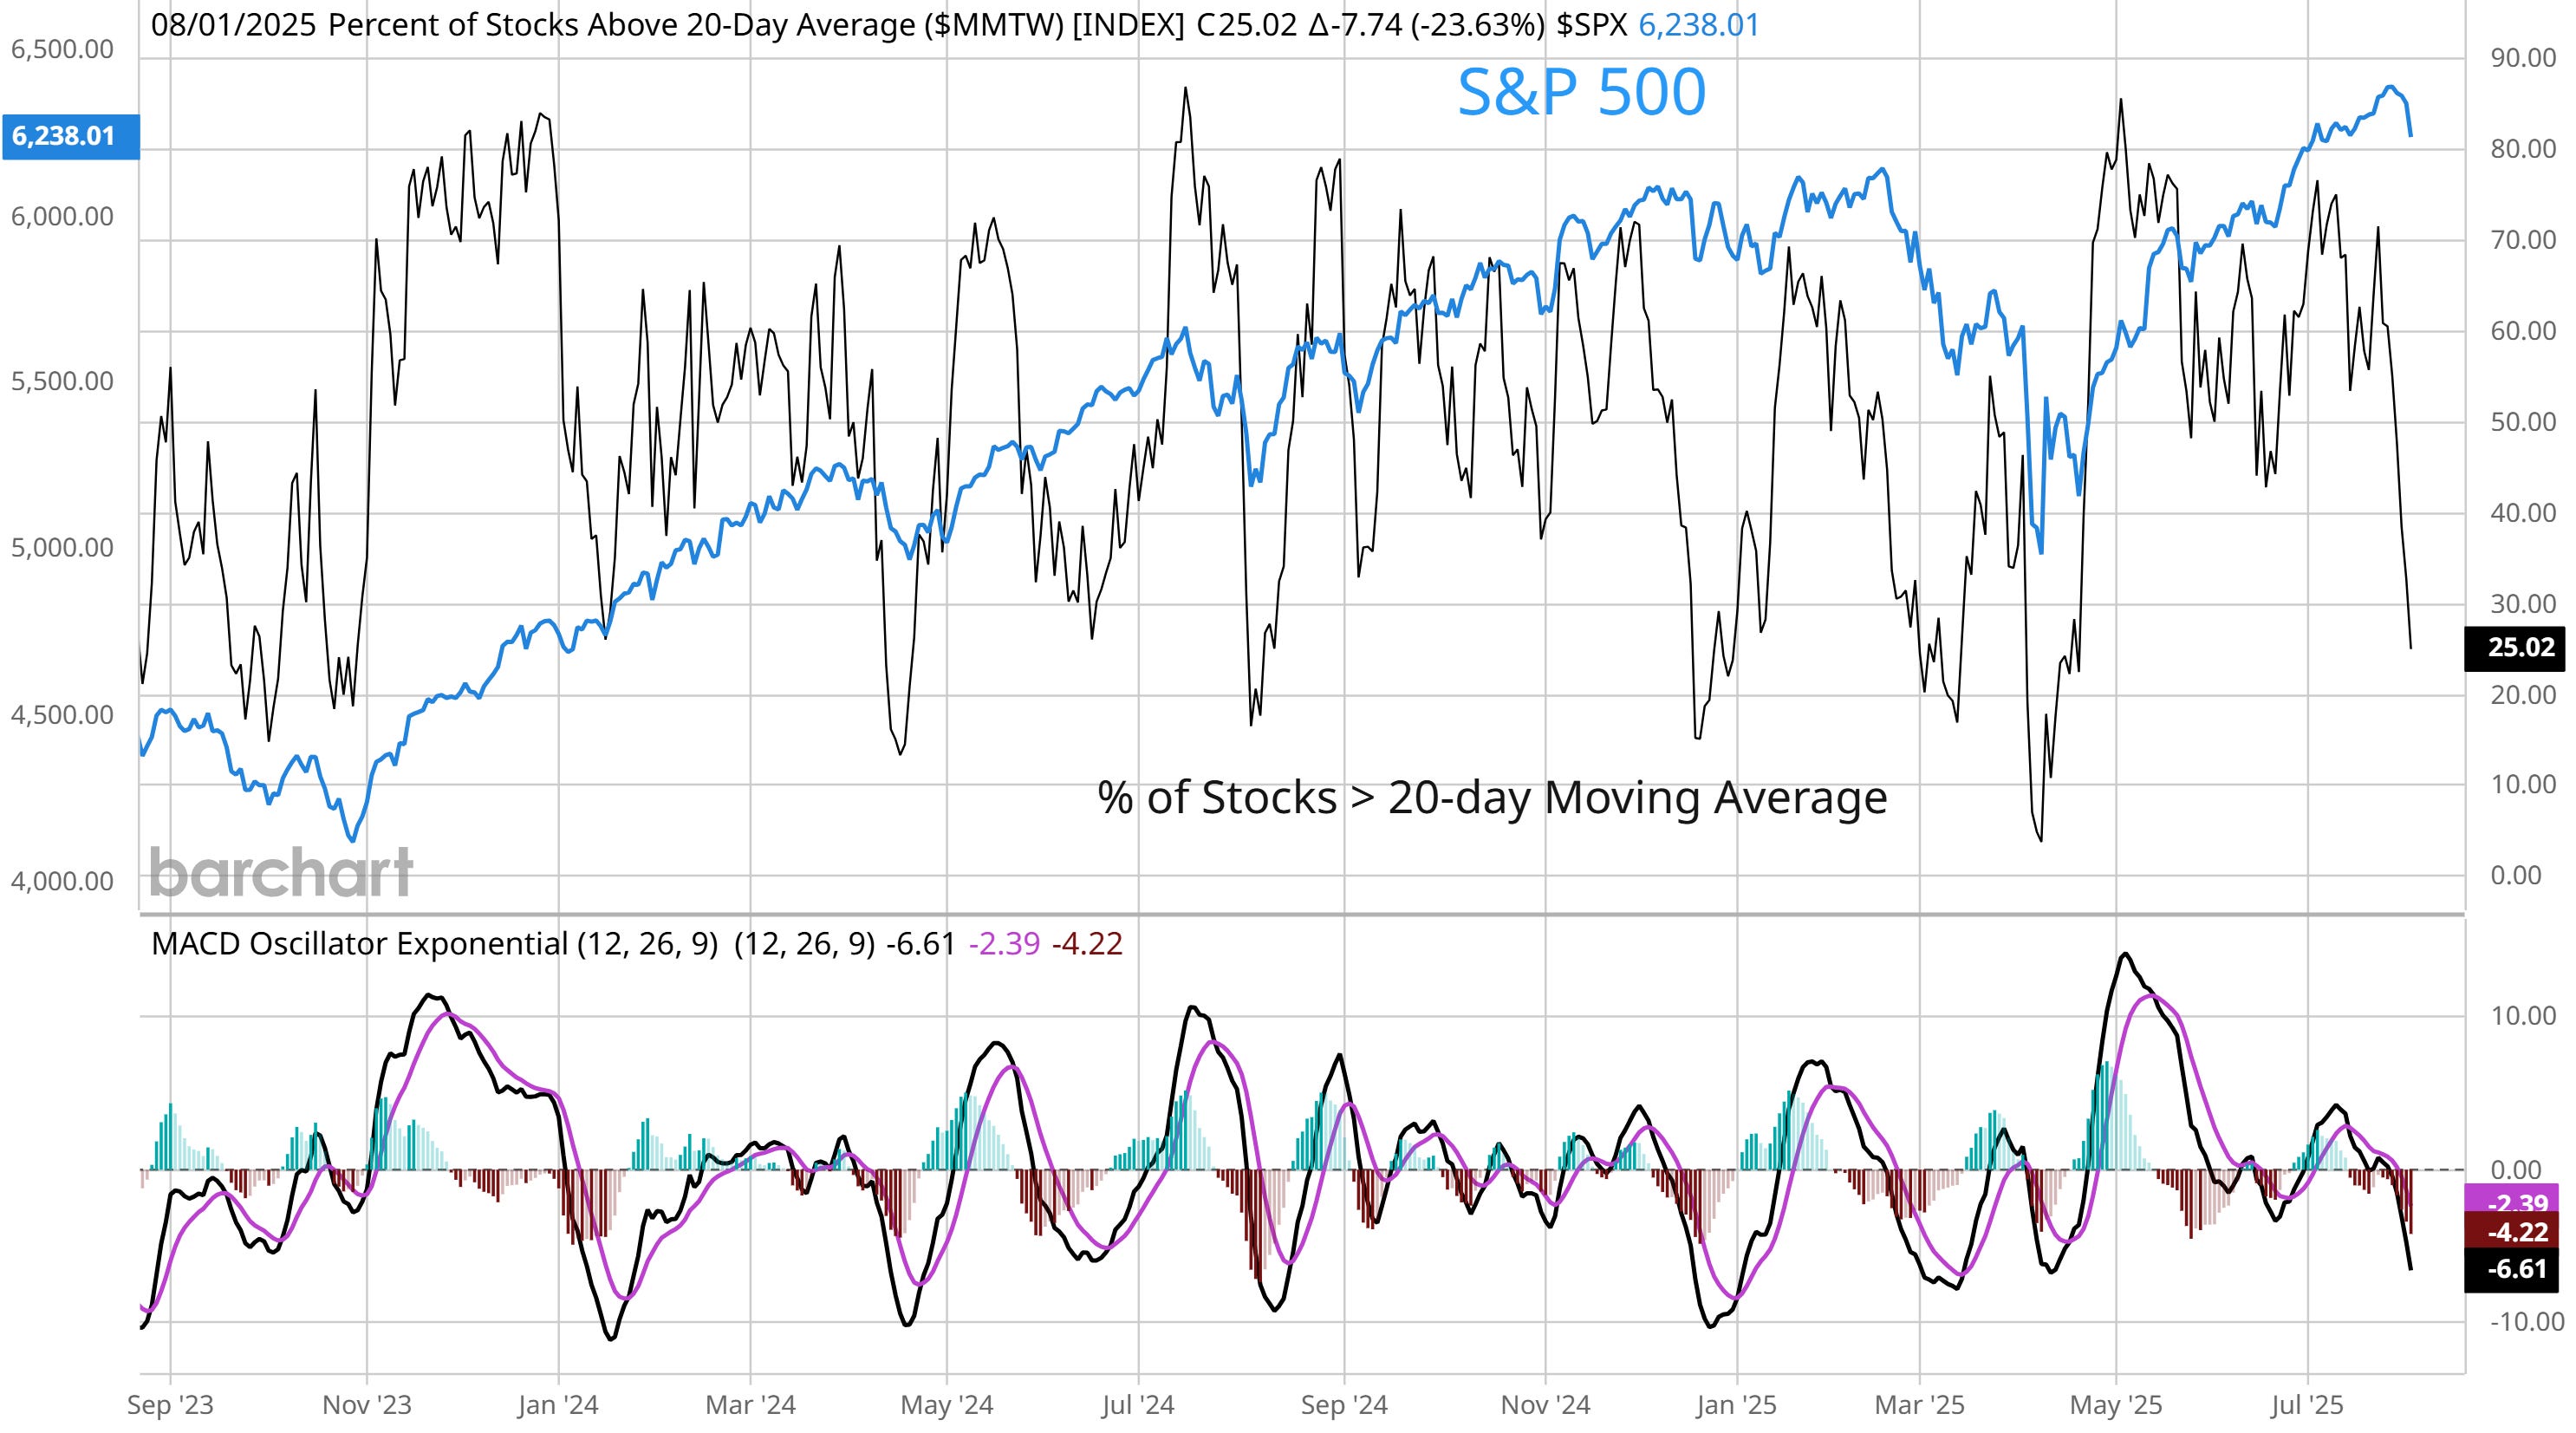
While the S&P 500 is only 2.3% off the recent high, the deterioration under the stock market’s hood has been much sharper. The percent of stocks across the market trading above their 20-day moving average (MA) has fallen sharply since the end of July and now stands at just 25% (chart below). That shows short-term breadth is already near oversold levels, where a reading below 20% historically marks an oversold breadth condition. The key is to now watch for a drop below 20% or for evidence of a positive breadth divergence where the S&P 500 makes a lower low in price while the percent of stocks in short-term uptrends makes a higher low.
Heard in the Hub
The Traders Hub features live trade alerts, market update videos, and other educational content for members.
Here’s a quick recap of recent alerts, market updates, and educational posts:
The key metric that could keep the Fed on hold.
The must watch MAG 7 chart during earnings season.
A new buy in the model portfolio to leverage an AI breakout.
What the post-election cycle says about the S&P 500’s next move.
Why history says an epic trading environment could be incoming.
You can follow everything we’re trading and tracking by becoming a member of the Traders Hub.
By becoming a member, you will unlock all market updates and trade alerts reserved exclusively for members.
🚨Our recent 142% gain in RKLB would cover a subscription for two years if you apply this discount found in the link below:
👉You can click here to join now👈
Trade Idea
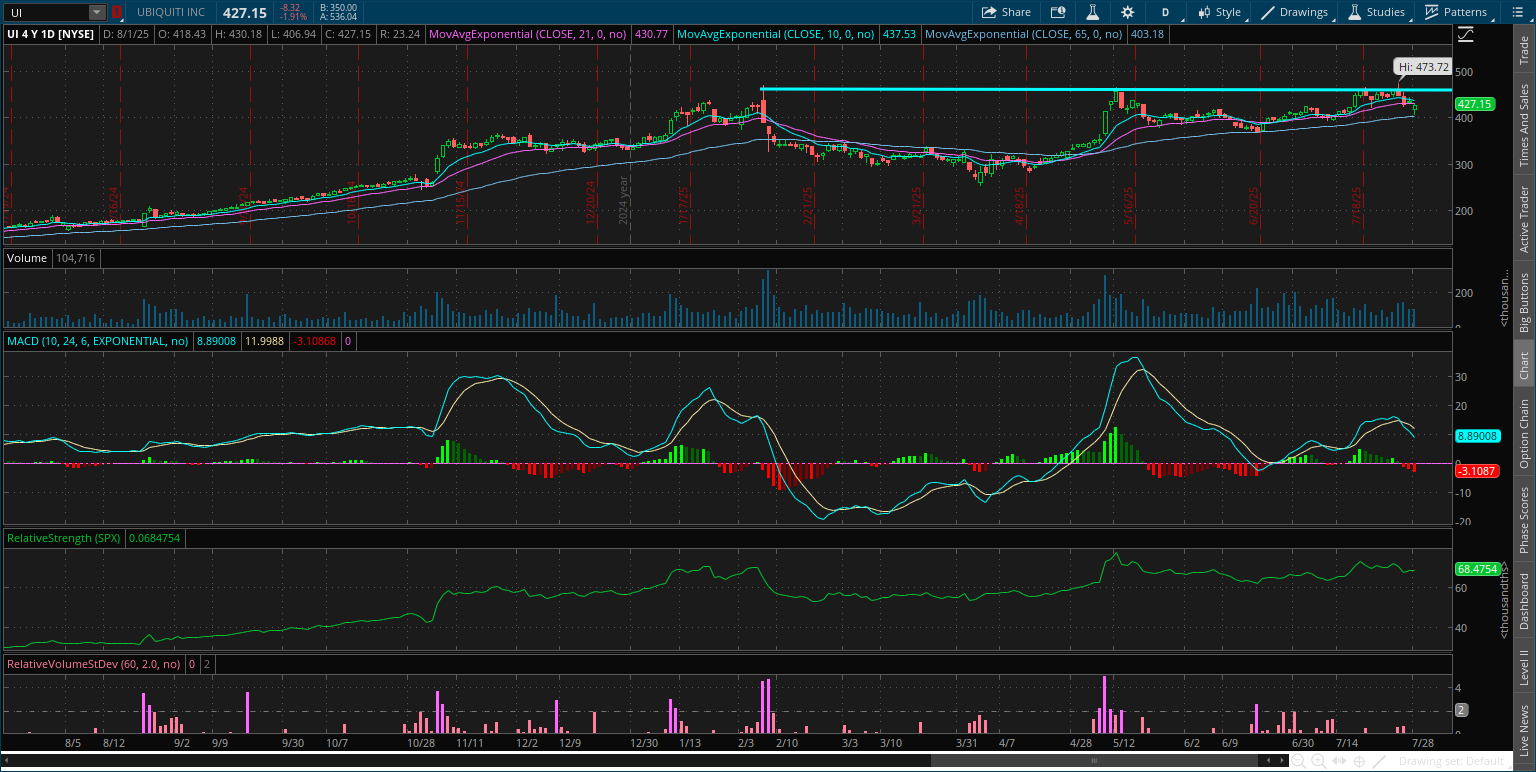
Ubiquiti (UI)
The stock peaked near the $460 level back in February and is making a series of smaller pullbacks. The includes a test of resistance in May and at the end of July. The MACD is making a bullish momentum reset above zero. I’m watching for a breakout over $460.
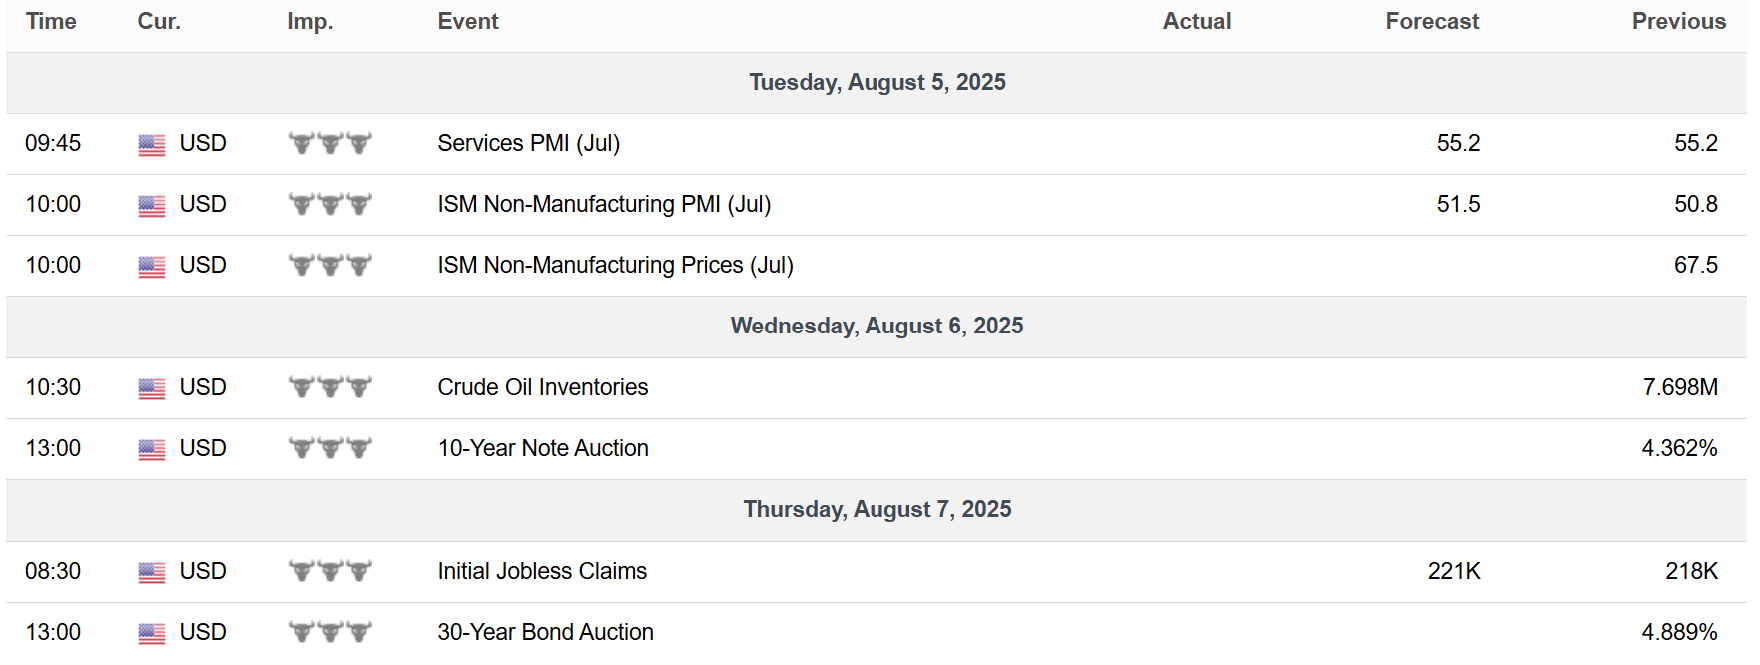
Key Upcoming Data
Economic Reports
Earnings Reports

I hope you’ve enjoyed The Market Mosaic, and please share this report with your family, friends, coworkers…or anyone that would benefit from an objective look at the stock market.
Become a member of the Traders Hub to unlock access to:
✅Model Portfolio
✅Members Only Chat
✅Trade Ideas & Live Alerts
✅Mosaic Vision Market Updates + More
Our model portfolio is built using a “core and explore” approach, including a Stock Trading Portfolio and ETF Investment Portfolio.
Come join us over at the Hub as we seek to capitalize on stocks and ETFs that are breaking out!
And if you have any questions or feedback, feel free to shoot me an email at mosaicassetco@gmail.com
Disclaimer: these are not recommendations and just my thoughts and opinions…do your own due diligence! I may hold a position in the securities mentioned in this report.