
The Market Mosaic 8.31.25
A perfect 'Goldilocks' environment for stocks?

👋Welcome back to The Market Mosaic, where I gauge the stock market’s next move by looking at macro, technicals, and market internals. I’ll also highlight trade ideas using this analysis.
If you find this report helpful please hit that “like” button, share this post, and become a subscriber if you haven’t already done so!
🚨And be sure to check out Mosaic Traders Hub. It’s a members-only platform to alert trade ideas, track a model portfolio of open positions, and further analyze the message coming from the capital markets (👇be sure to check out our special offer below).
Now for this week’s issue…
A pullback in mega-cap growth stocks following Nvidia’s most recent earnings report is weighing on major indexes. But that’s masking strength in the average stock.
Nvidia posted its ninth consecutive quarter of 50%+ year-over-year revenue growth. But this marked the slowest pace during that stretch while sales in the company’s data center segment came in slightly below estimates. That’s the division most exposed to demand stemming from artificial intelligence (AI) applications.
It may look like a blockbuster quarter. But trading at 39 times forward earnings estimates, NVDA shares are priced for perfection. Cracks in the AI growth outlook are weighing on mega-cap technology stocks.
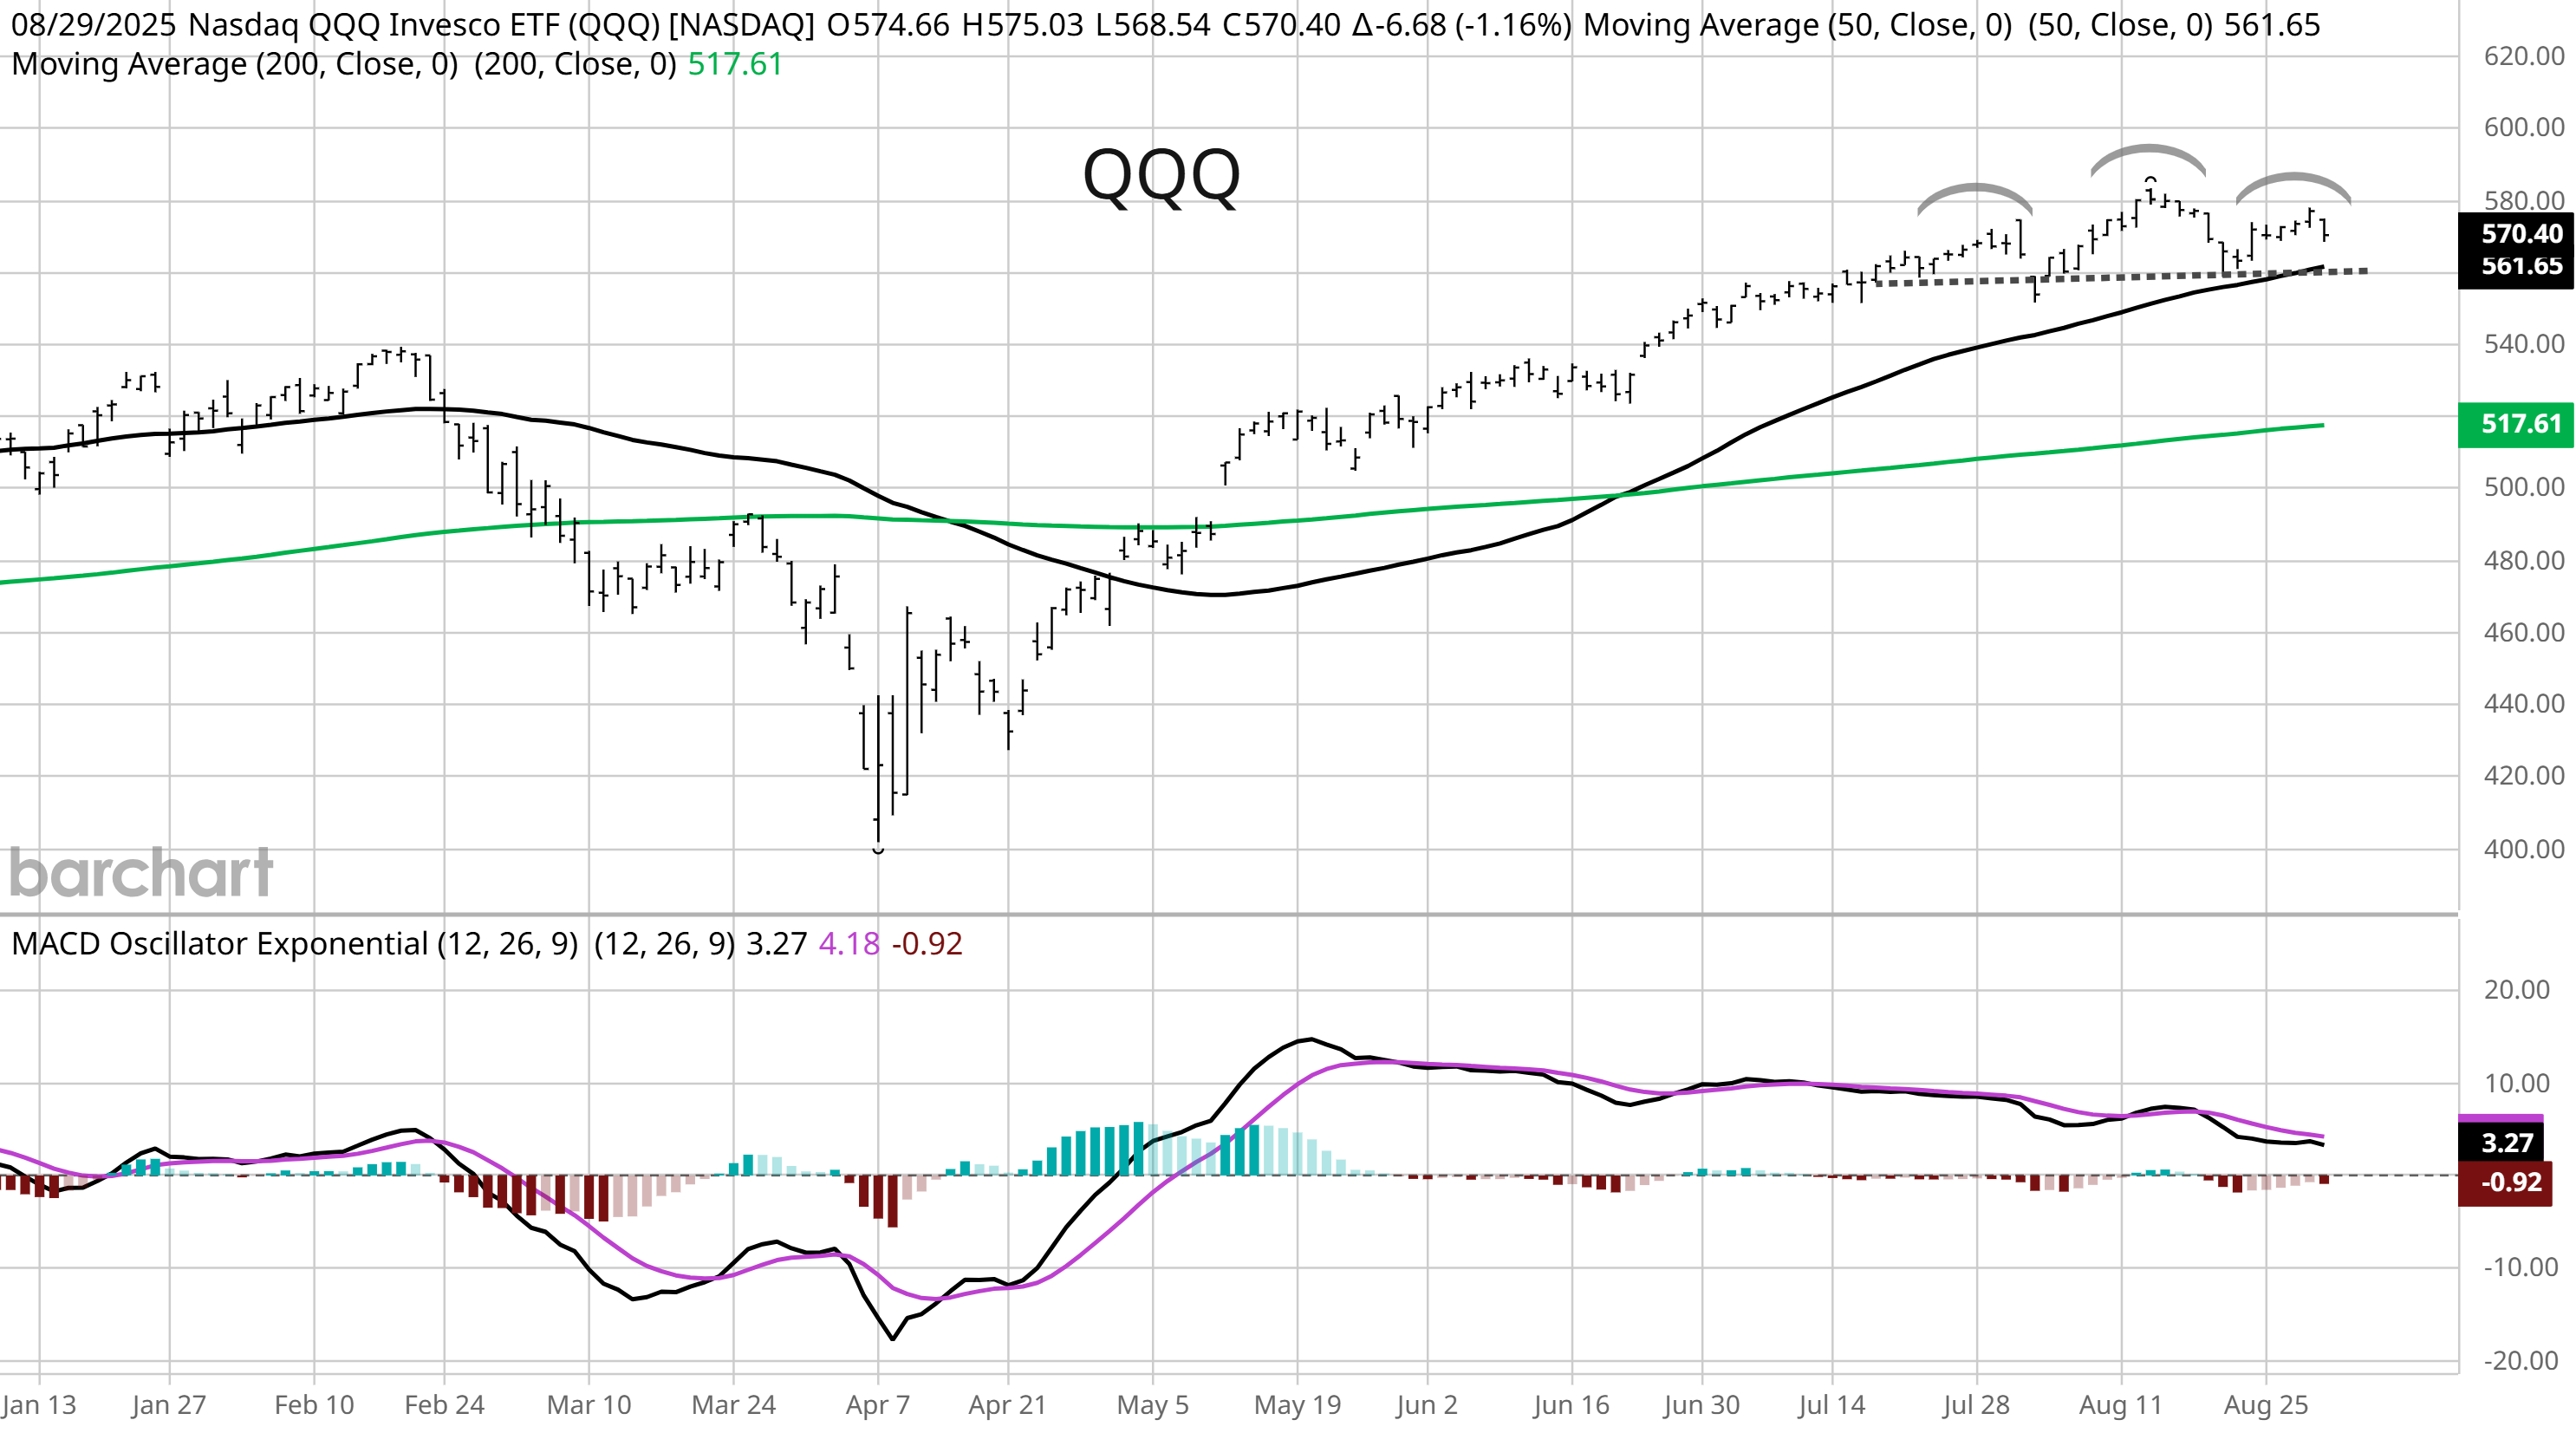
The top 10 holdings in the Invesco QQQ Trust (QQQ) are familiar names exposed to the AI theme like Apple and Microsoft in addition to Nvidia, and they account for approximately 50% of the fund.
Any pullback in shares will weight heavily on major indexes like QQQ and the S&P 500. That makes the recent action in QQQ a bit concerning, which isn’t keeping pace with the S&P.
While the S&P 500 was making record highs last week, you can see in the chart below that QQQ has failed to confirm. QQQ is also potentially setting in a head and shoulders topping pattern, which would be completed with a break of the neckline at $560.
While a pullback in the AI trade could weigh on the indexes, that’s masking a surge in strength in cyclical areas of the stock market. That comes at a time when mounting evidence points to economic activity picking up.
The appearance of breadth thrusts when the stock market is trading near record highs is rare. But a “Goldilocks” backdrop for the stock market is boosting breadth.
This week, let’s look at why the economy is performing much better than most investors realize along with market-based signals that the growth outlook is holding up. We’ll also unpack a key inflation report and why it’s driving a historic breakout in gold prices.
The Chart Report
Evidence is growing that the fog around the trade war is clearing which is starting to boost economic activity. Following the second quarter earnings season, mentions of recession on earnings calls from companies in the S&P 500 plunged relative to the first quarter. That was especially the case in sectors most exposed to tariff headlines, including industrials where mentions fell from 28 to five. Estimates of current quarter growth are jumping as well. The Atlanta Fed’s GDPNow model is showing third quarter GDP growth at 3.5% annualized (chart below) with strong contributions from both consumer and business spending.

If the outlook for the economy is positive, then cyclical stock market sectors should respond with favorable price action. Stock prices discount future business conditions, and for the first time since early 2024 every cyclical sub-industry group has a rising 100-day moving average (MA - chart below). That shows strong participation across cyclicals that are trading in intermediate-term uptrends. That also tends to reflect a strong backdrop for the overall stock market. When at least 95% of cyclical sub-industries have a rising 100-day MA, the S&P 500 returns an annualized 20.8%.

Strong participation across cyclicals is just one sign that stock market breadth is surging. We’ve been tracking positive price action in the average stock, like with the breakout in the Invesco S&P 500 Equal Weight ETF (RSP). The NYSE’s advance/decline ratio registered a reading of 10-1 following Fed Chair Jerome Powell’s dovish Jackson Hole speech, which is one of the highest readings so far this year. That same day also triggered a “90/90” reading on the NYSE. Over 90% of NYSE names rallied with up volume over 90% as well. The table below shows past 90/90 days on the NYSE along with forward returns for the S&P 500, where the average gain six months from the event is 16% with 83% of periods positive.

Investors are hopeful that Powell’s Jackson Hole speech marks a return of interest rate cuts. After cutting rates by 1.0% in late 2024, the Fed has been on hold for the past eight months. Concerns over the labor market is the primary catalyst for cutting rates, but the Fed might not get too far if inflation holds up. The Fed’s preferred inflation gauge is the personal consumption expenditures (PCE) price index. Last week saw the headline figure at 2.6% while the core increased by 2.9% compared to last year. You can see that the disinflation trend is stalling out, with core inflation trending near 3% for over a year (red line below) which is well above the Fed’s 2% target.

Upside inflation surprises may frustrate the Fed, but it could be a huge catalyst for the next uptrend phase in gold prices. Following the PCE inflation report, gold is breaking out from a four month triangle consolidation pattern and is trading near the prior record high set back in April. That’s happening as gold’s historical seasonality is becoming more of a bullish tailwind as well. Over the past 50 years, September has been the second strongest month for gold returns as well as the percent of time gold finishes with a gain (chart below). Seasonality mostly remains a tailwind heading into early next year.

Heard in the Hub
The Traders Hub features live trade alerts, market update videos, and other educational content for members.
Here’s a quick recap of recent alerts, market updates, and educational posts:
More evidence the trade war fog is clearing.
A “Goldilocks” environment for the average stock.
A contrarian positioning signal is bullish for small-caps.
The next “pick and shovel” stock to watch for the AI trade.
Why patience may pay off with this watchlist stock setting up.
You can follow everything we’re trading and tracking by becoming a member of the Traders Hub.
By becoming a member, you will unlock all market updates and trade alerts reserved exclusively for members.
🚨Come see how we’re creating “asymmetry” in our model portfolio by letting our winners run and keeping losses small. You can join the Traders Hub with a special discount offer below:
👉You can click here to join now👈
Trade Idea
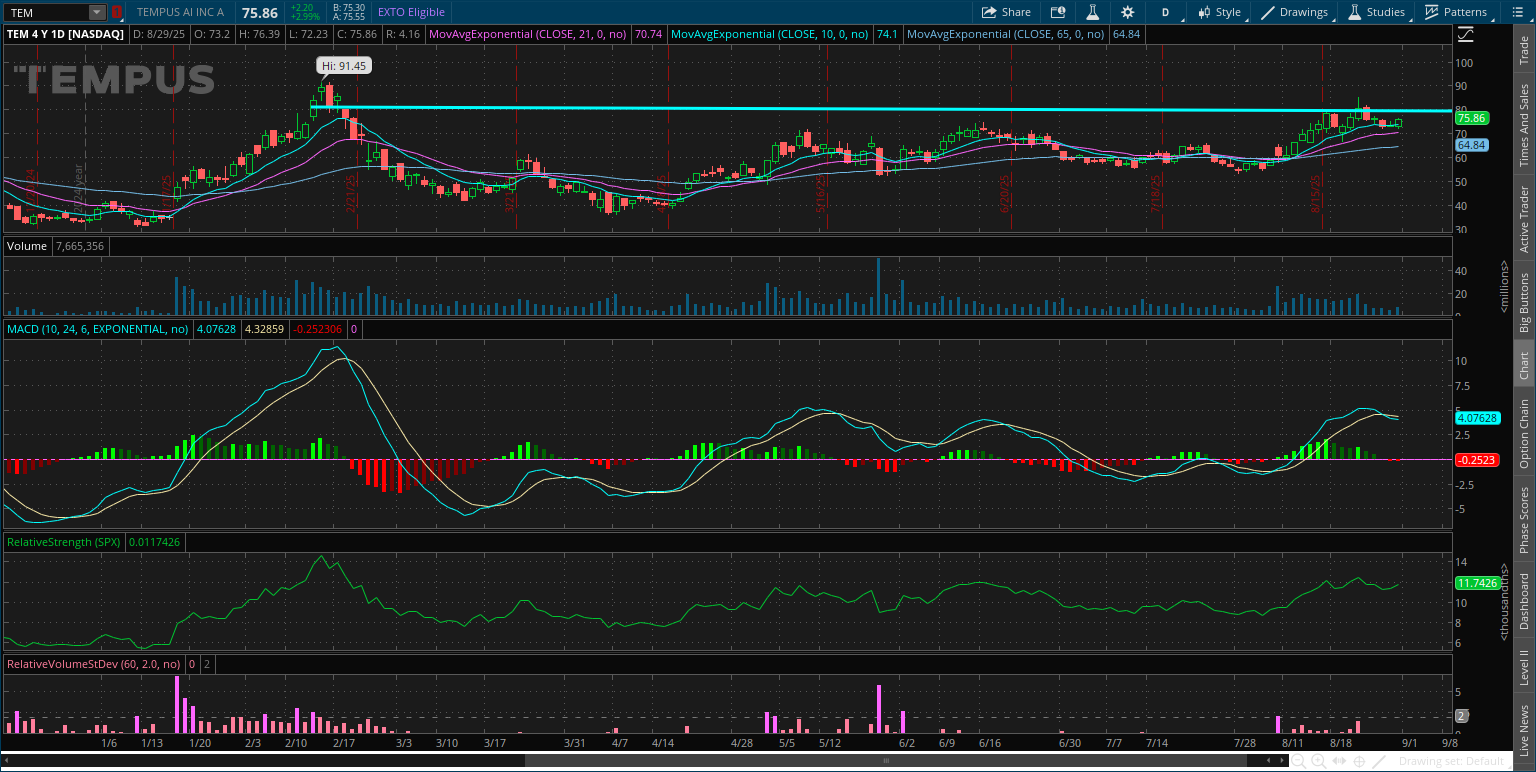
Tempus AI (TEM)
Recent AI healthcare IPO that’s trading in a narrowing range since March. Price is making a smaller pullback following a test of the $80 level, while we also need to see the MACD reset at zero. I’m watching for a move over $80 followed by new highs.
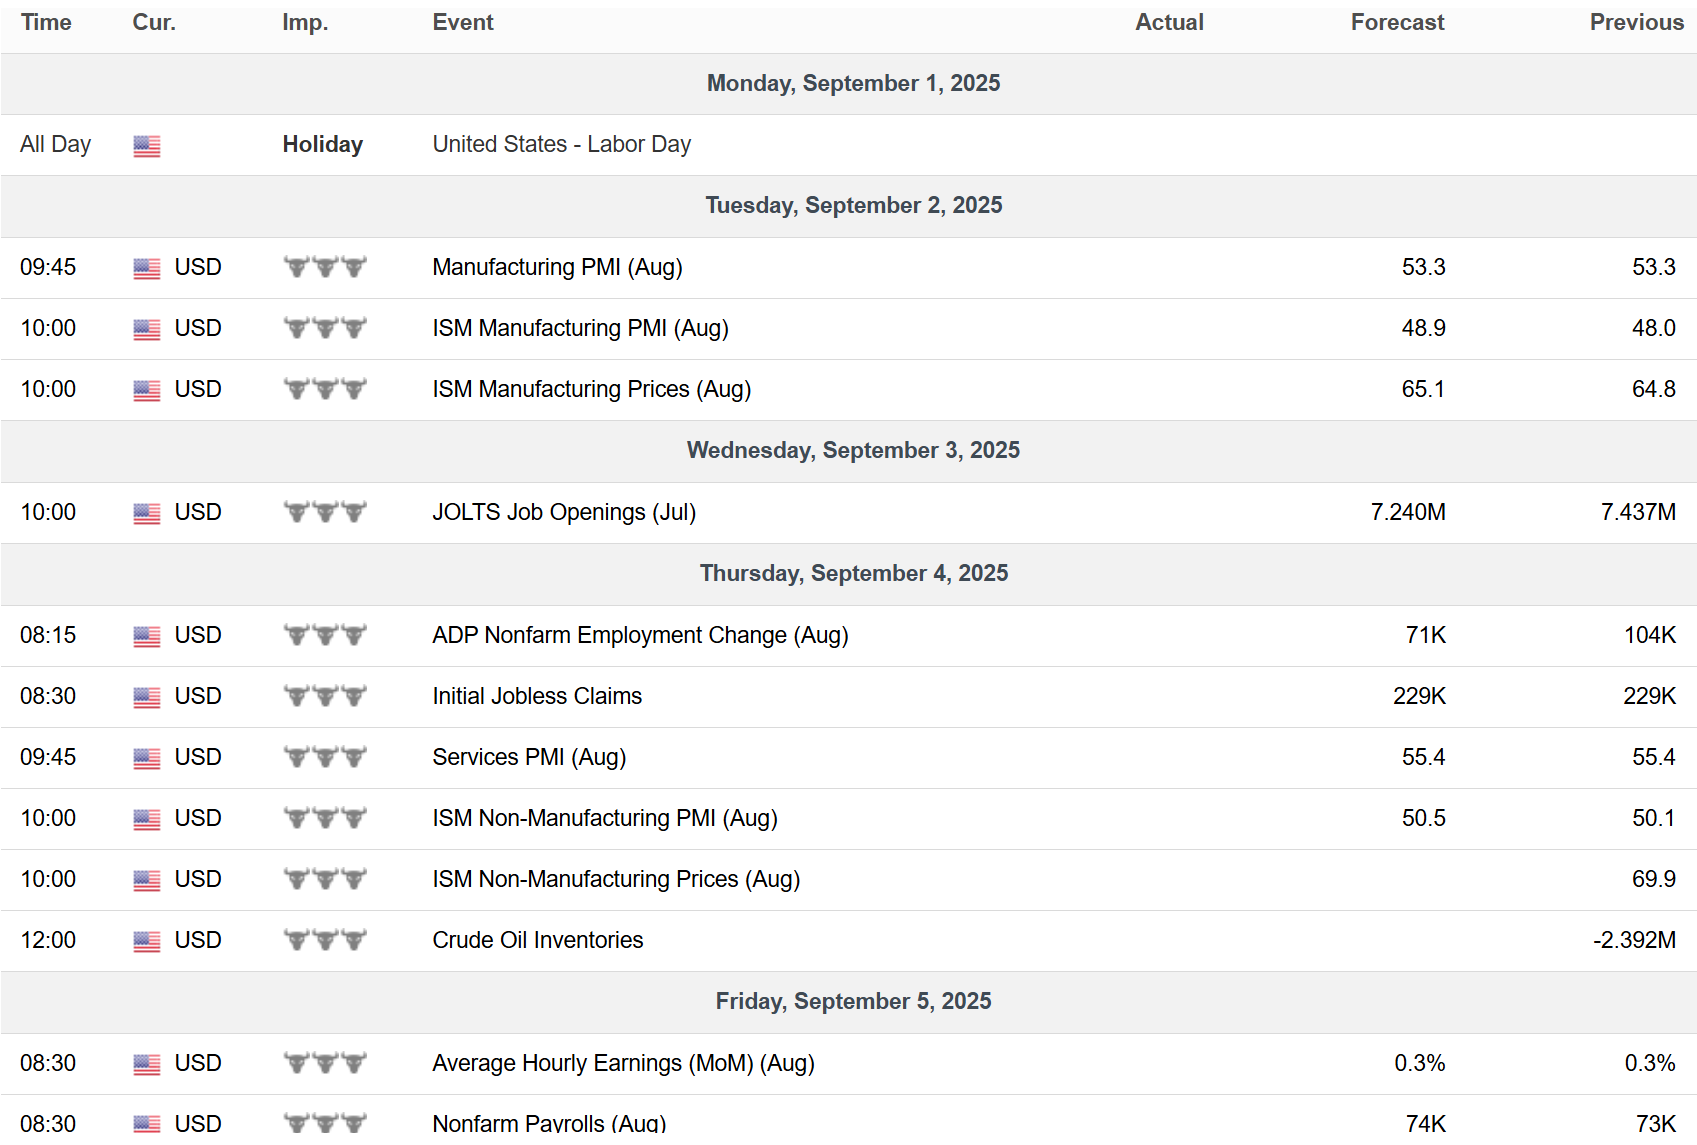
Key Upcoming Data
Economic Reports
Earnings Reports

I hope you’ve enjoyed The Market Mosaic, and please share this report with your family, friends, coworkers…or anyone that would benefit from an objective look at the stock market.
Become a member of the Traders Hub to unlock access to:
✅Model Portfolio
✅Members Only Chat
✅Trade Ideas & Live Alerts
✅Mosaic Vision Market Updates + More
Our model portfolio is built using a “core and explore” approach, including a Stock Trading Portfolio and ETF Investment Portfolio.
Come join us over at the Hub as we seek to capitalize on stocks and ETFs that are breaking out!
And if you have any questions or feedback, feel free to shoot me an email at mosaicassetco@gmail.com
Disclaimer: these are not recommendations and just my thoughts and opinions…do your own due diligence! I may hold a position in the securities mentioned in this report.