The Market Mosaic 8.28.22
Red Light, Green Light. Which Signal for Stocks?
Welcome back to The Market Mosaic, where I gauge the stock market’s next move by looking at trends, market internals, and the mood of the crowd. I’ll also highlight one or two trade ideas I’m tracking using this information.
And if you find this content helpful, hit that “like” button (you know, the one that looks like a heart). Because I heart you too…
Please share this post and become a subscriber to this always free newsletter if you haven’t already done so!
Also, be sure to check out Mosaic Chart Alerts. It’s a midweek update covering my best chart setups among long and short ideas in the stock market, along with specific levels that would trigger a trade.
Now for this week’s issue…
Was it something I said?
I’m sure that’s what Fed Chair Jerome Powell was thinking about the stock market following his Jackson Hole speech.
The S&P 500 sunk over 3% on Friday, which is the 7th decline of 3% or more this year. Just in case you need a reminder that we’re seeing historic levels of volatility, check out the table below from Charlie Bilello:
Right now, trading in stocks are tightly correlated to the evolving outlook for interest rates. In the rally that started in mid-June, investors perceived that the Fed was executing a dovish pivot when Powell noted that the fed funds rate was around neutral territory. That meant expectations for further rate hikes were starting to temper.
On Friday, Powell slammed the door shut on that perception. He stated that “restoring price stability will likely require maintaining a restrictive policy stance for some time…” and that reaching neutral doesn’t mean pausing.
I’ve shown you before how to use market based odds from CME Group to track expectations for further rate hikes. Well, just look at the jump in the probability for a 0.75% rate hike at the September meeting compared to the end of July:
As investors quickly reassess the path of short-term rates, is this just the beginning of the next major downturn in stocks? Here’s what I’m watching for signals on the next move.
Red Light or Green Light
Powell’s speech may have been the catalyst, but we weren’t caught off guard by this pullback. Last week, I laid out my expectation that stocks were heading into a mean reverting phase, where excessive upside momentum would transition to a downside move.
But that pullback was sudden and severe. So where does the price phase stand now? Lets start with the indicators that are flashing red lights.
Red Light
Last week, I noted Bitcoin’s plunge from a bear flag pattern. That turned out to be an early warning signal that attitudes toward stocks and other risk assets were still fragile. Crypto remains the ultimate risk asset, which helps inform my view of sentiment toward stocks. And right now, the continued breakdown in Bitcoin’s chart does not bode well. A move below the $20k level with follow through under $18k would be a huge warning signal for other risk assets.
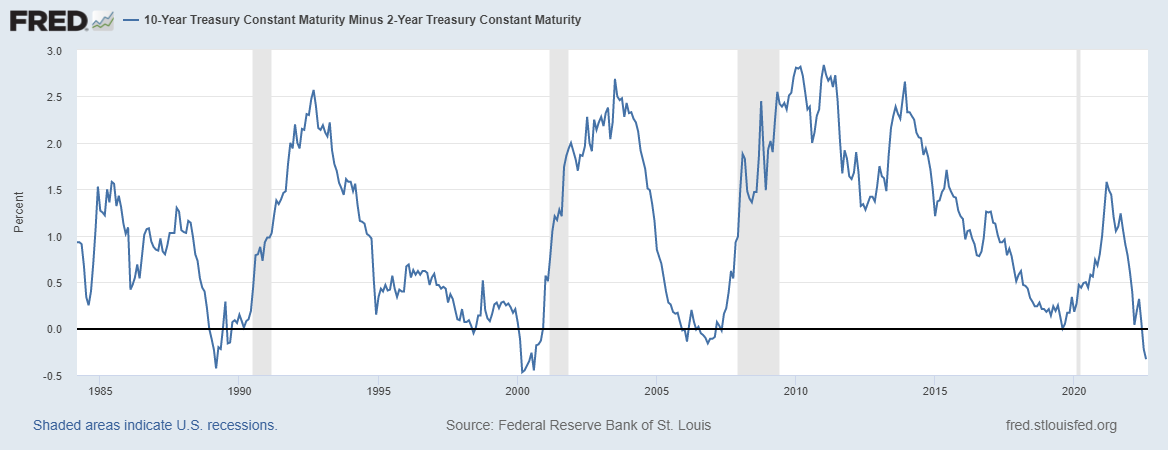
Negative signals from the fixed income market remain as well. Key measures of the U.S. Treasury yield curve remain inverted like with the 2-year/10-year maturities (chart shown below), or are close to inversion like with the 3-month/10-year curve. I explained here and here why I closely follow these indicators.
High yield spreads have also turned higher since mid-August. There were “green shoots” in this asset class when stocks started rallying back in June. High yield spreads started to quickly compress, indicating that concerns of distress in companies with low credit quality was abating. But that’s reversing as recent gauges of economic activity continue to indicate a sharp deceleration.
Green Light
The green lights are still developing, but I’m tracking an oversold condition in stocks while the S&P 500 is still trading above important support levels. The chart below shows the index along with the 50- and 200-day moving average (black and green line respectively). After rejecting off the 200-day, the S&P is still trading above the 50-day which is also converging at the key 4,000 price level. That level will be a big “line in the sand” for me.
At the same time, one of my favorite short-term timing indicators is quickly reaching oversold territory, and that is with the percent of stocks trading above their 20-day moving average. I noted last week my expectation for a pullback in stocks as this indicator reached historically overbought levels. With last week’s sharp pullback, this metric is making a quick trip toward oversold levels as you can see below.
Now What…
Last week, I stressed being patient and waiting for the stock market’s setup to evolve, and that’s still the best course of action in my opinion. I’m watching the S&P levels laid out above, and being patient with deploying new positions.
This environment is also a great example of why I trade breakouts. If the stock market can’t gain any traction here, then I would not expect the breakout setups highlighted in this newsletter and Mosaic Chart Alerts to trigger. My process keeps my cash levels elevated when the going gets tough!
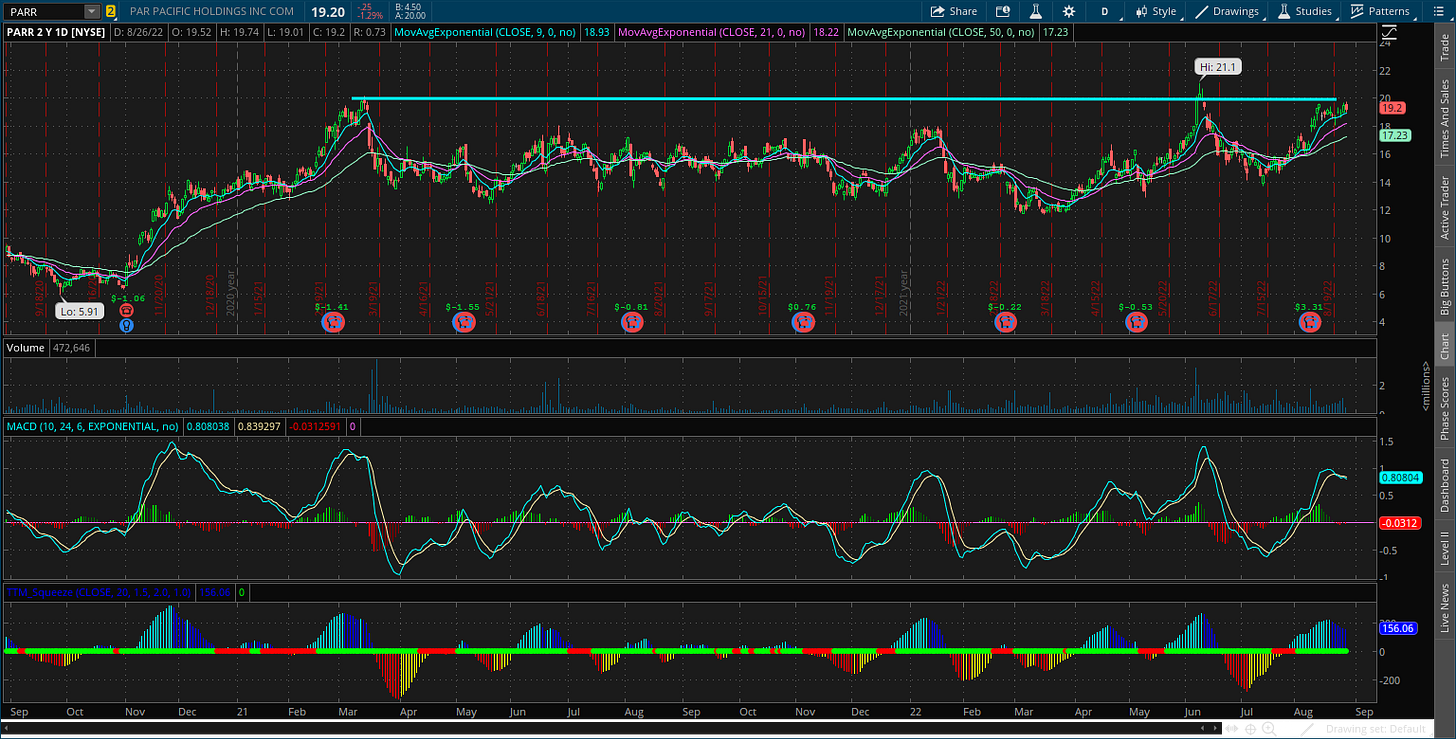
But I will tell you this. There are many setups in the value and energy sectors that would benefit greatly from a consolidation in their uptrend before breaking out. PARR is a great example of this. Look at the MACD as PARR tests the $20 level yet again. Upside momentum is extended, meaning the potential for mean reversion is high. In my ideal setup, PARR would experience a shallow pullback that resets the MACD before breaking out.
Guess where we just saw a similar setup play out: DNOW. This is exactly why I kept coming back to DNOW as one of my favorite setups in the market. Look at the most recent MACD reset just below resistance, which led to a big breakout on higher volume.
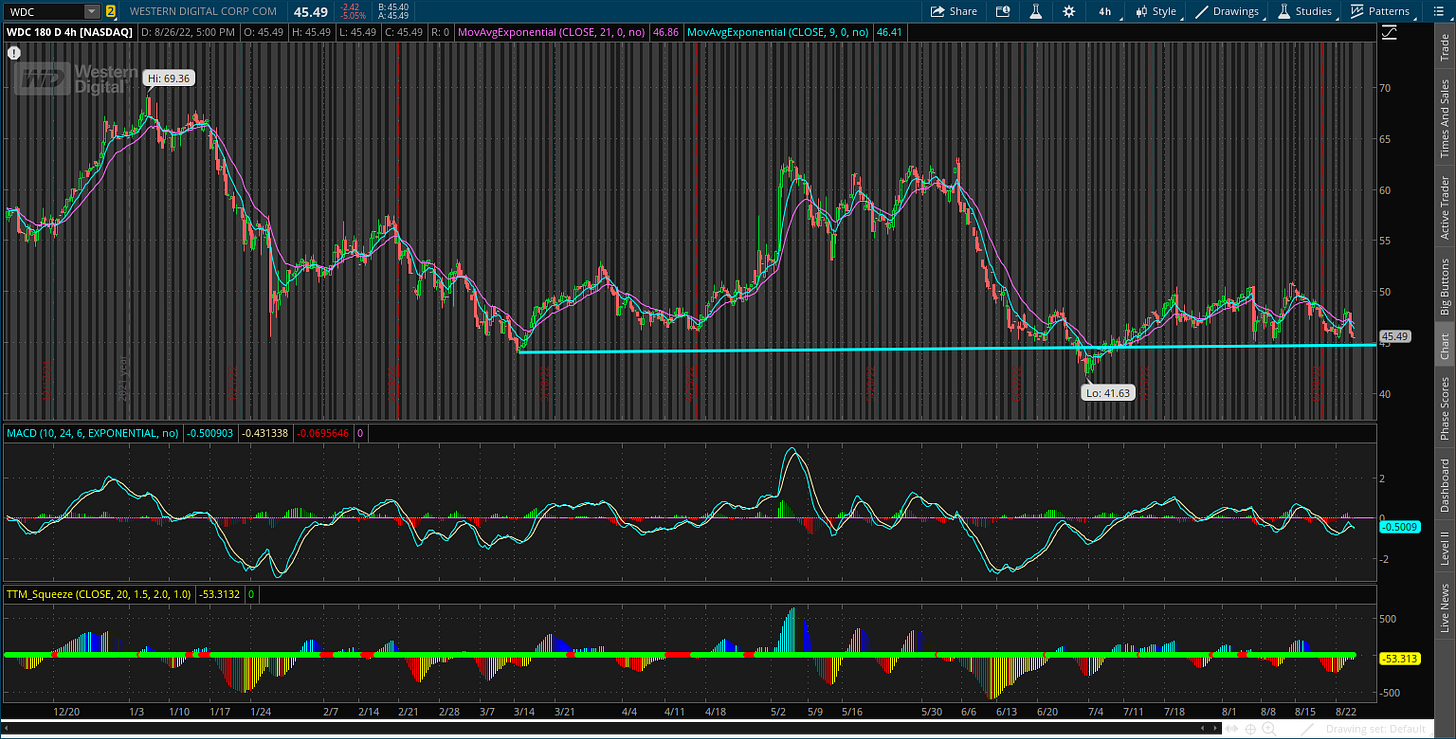
With short setups, the downside pattern that I highlighted in WU is playing out. The pattern in WDC is close to triggering as well, where I’m waiting for a close under $45 as you can see below:
That’s all for this week. I’m still in wait and see mode with most long setups, where a reset in momentum followed by a breakout is my ideal scenario. At the same time, I will continue to scan for downside breaks should market conditions remain tough.
I hope you’ve enjoyed this edition of The Market Mosaic, and please share this newsletter with anyone you feel could benefit from an objective look at the stock market.
Make sure you never miss an edition by subscribing here.
For updated charts, market analysis, and other trade ideas, give me a follow on twitter: @mosaicassetco
And if you have any questions or feedback, feel free to shoot me an email at mosaicassetco@gmail.com
Disclaimer: these are not recommendations and just my thoughts and opinions…do your own due diligence! I may hold a position in the securities mentioned in this newsletter.


