The Market Mosaic 8.25.24
S&P 500: Strong breadth paving the way for new highs.
Welcome back to The Market Mosaic, where I gauge the stock market’s next move by looking at macro, technicals, and market internals. I’ll also highlight trade ideas using this analysis.
If you find this content helpful please hit that “like” button, share this post, and become a subscriber if you haven’t already done so!
And be sure to check out Mosaic Chart Alerts. It’s a midweek update covering chart setups among long and short trade ideas in the stock market, along with levels I’m watching.
Now for this week’s issue…
Comments from Federal Reserve Chair Jerome Powell confirmed what the bond market has been pricing for months.
Noting softening labor market conditions along with inflation falling back toward target, Powell stated that “the time has come for policy to adjust” during his speech at the Jackson Hole gathering of central bank officials and economists.
Although few details were given on the expected magnitude and pace of incoming interest rate cuts, a new easing cycle should be underway next month. Following Powell’s speech, markets are currently pricing four rate cuts of 0.25% through the end of the year (chart below) starting with the next meeting in September.

Only two years ago at the same venue in Jackson Hole, Powell hinted that the Fed was willing to accept a recession in order to get inflation under control. But perhaps the central bank is having other thoughts following a massive revision lower in payrolls for the 12-month period ending in March.
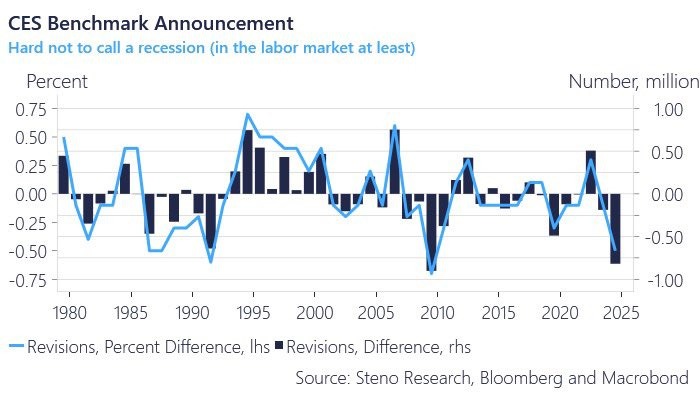
Every year, the Bureau of Labor Statistics (BLS) revises jobs data using more detailed reports about unemployment insurance claims at the state level. This time around, estimates for job growth were revised lower by 818,000 jobs (chart below).

You typically see such large negative revisions coming out of recession, with last week’s reported figure the most since coming out of the financial crisis in 2009 as you can see in the chart.
Powell focused heavily on recent jobs data in his remarks, stating that the Fed does “not seek or welcome further cooling in labor market conditions.” That suggests the labor side of the Fed’s dual mandate is becoming the greater focus versus price stability (i.e. inflation).
Clearly there is concern about softening labor market data, and that the Fed now needs to pivot toward cutting rates to achieve a “soft landing” and avoid recession. But the action underneath the hood in the stock market is painting a much different picture about the health of the economy and corporate earnings outlook.
Broad participation in the rally off the August lows along with price action in cyclical sectors are delivering a positive message about the outlook. Here are several charts I’m watching as the S&P 500 rallies back toward all-time highs.
Breadth Surging on the Rally
In recent reports, I’ve highlighted how key cyclical sectors were simply back testing breakouts during the selloff into the August 5 lows. Whether that was previous price resistance that should now serve as support, or breakouts from patterns that come back to test trendlines.
While many were concerned with the prospect of failed breakouts, important support levels are holding in cyclical sectors like housing, bank stocks, and small-caps. And the rally off those levels is recently accelerating. The chart below of the IWM exchange-traded fund (ETF) that tracks the Russell 2000 Index of small-cap stocks is a good example of a trendline retest.
After breaking out from a bullish pennant pattern (dashed trendlines), IWM came back to fill the gap from the breakout which was also a test of trendline support. The MACD also reset on the pullback, while the RSI in the bottom panel held at 40. From there, price is rallying back toward the 52-week high.
But in addition to cyclical sectors rebounding, the price action on the rebound has been strong under the hood. That shows broad participation in the recent rally following so much concern around the “Magnificent 7” and stocks like Nvidia (NVDA) earlier in the summer.
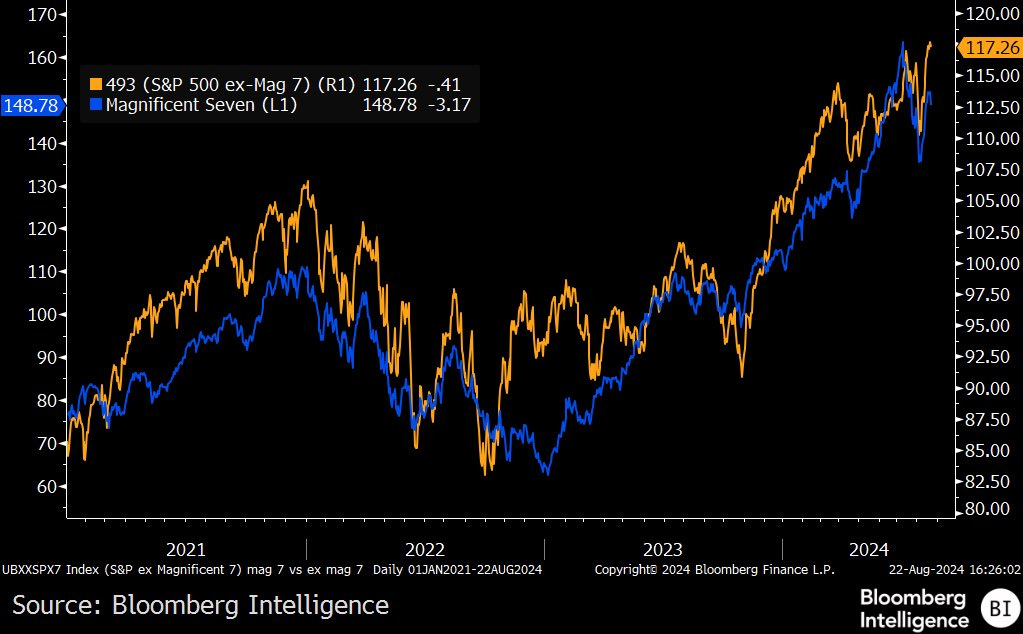
While the Mag 7 were driving a large share of the S&P 500’s gains earlier this year, the momentum is swinging back toward the other 493 stocks. The chart below shows the performance of the Mag 7 (blue line) versus the remaining 493 stocks in the S&P 500 (orange line). Note the “other 493” are now out to new highs ahead of the Mag 7.

There are other signs of strong breadth across the stock market. We can also track the daily number of advancing stocks versus declining issues on the NYSE. The chart below plots the ratio advancing stocks to declining ones. On Friday, that ratio surged to 11/1 (arrow) which is the strongest A/D ratio since last November.
We can also take the cumulative sum of net daily advancers versus decliners to produce the NYSE A/D line. As you can see in the chart below, the NYSE A/D line (bottom panel) was lagging the S&P 500 (top panel) badly heading into early July. As the S&P was making new highs in July, the average stock was pulling back. Poor participation in the trend served as a great warning signal, with the S&P going on to fall nearly 10% into early August.
But look at what’s happening since then. The NYSE A/D line is out to a new high well ahead of the S&P 500 and other major indexes. That shows a surge in the number of advancing stocks, and is a great sign for the bull market.
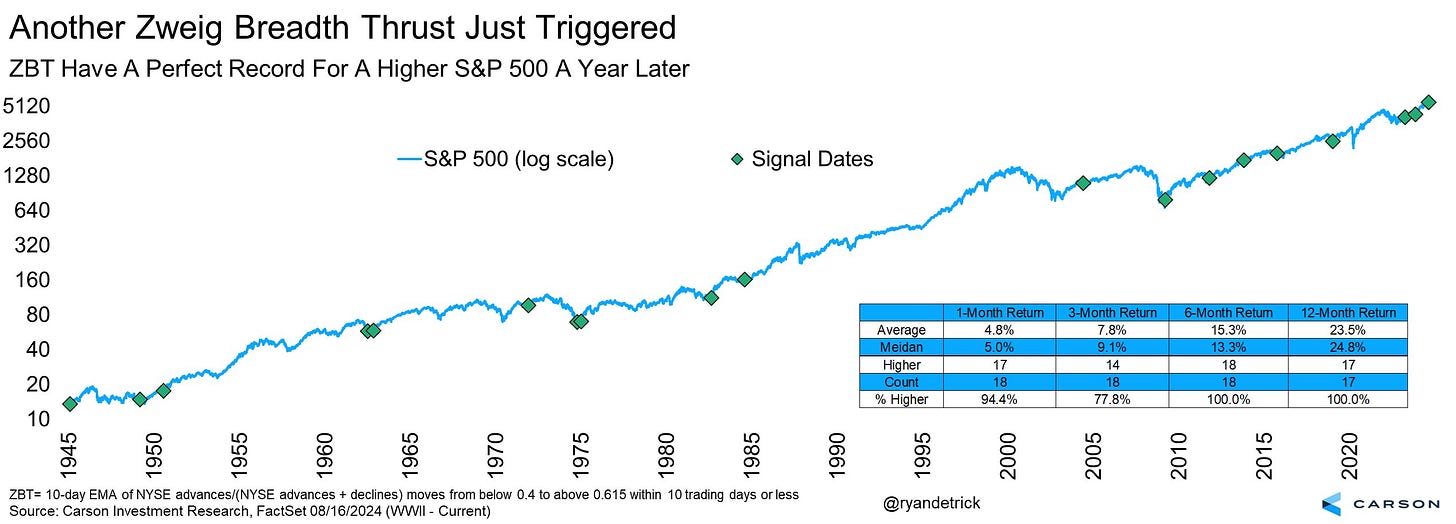
Breadth has been so strong lately that another Zweig Breadth Thrust triggered last week. I discussed how this breadth thrust works here last November when it triggered back then as well. As you can see in the chart below, historically forward returns for the S&P 500 are strong across multiple timeframes when a Zweig Breath Thrust triggers.

The rebound in cyclical sectors and participation in the rally off the early August lows is sending a positive signal regarding the economy and earnings outlook. While comments from Powell at Jackson Hole and softening labor market data has many concerned over a Fed policy error, the action in the stock market suggests otherwise.
Now What…
Following the historic surge in volatility and selloff into early August, I’ve outlined the potential for the S&P 500 to come back and test the lows. That view was based partly on precedent from prior periods of non-recessionary vol spikes that I outlined last week.
Relative to the scenarios that unfolded in 2015 and 2018, the S&P 500’s retracement of the losses has been much stronger this time around. Coupled with the action in cyclical sectors and strong breadth, a retest of the lows is becoming a smaller possibility in my opinion.
Although a smaller chance, I still believe the possibility is still there. During prior vol spike episodes, the S&P 500 rallied for about a month before rolling over. Applying a similar duration this time around, that would put us into early September which aligns with a poor seasonality. The table below plots the average daily return for the S&P 500 since 1957.

The worst two week seasonal stretch is in September shown with the red box, and it’s also worth noting that five of the past six speeches from Powell at Jackson Hole produced a drop in the S&P 500. The average decline in those episodes is 7.5%, where a drop of that magnitude would have the S&P 500 back near the August 5 lows.
Regardless of what unfolds, I would caution against getting too caught up in how the S&P 500 performs over the near-term. The rebound in cyclical sectors and broadening strength supports a positive 12-to-18-month outlook I discussed here.
Those longer-term catalysts include an improving liquidity cycle, corporate earnings growth, and decade-cycle seasonality. If I’m correct in my assessment, then the price action in the stock market should confirm my views.
And once the Fed starts cutting rates, the fate of the S&P 500 should ultimately come down to avoiding a recession or not. The chart below shows how the S&P performs over the 12-month period following the first rate cut of a loosening cycle. During 2001 and 2007, a sharp drawdown followed as recession hit corporate earnings.
Based on the action in cyclical sectors, I believe the “no recession” scenario is the most likely outcome. That means I’m still focusing on trading the long-side with stocks emerging from sound basing patterns and with solid growth fundamentals.
It’s hard to call for a recession when GE Aerospace (GE) is setting up to breakout from another basing pattern. The stock is trading in a tight sideways pattern since May while testing resistance near the $175 level several times. The relative strength line is holding near the highs as the MACD is turning higher from a reset at the zero line. I’m now watching for a move over $175.
That’s all for this week. The main event next week will be an updated report on PCE inflation, which is the Fed’s preferred gauge. While investors will seek more signs that disinflation will allow the Fed to start cutting rates in September, I’ll be watching if the major indexes can keep pace with the strong performance in the average stock.
I hope you’ve enjoyed The Market Mosaic, and please share this report with your family, friends, coworkers…or anyone that would benefit from an objective look at the stock market.
And make sure you never miss an edition by subscribing here:
For updated charts, market analysis, and other trade ideas, give me a follow on X: @mosaicassetco
And if you have any questions or feedback, feel free to shoot me an email at mosaicassetco@gmail.com
Disclaimer: these are not recommendations and just my thoughts and opinions…do your own due diligence! I may hold a position in the securities mentioned in this report.


Thank you for introducing me to ZBT. I will have to learn more about it. I have been following my own breadth indicator by watching the % of O/B and O/S stocks along with the % in "no man's land', i.e. between 40% and 60%. It helps me decide when to enter the market. On Aug. 5, on this basis, (and my reading of THE MARKET MOSAIC ), I made a large purchase of QQQM, which is holding up nicely. Thank you!
Great work and cool charts per usual. The A/D Ratio making a strong print after an aggressive rally higher in the S&P's looks like it creates some short term exhaustion, but tough to call that bearish by any means.