
The Market Mosaic 8.24.25
Liquidity and economic growth can keep fueling the rally.

👋Welcome back to The Market Mosaic, where I gauge the stock market’s next move by looking at macro, technicals, and market internals. I’ll also highlight trade ideas using this analysis.
If you find this report helpful please hit that “like” button, share this post, and become a subscriber if you haven’t already done so!
🚨And be sure to check out Mosaic Traders Hub. It’s a members-only platform to alert trade ideas, track a model portfolio of open positions, and further analyze the message coming from the capital markets (👇be sure to check out our special offer below).
Now for this week’s issue…
A speech from Federal Reserve Chair Jerome Powell at the Fed’s Jackson Hole symposium flagged concerns over the labor market and ignited hopes for interest rate cuts.
Powell commented that policy is “in restrictive territory” and that “the shifting balance of risks may warrant adjusting our policy stance” in a nod to weakness in the July payrolls report and downward revisions to job growth in prior months.
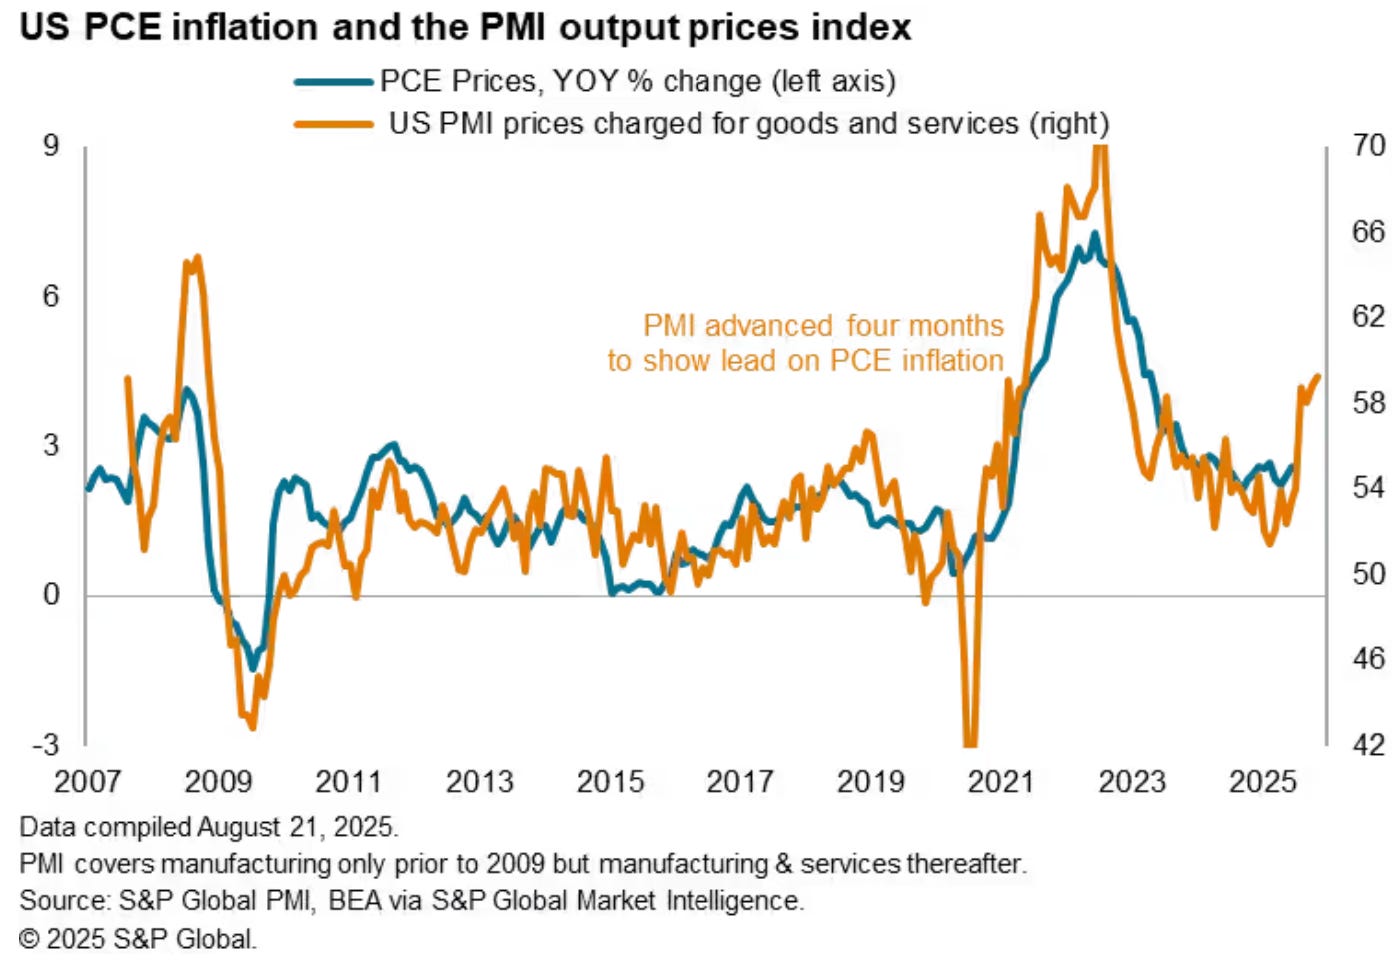
The comments came just two days following the minutes of the Fed’s most recent rate-setting meeting, which took place before the July payrolls report was released. The minutes noted that the majority of FOMC members saw upside to inflation outweighing employment risk. The chart below shows prices paid (orange line) from a business survey, which tends to lead PCE inflation (blue line).
The sudden pivot to concerns over the labor market is sparking hopes that rate cuts will resume. After cutting rates by 1.0% at the end of last year, the Fed has been on hold for eight months. Odds for a 0.25% rate cut at the next meeting in September jumped back to 90% following Powell’s comments.
But hopes for a prolonged cutting cycle could be misplaced. In the same speech, Powell noted that the Fed’s policy framework of “flexible average inflation targeting” would be scrapped.
That’s where the Fed tolerated an overshoot of its 2% inflation target if it meant supporting the labor market. That’s interesting given that core consumer inflation is running at 3.1% and looks poised to move higher.
If abandoning average inflation targeting means the Fed is becoming less tolerant of inflation above the 2% target, then you wouldn’t expect a dovish tone out of the Fed. That will make upcoming inflation and payrolls reports ahead of September’s rate-setting meeting crucial datapoints for the Fed.
This week, let’s look at why reducing rates could ignite the “risk-on” trade. We’ll also look at metrics pointing to a huge rebound in the average stock and why a looming commodities breakout could be the next warning on the inflation outlook.
The Chart Report
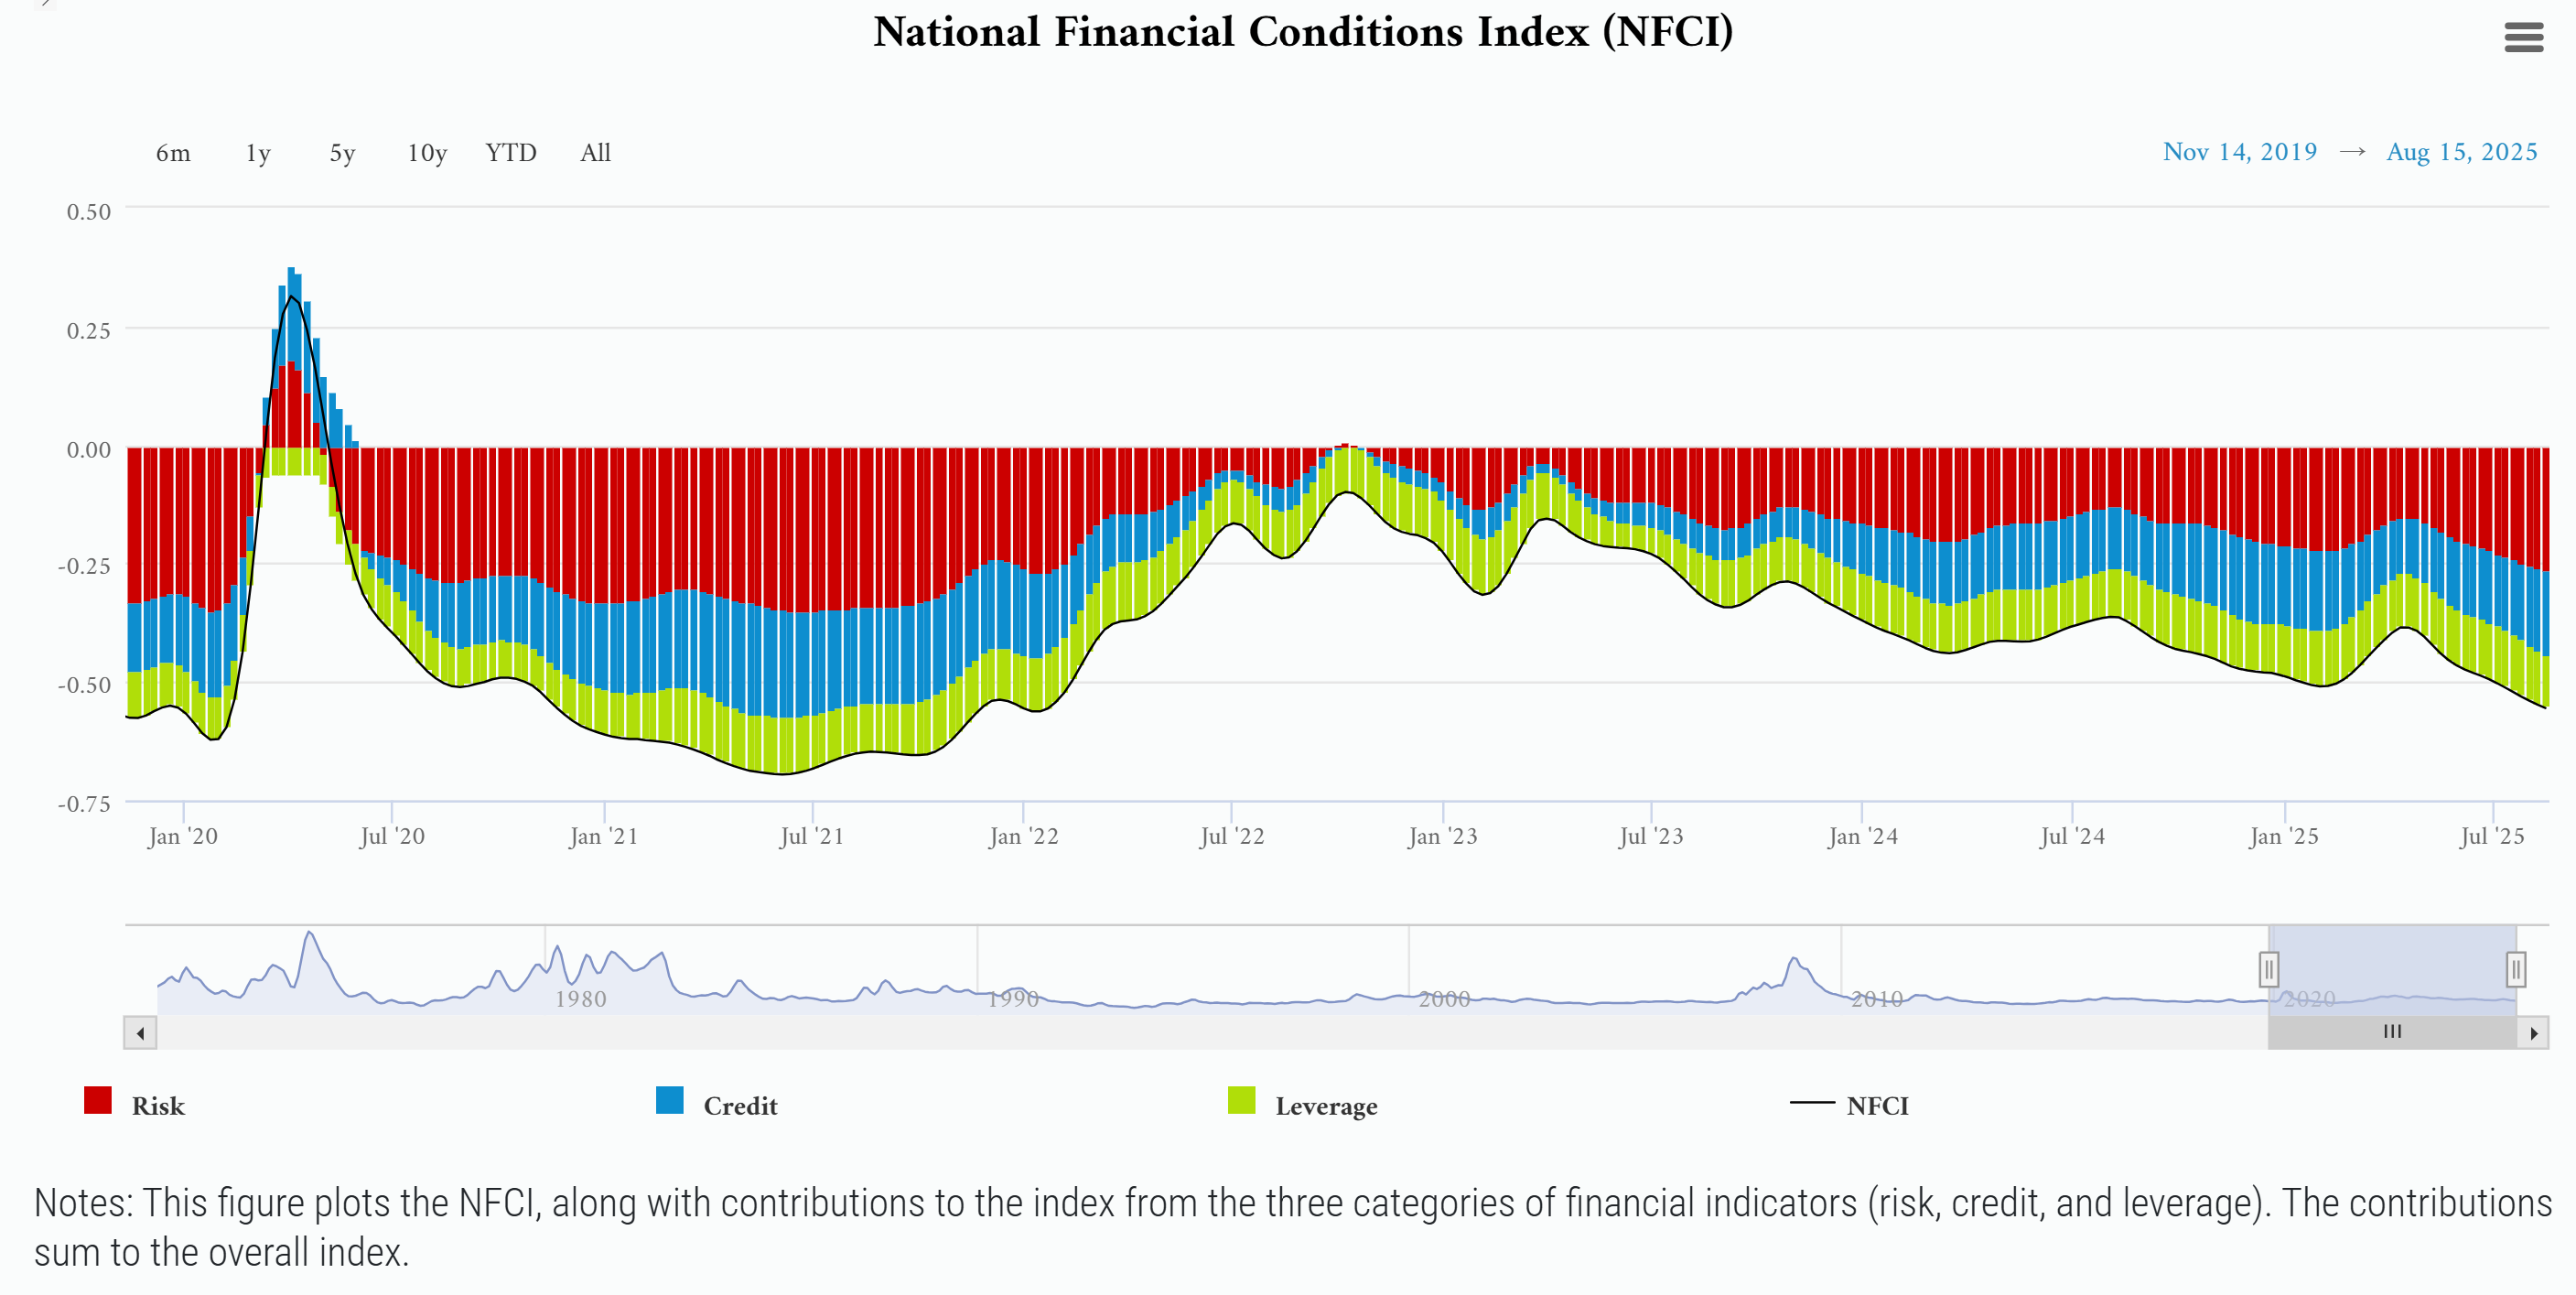
Liquidity and overall financial conditions play a key role in supporting speculative areas of the capital markets including stocks. Liquidity along with the cost and availability of credit are positively correlated with economic activity, and a strong economy is critical to support the corporate earnings outlook. The prospect of the Fed resuming its easing cycle while conditions are already loose is a massive tailwind for all sorts of risk assets like stocks and cryptocurrencies. The chart below shows a measure of financial conditions from the Chicago Fed district, where below zero points to looser than average conditions.
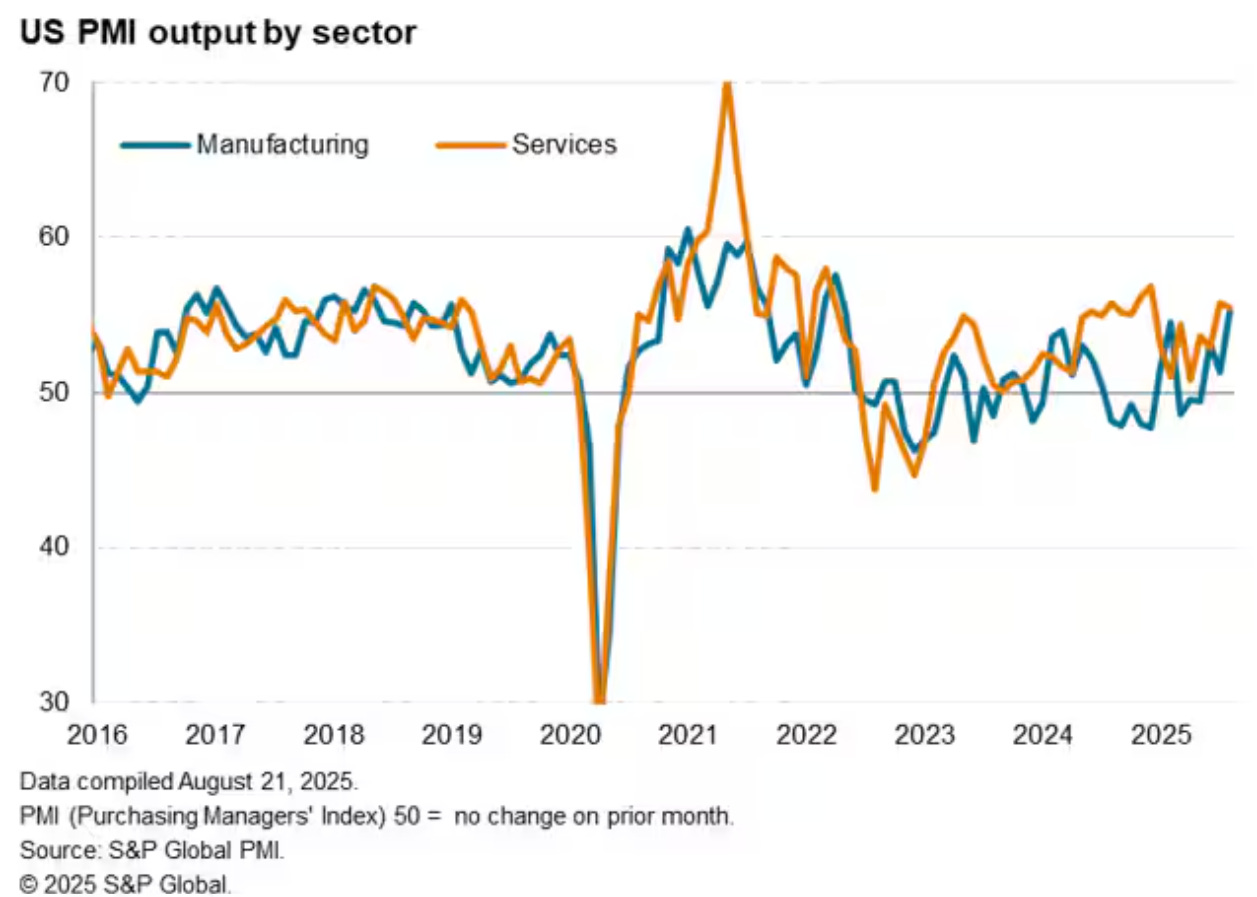
Loose financial conditions are positively correlated to economic growth, and rate cuts could boost the economy at a time when growth is likely stronger than feared. While much has been made of the weak July payrolls report, other estimates of economic activity are holding up. The most recent evidence comes from S&P Global’s Flash US PMI estimate. The PMI is built off a survey of senior executives, with a reading above 50 signaling expansion while below 50 indicates contracting activity. The composite PMI came in at 55.4 which is consistent with 2.5% annualized GDP growth. The chart below breaks down activity between the manufacturing (blue line) and services (orange line) sector. While services is holding up, manufacturing activity is seeing a bounce back following the drop around the start of the trade war.
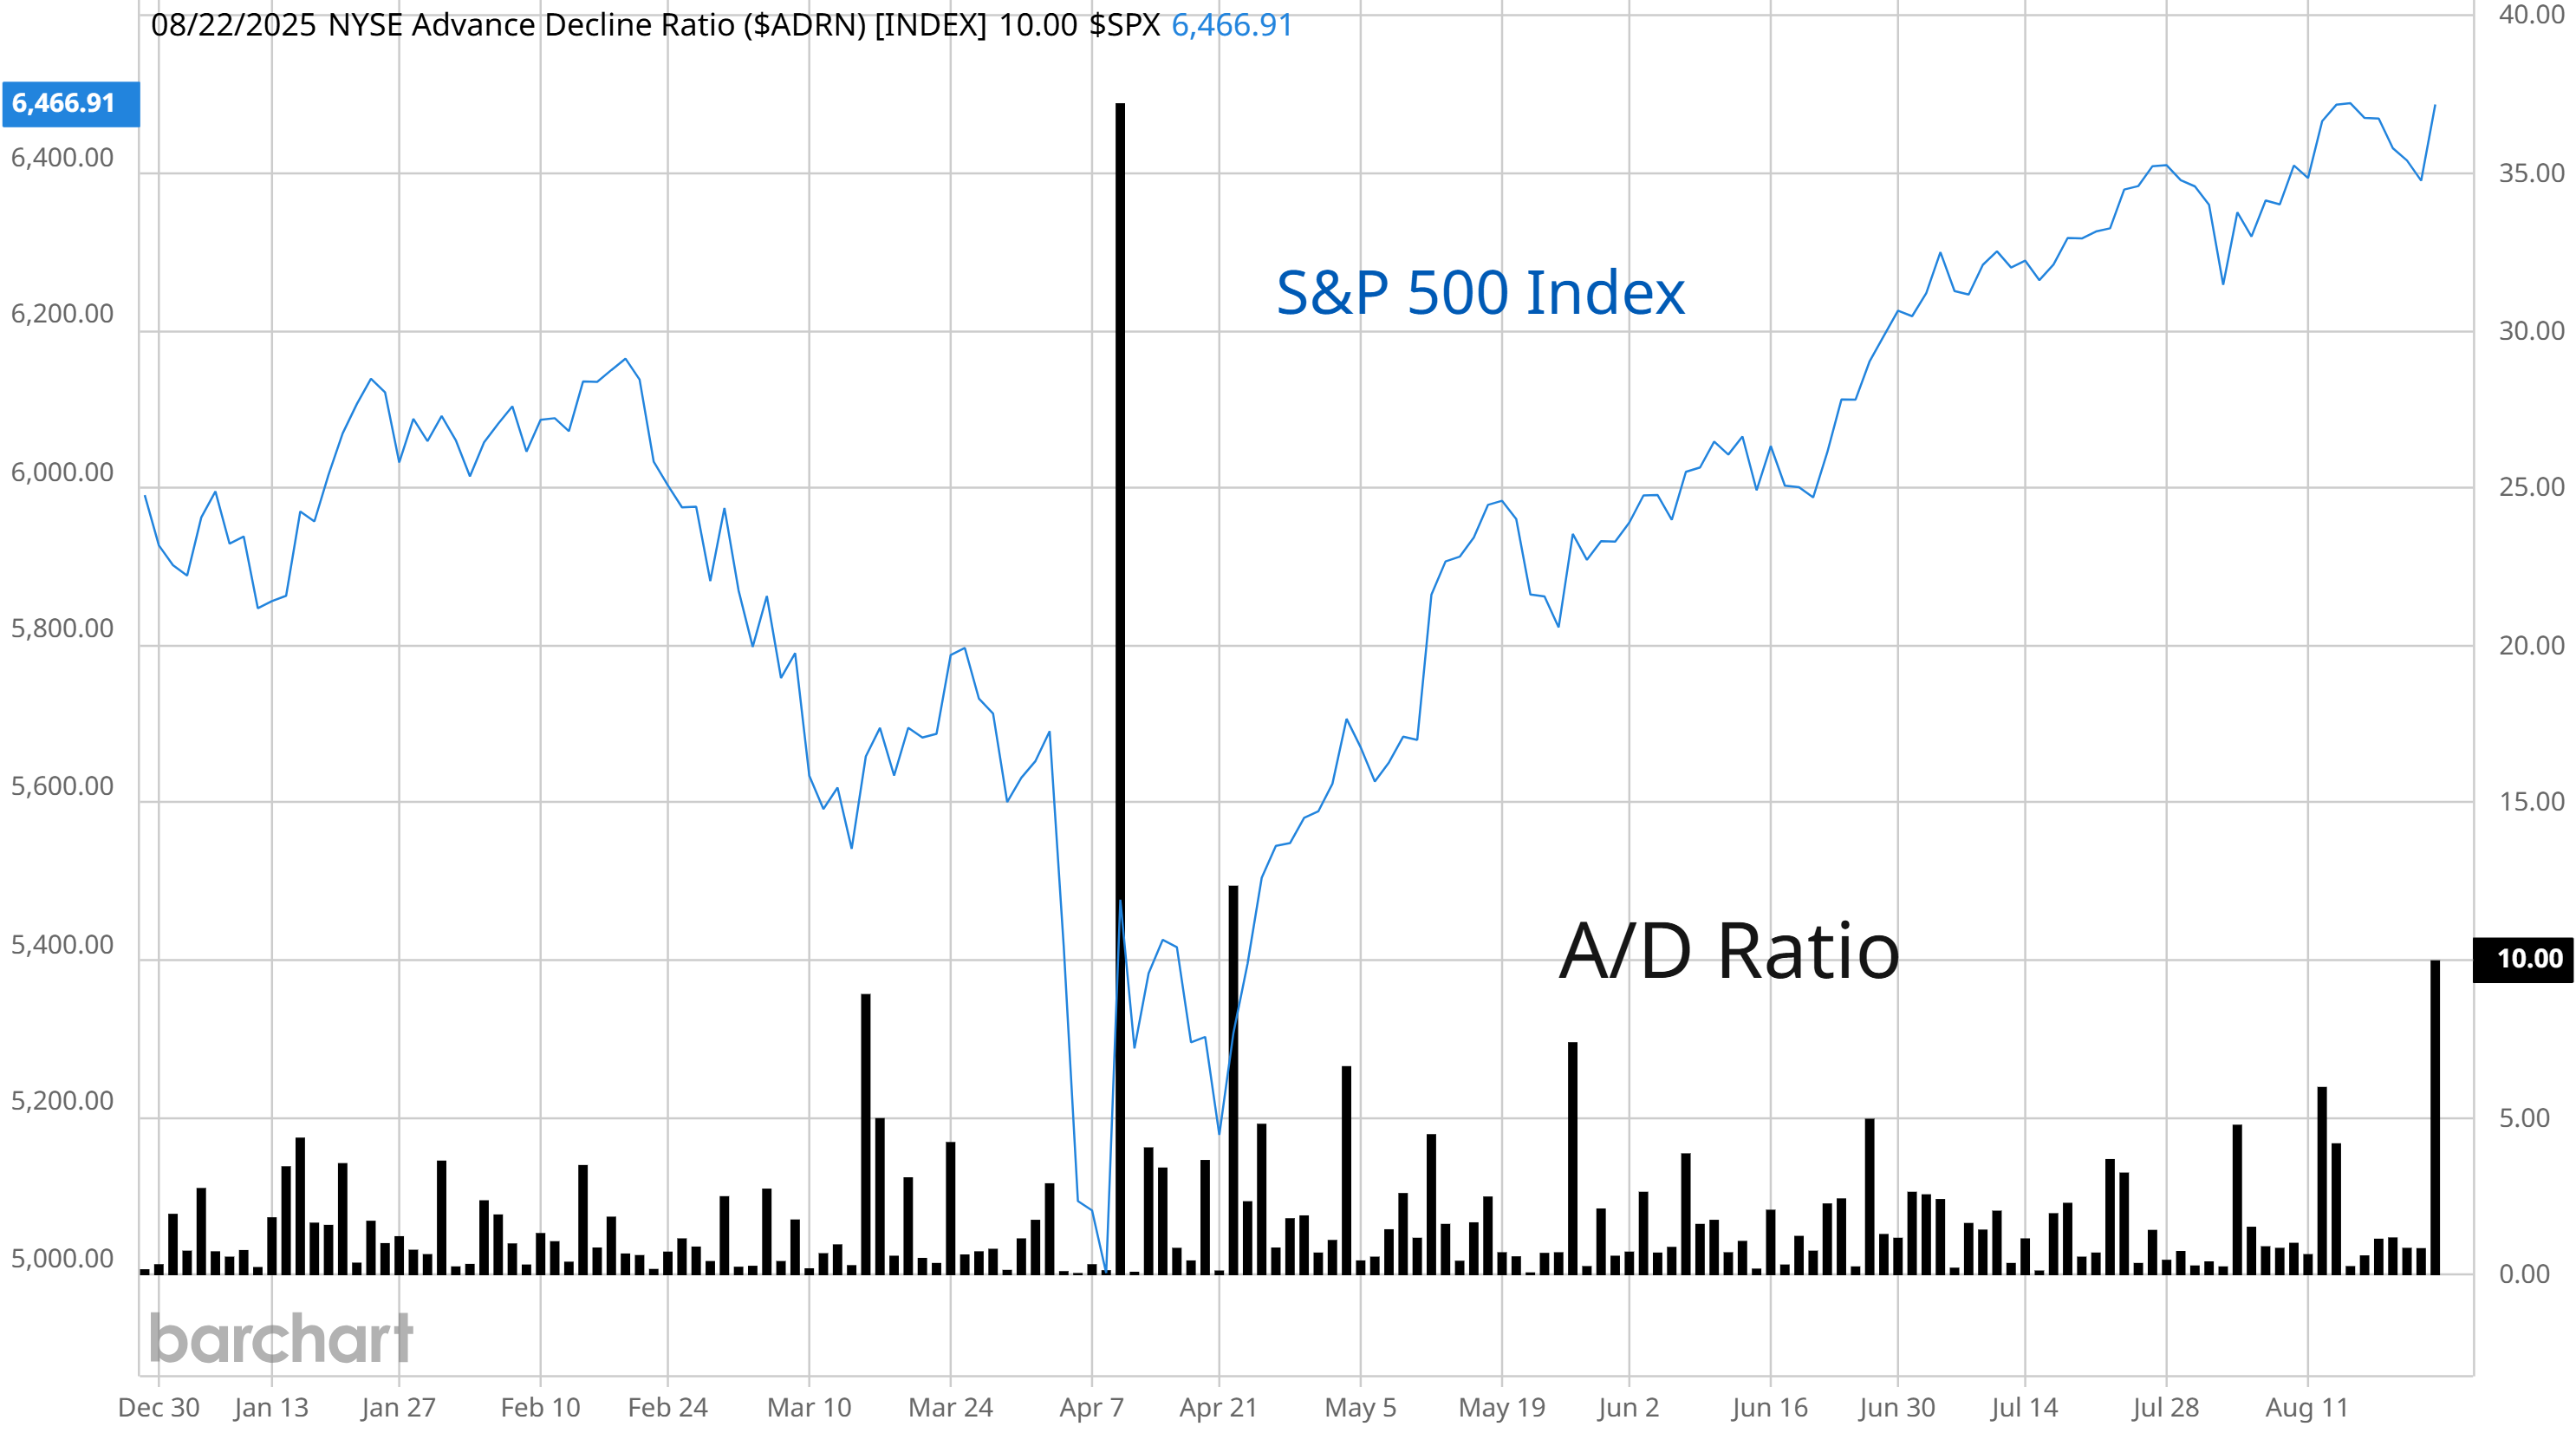
A combination of falling interest rates and positive economic outlook should be driving outperformance in the average stock, and breadth metrics are confirming. While the S&P 500 and Nasdaq Composite have led the way to new record highs, the Dow Jones Industrial Average and average stock in the S&P 500 (i.e. the equal-weight RSP ETF) are moving to new highs last week. Surging breadth is also showing up in advance/decline indicators. On Friday following Powell’s Jackson Hole speech, up volume on the NYSE as a percent of all volume was over 90%. The NYSE advance/decline ratio surged to 10/1 (chart below), which is the third highest reading on the year.
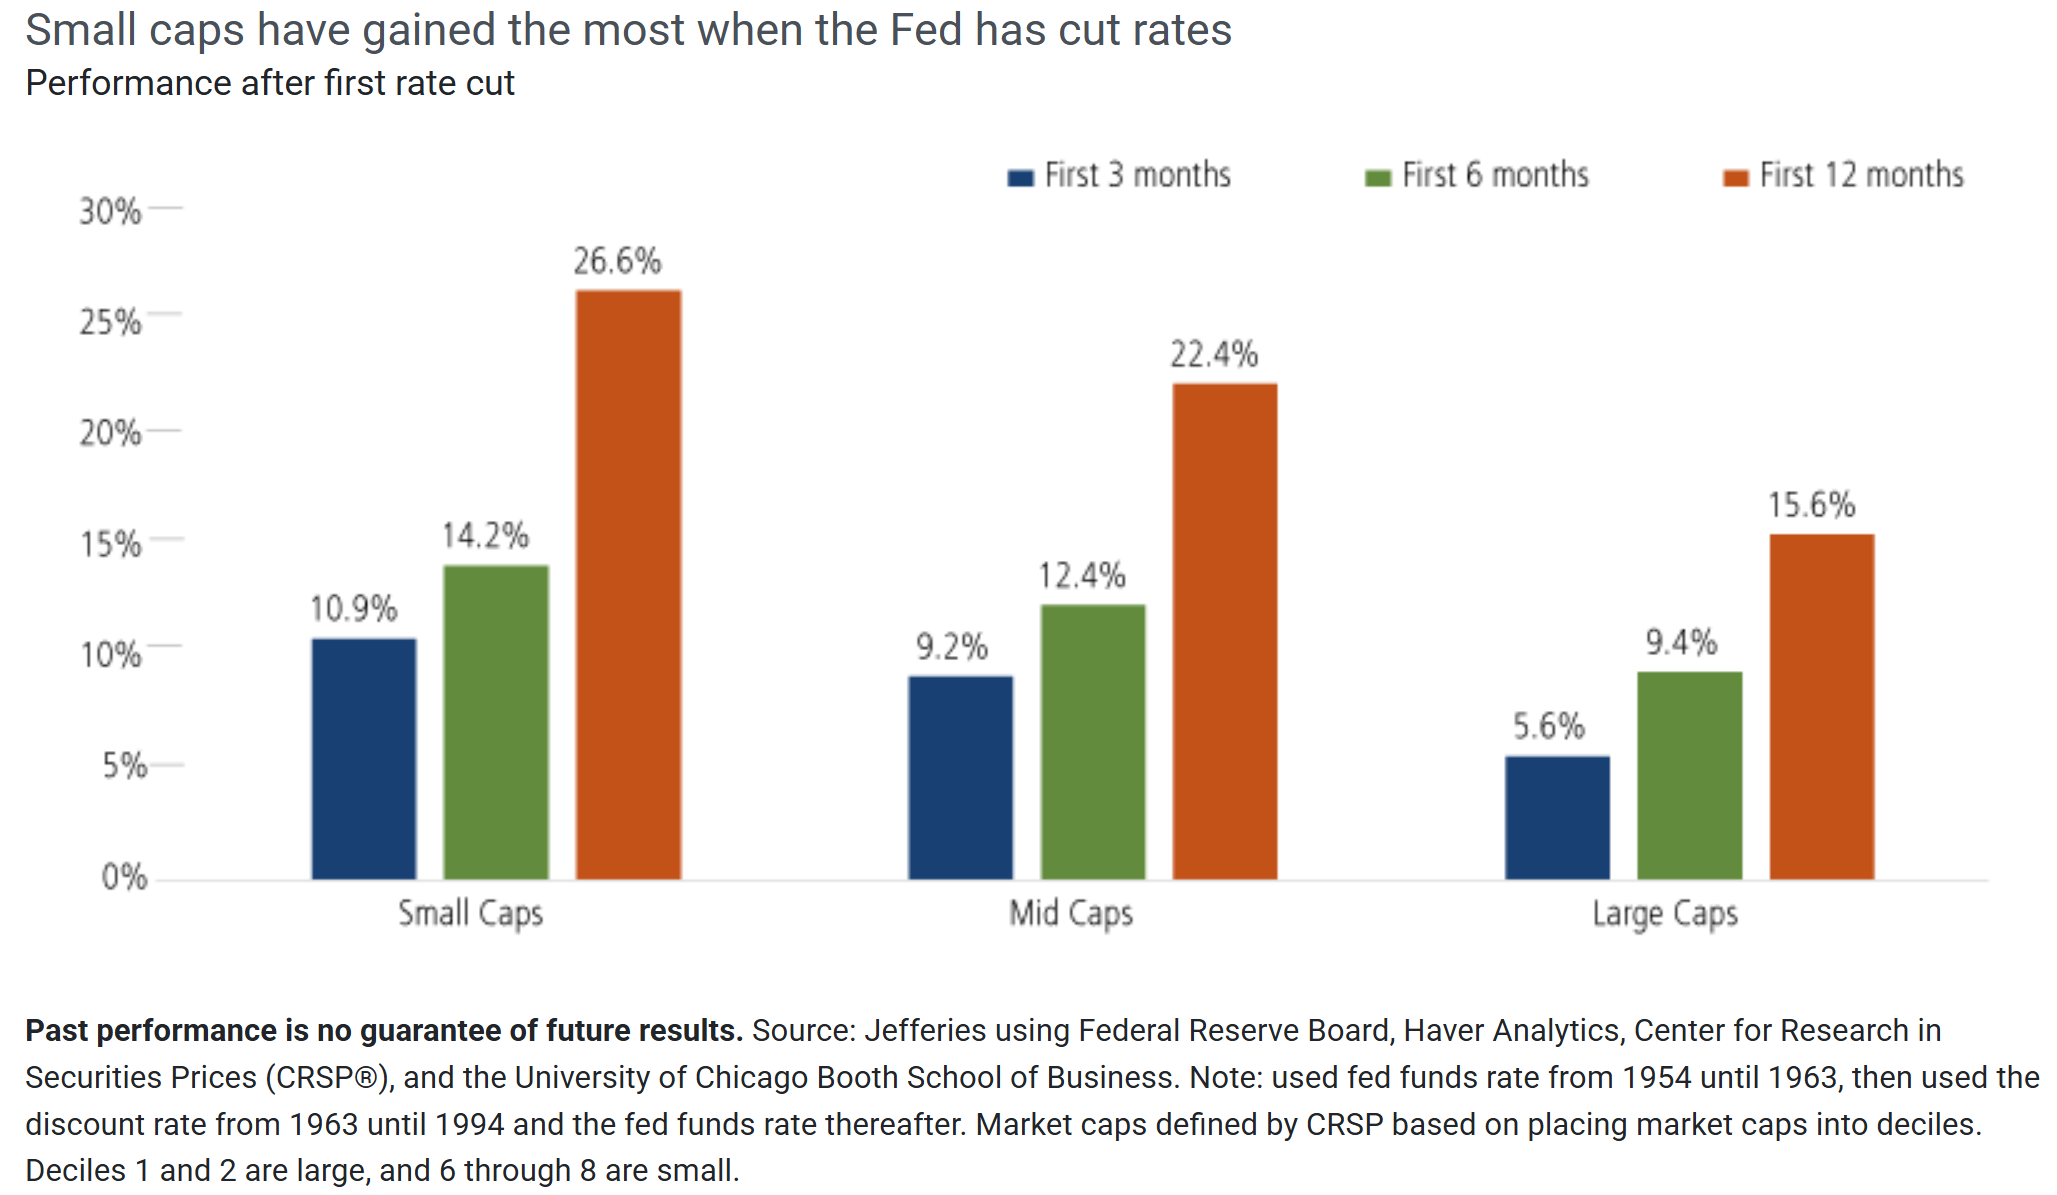
If the Fed resumes the rate-cutting cycle, then small-caps and the average stock in general could see a big boost. Small-caps get more of their revenues and earnings from the domestic economy, where falling rates could help the growth outlook. And approximately 33% of companies in the Russell 2000 Index of small-cap stocks are financed with floating rate debt compared to just 6% in the S&P 500. Historically, small-caps have outperformed both mid- and large-caps during the three-, six-, and 12-month periods when the Fed cuts rates using data going back to the 1950s (chart below).
While the Fed is shifting focus toward risks facing the labor market, the risk of accelerating inflation continues facing investors. Core CPI has moved higher over the past two months, and various leading indicators of inflation point to further rising price levels ahead. Commodities in general have a high inflation beta, and rising inflation expectations could happen alongside a breakout in broad commodity indexes and ETFs. The chart below plots an equal weight commodity index against 10-year inflation breakeven rates. A rally in commodity prices could present another tailwind for rising inflation (and headache for central bankers).

Heard in the Hub
The Traders Hub features live trade alerts, market update videos, and other educational content for members.
Here’s a quick recap of recent alerts, market updates, and educational posts:
Evidence that core inflation will move higher.
Economic signals from the junkiest of junk bonds.
Why it remains a constructive trading environment.
Historic precedent shows the Fed won’t cut rates by much.
New additions to the model portfolio to take advantage of strong breadth.
You can follow everything we’re trading and tracking by becoming a member of the Traders Hub.
By becoming a member, you will unlock all market updates and trade alerts reserved exclusively for members.
🚨Come see how we’re creating “asymmetry” in our model portfolio by letting our winners run and keeping losses small. You can join the Traders Hub with a special discount offer below:
👉You can click here to join now👈
Trade Idea
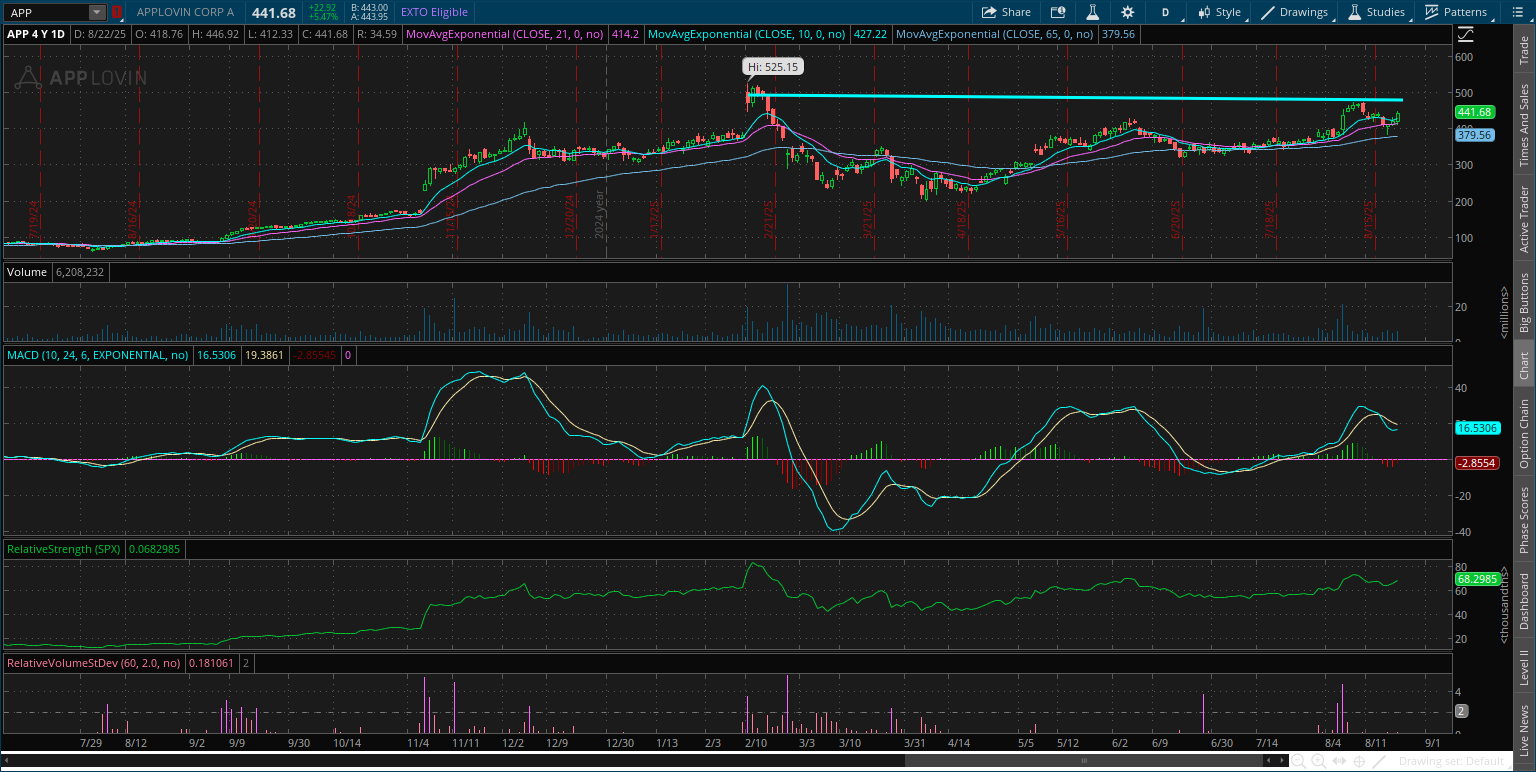
Applovin Corp (APP)
The stock had a huge run starting late last year that took the stock to the $500 level in February. APP is trading in a new basing pattern since then with a series of higher lows. The stock is making a smaller pullback off a recent test near prior resistance. I’m watching for over $500.
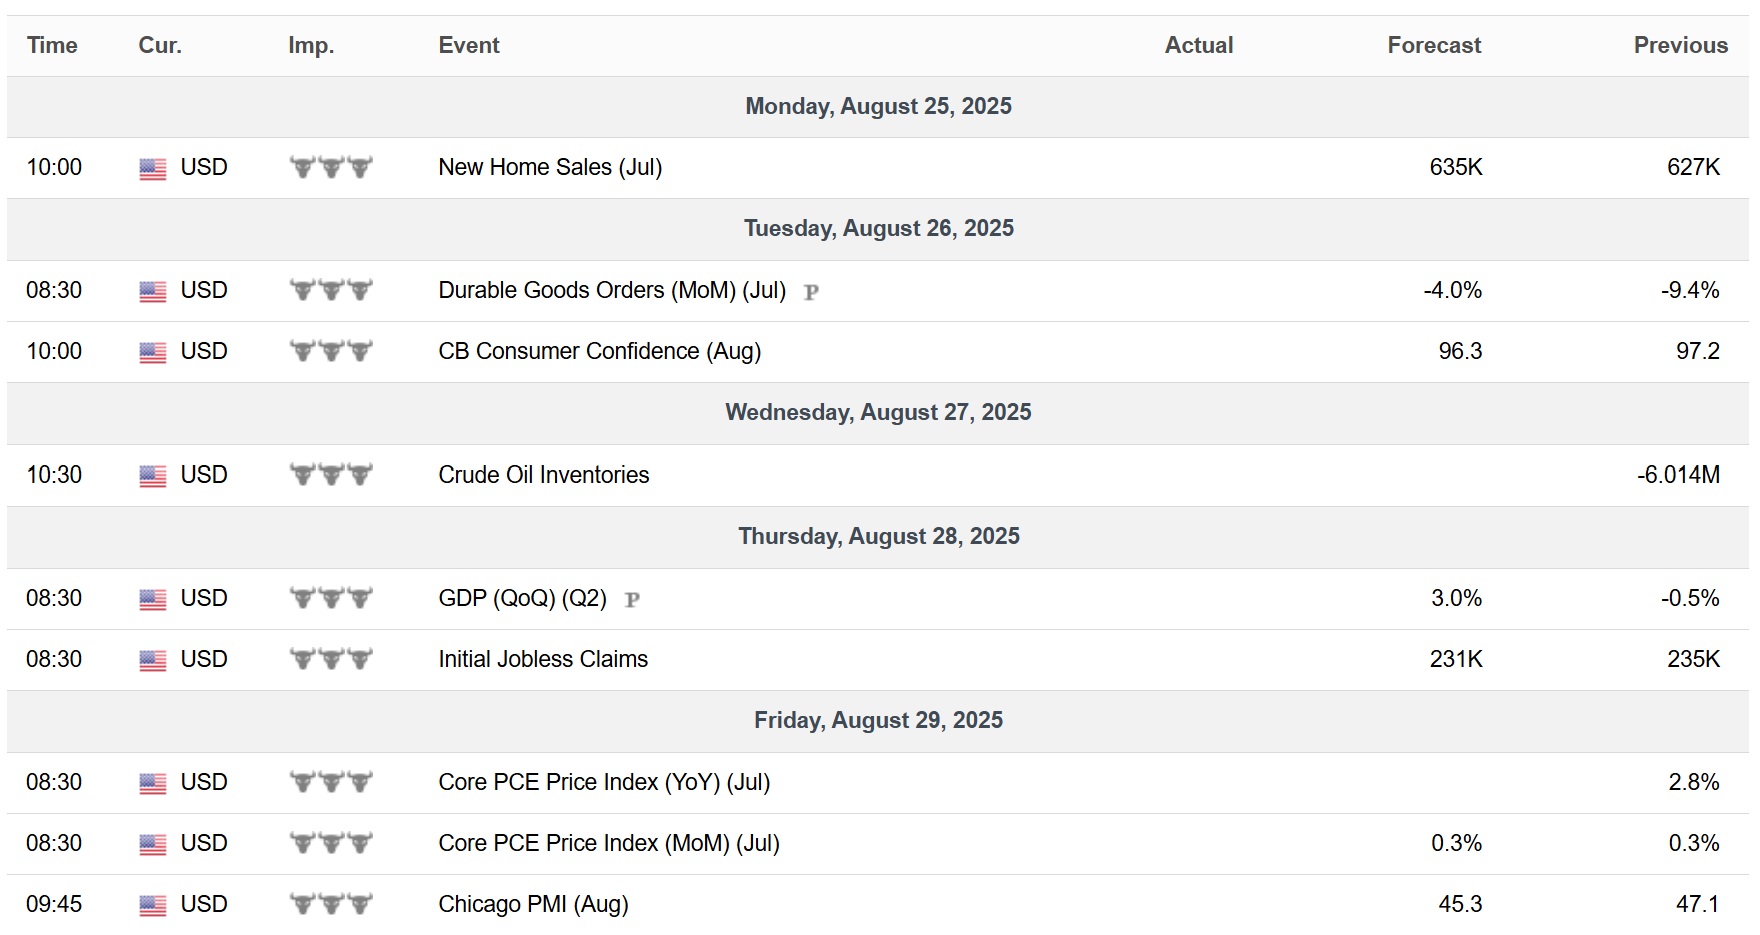
Key Upcoming Data
Economic Reports
Earnings Reports

I hope you’ve enjoyed The Market Mosaic, and please share this report with your family, friends, coworkers…or anyone that would benefit from an objective look at the stock market.
Become a member of the Traders Hub to unlock access to:
✅Model Portfolio
✅Members Only Chat
✅Trade Ideas & Live Alerts
✅Mosaic Vision Market Updates + More
Our model portfolio is built using a “core and explore” approach, including a Stock Trading Portfolio and ETF Investment Portfolio.
Come join us over at the Hub as we seek to capitalize on stocks and ETFs that are breaking out!
And if you have any questions or feedback, feel free to shoot me an email at mosaicassetco@gmail.com
Disclaimer: these are not recommendations and just my thoughts and opinions…do your own due diligence! I may hold a position in the securities mentioned in this report.